Scott Martindale

 
  by Scott Martindale
  CEO, Sabrient Systems LLC


Quick note 1: Sabrient’s new Dividend 56 Portfolio just launched on 5/6 as a 24-month portfolio holding 46 dividend-paying stocks across a range of market caps and sectors. It employs a Growth & Income strategy, offering a bond-like current dividend yield of 3.36% while seeking capital appreciation potential. Notably, the next-to-terminate Dividend 48 ends on 5/22 and currently shows a gross total return of +55% vs. +26% for S&P 500 High Dividend ETF (SPYD) and +44% for S&P 500 (SPY), as of 5/15.

Quick note 2: Sabrient employs a variety of fundamental financial factors in our quantitative models and portfolio selection process. Sabrient Scorecards for Stocks and ETFs are investor tools that provide access to several of our proprietary models for idea generation and portfolio monitoring. I invite you as well to visit https://MoonRocksToPowerStocks.com to immediately download founder David Brown’s latest book (an Amazon international bestseller) and 2 bonus reports (on investing in the Future of Energy and Space Exploration)—all in PDF format.

Overview

The market has been in parabolic mode—and it’s all about earnings, pricing power, and ROI (current and forward) rather than multiple expansion (or hope and prayers). As Bespoke Investment Group observed last week, following a 70% gain just since 3/31 the PHLX Semiconductor Index (SOX) was trading 36% above its 50-day moving average for only the third time in the past 30 years, with the other two occurring during the dot-com bubble. Moreover, the Nasdaq 100 (QQQ) was trading 15% above its 50-day moving average for the first time since 2009 (coming out of the GFC). However, today’s enthusiasm differs from prior speculative technology cycles in several ways. For instance, revenue growth tied to AI infrastructure has been tangible and substantial, particularly with datacenter businesses that fulfill the insatiable compute demand by housing high-density servers, GPUs, and networking equipment that act as the infrastructure backbone for cloud computing and AI training workloads. In other words, the rally is not being driven solely by narrative momentum like the dot-com boom—it is also driven by accelerating revenue generation and real cash flow and earnings.

Indeed, Q1 corporate earnings season has been particularly strong, beating even the most optimistic forecasts and providing big increases in forward guidance. Approximately 84% of S&P 500 companies have exceeded analyst profit expectations, representing the highest beat rate since 2021, according to FactSet. Large-cap companies, especially within Technology and Communications Services, continue to demonstrate operating leverage and strong margin resilience despite elevated interest rates and lingering inflationary pressures. According to DataTrek, “US Big Tech (ex-Nvidia) generated $183.4 bn in cash flow in Q1 2026 and spent $183.7 bn on CapEx and strategic investments….” We are entering a productivity boom, which is driving an historic earnings boom. Forward estimates are growing faster than they did in the mid-90s or late dot-com bubble years—and without having economic recovery comps to artificially boost them.

FactSet data shows that for Q1, with 89% of companies having reported, the S&P 500 in aggregate is showing a YoY earnings growth rate of +27.7% (the highest since +32.0% in Q4 2021). The sectors seeing the biggest increases are Information Technology (+50.7%); Communication Services (+48.8%); and Materials (+43.2%), while Healthcare trails with a negative growth rate of -3.1% (the only one negative). As for revenue growth, the aggregate is +11.4% YoY (the highest since +13.9% in Q2 2022), led by InfoTech at +29.2% and Comm Services at +15.0%. Moreover, analysts have increased their S&P 500 earnings estimate for CY2026 to $333.25—implying a P/E of 22.2x based on the closing price on 5/15. Thus the CY2026 EPS forecast suggests +21.3% YoY growth over CY2025 (vs. +17.1% expected as of 3/31, before the latest reports and guidance came out), and Tech is now indicating +38.7% YoY EPS growth (vs. +23.4% expected on 3/31).

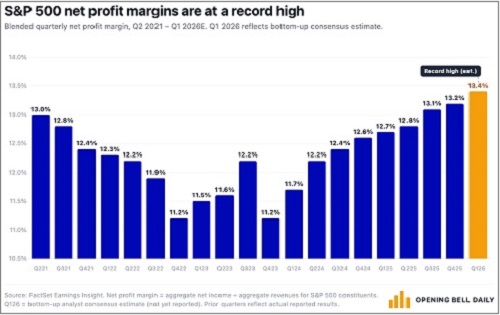
Furthermore, according to FactSet, Q1 2026 net profit margin for the S&P 500 (aggregated bottom-up) is tracking toward a record high (since data began publication in 2009) of 13.9% vs. the 5-year average of 12.3%, as illustrated in the chart below from Phil Rosen of Open Bell Daily. Notably, 6 of the 11 sectors are tracking above their 5-year average. And looking ahead, net margin is expected to climb to 14.6% by Q3. According to DataTrek Research, ““Earnings growth drives the narrative around price/earnings ratios, but it is trends in structural profitability that actually change investors' perceptions of underlying value…. Index valuations are increasing as a result, a natural if underappreciated outcome related to these improvements…and supports the argument for a ‘recession proof’ US economy.”

Net profit margins history chart

The Buffett Indicator (total US stock market cap divided by GDP) has reached 230% of GDP, far beyond even the 2000 dot-com bubble. And yet because of extraordinary earnings reports and optimistic forward guidance, P/E multiples are actually falling. For example, the next-12-months forward P/E for the Technology Select Sector SPDR (XLK) is 27.6x, down from its peak above 31 last October. Meanwhile, the S&P 500 trades at only 22.0x, down from 23.5x in October.

As for inflation and interest rates, I continue to believe the Fed is missing the mark and should be more accommodative. Incoming Fed chair Kevin Warsh will confront an FOMC that largely believes monetary policy should be tighter, with higher fed funds rate in the face of rising inflation readings. However, as I explain in my full commentary below, the latest inflationary surge is an event-driven supply shock—i.e., supply chain disruptions in the Strait of Hormuz and the resulting oil price spike (illustrated by the surging Global Supply Chain Pressure Index)—rather than structural (i.e., an overheated economy and excess consumer demand), many interest-rate-sensitive segments of the economy are still struggling. I believe that the fed funds rate should be 3.0% and that the 10-year Treasury note yield will eventually retreat back down to around 4.0%.

In my full commentary below, I discuss stock patterns and valuations, the AI-driven earnings boom, the 4-layer AI “stack” and its major players, GDP, productivity, inflation, liquidity, and Fed policy. And in my Final Comments section I discuss why the Iran oil supply shock is a reason to better diversify oil supply routes and pursue nuclear energy—not give license to ramp up solar, wind, and batteries. Then I close with my usual update on Sabrient’s sector rankings, positioning of our sector rotation model, and some top-ranked ETF ideas.

Despite narrow market breadth, Big Tech remains a must-own for its amazing growth and safe haven sentiment among investors. Still, 2026 should continue to be a good year for active stock selection, small caps, and bond-alternative dividend payers (particularly since the dividend yield on the S&P 500 is down to just 1.03%). Indeed, Sabrient’s Baker’s Dozen, Forward Looking Value, Small Cap Growth, and Dividend portfolios have been largely outperforming their benchmarks. Each is packaged and distributed as a unit investment trust (UIT) by First Trust Portfolios (https://ftportfolios.com).

By the way, our new Q2 2026 Baker’s Dozen Portfolio just launched on 4/17 as a 15-month portfolio with a mid-cap bias and a diverse group of 13 stocks across 8 business sectors (InfoTech, Financials, Industrials, Healthcare, Consumer, Comm Services, Energy, and Materials). Notably, last year’s Q1 2025 Baker’s Dozen terminated on 4/20 with a gross total return of +46.7% (vs. +20.3% for SPY), and the next-to-terminate Q2 2025 portfolio is up +56% vs +42% for SPY (as of 5/15). And, as a reminder, our Earnings Quality Rank (EQR) is licensed to the actively managed, low-beta First Trust Long-Short ETF (FTLS) as a quality prescreen. It has over $2.3 billion in AUM.

Sabrient’s models and selection process seek high-quality companies with strong growth trends and expectations. Specifically, it identifies stocks that are fundamentally strong with a history of consistent, reliable, resilient, durable, and accelerating sales and earnings growth, positive revisions to Wall Street analysts’ consensus estimates, a history of meeting/beating estimates, rising profit margins and free cash flow, high capital efficiency (e.g., ROI), solid earnings quality and conservative accounting practices, a strong balance sheet, low debt burden, competitive advantage, a wide moat, and a reasonable valuation compared to its peers and its own history.

These are the factors Sabrient employs in our quantitative models and “quantamental” portfolio selection process. You can learn how to access several of our proprietary models for idea generation and portfolio monitoring through Sabrient Scorecards, as well as download Sabrient founder David Brown’s latest book (an Amazon international bestseller), by visiting this link: Moon Rocks to Power Stocks

Here is a link to this post in printable PDF format, where you also can find my latest Baker’s Dozen presentation slide deck. As always, I’d love to hear from you! Please feel free to email me your thoughts on this article or if you’d like me to speak on any of these topics at your event!  Read on….

Scott Martindaleby Scott Martindale
President, Sabrient Systems LLC

In my prior commentary in early May, I wrote that investors were aggressively bidding up stocks and appeared to have “stopped looking over their shoulders with fear and anxiety and are instead focused on the opportunities ahead.” The S&P 500 was retrenching after a breakout to new highs in preparation for a major upside move driven by a risk-on rotation – which I expected would bode quite well for Sabrient’s Baker’s Dozen portfolios that have been predominantly composed of stocks from growth-oriented cyclical sectors and small-mid caps. After all, recession fears had subsided, US and Chinese economic data were improving, Q1 corporate profits were coming in better than expected, the Fed had professed that it had our backs, and of course, a resolution to the US/China trade impasse was imminent. Or so it seemed. Instead, the month of May gave stocks a wild ride.

It was exactly one year ago that President Trump escalated the trade war with China from simple threats of tariffs to actual numbers and dates, which ignited a risk-off rotation and a starkly bifurcated market, as the S&P 500 large-cap index continued to rise on the backs of defensive sectors and mega-caps while risk-on cyclical sectors and small-mid caps sold off. The big oversold risk-on recovery following Christmas Eve began to peter out in late-April as the S&P 500 challenged its all-time high, but then the breakdown in negotiations in last month created another risk-off market reaction reminiscent of last summer. In other words, stocks and investor sentiment have been jerked around by Trump’s tweetstorms.

I talk a lot more about China and the trade war in today’s commentary, but the upshot is that this problem has been festering for a long time, and to his credit, President Trump decided he wasn’t going to continue the practice of kicking the can down the road to a future administration. China clearly (and dangerously) is intent on challenging the US for global dominance – economically, technologically, and militarily – with its powerful brand of state-sponsored capitalism. I support the cause against China’s unfair practices, given the enormous importance for our nation’s future – even though the resulting lengthy period of risk-off sentiment (essentially 9 of the past 12 months) has been challenging for Sabrient’s growth-and-valuation-driven portfolios (which are dominated by the neglected cyclical sectors and smaller caps), as the negative news stream creates a disconnect between analyst consensus earnings estimates and investor preferences. Fund flows instead suggest strong demand for low-volatility and momentum strategies as well as fixed income (tilted to shorter maturities and higher credit quality), and the 10-year TIPS breakeven inflation rate has fallen to 1.73% (as worries of deflation have set in).

In response to the recession fears and rampant defensive sentiment, the FOMC felt compelled last week to issue a highly accommodative statement that essentially said, we got your back, which turned around the fading stock market. Fed chairman Jay Powell asserted that the trade war is on the list of the committee’s concerns and that the central bank would “act as appropriate to sustain the expansion,” i.e., cut interest rates if necessary. This explicitly reestablished the proverbial “Fed put” as a market backstop, and investors liked it. We already are seeing a somewhat weaker dollar, which could be a further boost to US equities (especially those that sell internationally).

My view is that the May pullback was another buy-the-dip opportunity, particularly in risk-on market segments, as the pervasive worries about imminent global recession and a bear market caused by escalating trade wars have little basis in reality. The latest defensive rotation, including shunning of cyclical sectors, relative weakness in small caps, and global capital flight into Treasuries causing plunging yields (and a 3-mo/10-yr yield curve inversion), has been driven by uncertainty rather than hard data. Every piece of worsening economic data can be offset with encouraging data, in my view. Yes, the economic expansion (consecutive positive GDP prints) has been going on for a longer-than-average period of time, but there is no time limit on expansions, i.e., they don’t die of old age but rather from excesses and inflation that must be reined in (but there is nary of whiff of inflation anywhere in the developed world). I still expect that a resolution to the trade war will send stocks in general, and risk-on market segments in particular, into orbit … but until then, it is hard to predict when investor sentiment will again align with the still-solid fundamentals.

In this periodic update, I provide a market commentary, offer my technical analysis of the S&P 500, review Sabrient’s latest fundamentals based SectorCast rankings of the ten US business sectors, and serve up some actionable ETF trading ideas. In summary, our sector rankings have turned neutral, while the sector rotation model retains its bullish posture. Read on…

Scott Martindaleby Scott Martindale
President, Sabrient Systems LLC

The S&P 500 and Nasdaq Composite indexes both hit new all-time highs this week on strong breadth, and all the major indexes appear to be consolidating recent gains before attempting an upside breakout. P/E multiples are expanding, particularly among large caps, as stocks rise despite a temporary slowdown in earnings growth. Why are investors bidding up stocks so aggressively? They have stopped looking over their shoulders with fear and anxiety and are instead focused on the opportunities ahead. And on that horizon, recession fears are falling, optimism regarding a US-China trade resolution is rising, US and Chinese economic data are improving, corporate profits are better than expected, and the Fed has agreed to step out of the way. All of this reduces uncertainty that typically holds back business investment. Stocks valuations are forward looking and a leading economic indicator, so they already seem to be pricing in expectations for stronger economic growth in the Q3, Q4, and 2020.

I said in my commentary last month that I thought we may see upside surprises in Q1 and Q2 earnings announcements, given the low bar that had been reset, and indeed we are seeing higher-than-average earnings beats – including big names like Apple (AAPL) and Facebook (FB), among many others – as half of the S&P 500 companies have reported. Moreover, the recent legal settlement between Apple and Qualcomm (QCOM) was a big positive news story that should now free up both companies to focus on 5G products, including step-function upgrades to smartphones, tablets, and computers, as the critical race with China for 5G dominance kicks into high gear.

Looking ahead, there are plenty of mixed signals for the economy and stocks – and no doubt the pessimists could fill a dossier with plenty of doom and gloom. But I think the pessimism has been a positive in keeping stocks from surging too exuberantly, given all the positive data that the optimists can cite. And on balance, the path of least resistance for both the economy and stocks appears to be upward. I think bond yields will continue to gradually firm up as capital rotates from bonds to equities in an improving growth and inflation environment, stabilizing the dollar (from advancing much further), while reducing the odds of a Fed rate cut in 2019. A healthy economy helps corporate earnings, while a dovish Fed keeps rates low and supports equity valuations. And as the trade war with China comes to resolution, I expect corporations will ramp up capital spending and guidance, enticing idle cash into the market and further fueling bullish conviction. Rather than an impending recession, we may be returning to the type of growth and inflation we enjoyed just prior to the tax reform bill, which would provide a predictable environment for corporate planning and steady (but not exuberant or inflationary) corporate earnings growth.

This should bode well not only for Sabrient’s Baker’s Dozen portfolios, but also for our other growth and dividend-oriented portfolios, like Sabrient Dividend and Dividend Opportunity, each of which comprises 50 growth-at-a-reasonable-price (aka GARP) stocks paying an aggregate yield in excess of 4% in what is essentially a growth-and-income strategy, and perhaps our 50-stock Small Cap Growth portfolios. As a reminder, I am always happy to make time for conversations with advisors about market conditions and our portfolios. We are known for our model-driven growth-at-a-reasonable-price (GARP) approach, and our model is directing us to smaller caps, as many of the high-quality large caps that are expected to generate solid earnings growth already have been “bid up” relative to small caps.

In this periodic update, I provide a market commentary, offer my technical analysis of the S&P 500, review Sabrient’s latest fundamentals-based SectorCast rankings of the ten US business sectors, and serve up some actionable ETF trading ideas. In summary, our sector rankings remain bullish, while the sector rotation model also maintains a bullish posture. Read on…

By Byron MacLeod, CFA
Associate Director of Research, Gradient Analytics, LLC

“Whatever you are, be a good one.” – Abraham Lincoln

We at Gradient Analytics are accounting experts. We evaluate companies for earnings sustainability, financial engineering, and accounting mismanagement. Unfortunately, many investors and portfolio managers may be unaware of the variety of levers enabling managers to aggressively recognize revenue, temporarily boost earnings, overstate assets, hide liabilities, or grow through acquisitions. Unaware investors can suddenly find that their supposedly “safe” investments have turned sour on them.

By monitoring the true quality of earnings, it becomes easier to judge a company’s true financial health.

The “Trump Bump” & Rising Correlations

Though the market appears to be recently dominated by Trump’s potential impact on the American economy, earnings quality trends continue to be relevant to stock prices.    Read more

byron / Tag: Donald Trump, IYZ, IYF, IEO, ITA, STI, CMA, QCOM, NRP, FMC, DGI, SPX / 0 Comments

Volatility continues to increase in the stock market and many of the leaders are breaking down. In particular, semiconductors took a rather big hit when one of the bellwethers warned of weakening global demand. Nevertheless, despite the significant headwinds, I do not think this spells the end of the bull market. But the technical damage to the charts is severe, particularly to the small caps, which are in full-blown correction mode. The large caps must show leadership and rally immediately -- or it will put at risk the critical and widely-anticipated year-end rally.

Bulls are having their way as summer draws to a close. Indeed, U.S. stocks and bonds seem to be the best and safest place to invest in a global economy that is at once hopeful and cautious, with lots of available cash hunting for attractive returns. But now the S&P 500 must deal with the ominous 2,000 level.

Scott MartindaleAs Q1 of 2014 comes to an end, we can see that January was extremely weak, February gained it all back, and March treaded water. At this point, as we head into what has been the strongest month of the year over the past 20 years, signals are mixed, with a steadily recovering economy and bullish fundamental indicators mixed with neutral technical and some bearish sentiment indicators.

smartindale / Tag: iShares, sector, ETF, SPY, VIX, EEM, FXI, iyw, IYF, IYH, IDU, IYK, IYC, IYZ, IYE, IYM, IYJ, SNDK, QCOM, COF, SPG, HP, SLB SOXX, PFI, IXC, XPH / 0 Comments

Scott MartindaleThere is no sugar-coating what happened to stocks on Friday. All around the world, stocks really took it on the chin as the usual support mechanisms that bulls have enjoyed failed to materialize. The S&P 500 sliced through firm support at 1800 on high volume like it wasn’t even there. But market participants had become convinced that a long-overdue correction was imminent, so they quite simply were looking for a reason to sell.

smartindale / Tag: iShares, sectors, ETF, SPY, VIX, iyw, IYF, IYH, IYJ, IYE, IYM, IYZ, IDU, IYC, IYK, biib, SLXP, IACI, QCOM, SBNY, AMP / 0 Comments

Scott Martindale“Stocks fall on Fed taper discussion.” That’s the gist of what you heard in the media on Wednesday to account for the market’s late-day pullback. There’s always some sort of attempt to explain daily market action. But the reality is that investors simply must take a periodic breather to regroup and retrench, particularly when making an assault on round-number resistance for a major index.

smartindale / Tag: sectors, iShares, ETF, SPY, VIX, TSLA, MA, SBNY, CACI, QCOM, JAZZ, GNW, ALK, IYF, iyw, IYK, IYH, IYE, IYM, IYJ, IYZ, IDU, IYC / 0 Comments

Scott MartindaleThe intransigence continues in Washington, and it has kept stock market buyers at bay until they get the go signal from Congress. This has left the sellers in control as investor sentiment has temporarily shifted from a buy-the-dip mentality to protect-your-gains and preservation-of-capital.

smartindale / Tag: iShares, ETF, sectors, SPY, VIX, TSLA, CACI, QCOM, MPC, EOG, iyw, IYE, IYF, IYK, IYJ, IYC, IDU, IYM, IYZ, IYH / 0 Comments

Pages