Sector Detector: Anticipation builds for US/China trade agreement amid encouraging earnings beats
 by Scott Martindale
President, Sabrient Systems LLC
The S&P 500 and Nasdaq Composite indexes both hit new all-time highs this week on strong breadth, and all the major indexes appear to be consolidating recent gains before attempting an upside breakout. P/E multiples are expanding, particularly among large caps, as stocks rise despite a temporary slowdown in earnings growth. Why are investors bidding up stocks so aggressively? They have stopped looking over their shoulders with fear and anxiety and are instead focused on the opportunities ahead. And on that horizon, recession fears are falling, optimism regarding a US-China trade resolution is rising, US and Chinese economic data are improving, corporate profits are better than expected, and the Fed has agreed to step out of the way. All of this reduces uncertainty that typically holds back business investment. Stocks valuations are forward looking and a leading economic indicator, so they already seem to be pricing in expectations for stronger economic growth in the Q3, Q4, and 2020.
I said in my commentary last month that I thought we may see upside surprises in Q1 and Q2 earnings announcements, given the low bar that had been reset, and indeed we are seeing higher-than-average earnings beats – including big names like Apple (AAPL) and Facebook (FB), among many others – as half of the S&P 500 companies have reported. Moreover, the recent legal settlement between Apple and Qualcomm (QCOM) was a big positive news story that should now free up both companies to focus on 5G products, including step-function upgrades to smartphones, tablets, and computers, as the critical race with China for 5G dominance kicks into high gear.
Looking ahead, there are plenty of mixed signals for the economy and stocks – and no doubt the pessimists could fill a dossier with plenty of doom and gloom. But I think the pessimism has been a positive in keeping stocks from surging too exuberantly, given all the positive data that the optimists can cite. And on balance, the path of least resistance for both the economy and stocks appears to be upward. I think bond yields will continue to gradually firm up as capital rotates from bonds to equities in an improving growth and inflation environment, stabilizing the dollar (from advancing much further), while reducing the odds of a Fed rate cut in 2019. A healthy economy helps corporate earnings, while a dovish Fed keeps rates low and supports equity valuations. And as the trade war with China comes to resolution, I expect corporations will ramp up capital spending and guidance, enticing idle cash into the market and further fueling bullish conviction. Rather than an impending recession, we may be returning to the type of growth and inflation we enjoyed just prior to the tax reform bill, which would provide a predictable environment for corporate planning and steady (but not exuberant or inflationary) corporate earnings growth.
This should bode well not only for Sabrient’s Baker’s Dozen portfolios, but also for our other growth and dividend-oriented portfolios, like Sabrient Dividend and Dividend Opportunity, each of which comprises 50 growth-at-a-reasonable-price (aka GARP) stocks paying an aggregate yield in excess of 4% in what is essentially a growth-and-income strategy, and perhaps our 50-stock Small Cap Growth portfolios. As a reminder, I am always happy to make time for conversations with advisors about market conditions and our portfolios. We are known for our model-driven growth-at-a-reasonable-price (GARP) approach, and our model is directing us to smaller caps, as many of the high-quality large caps that are expected to generate solid earnings growth already have been “bid up” relative to small caps.
In this periodic update, I provide a market commentary, offer my technical analysis of the S&P 500, review Sabrient’s latest fundamentals-based SectorCast rankings of the ten US business sectors, and serve up some actionable ETF trading ideas. In summary, our sector rankings remain bullish, while the sector rotation model also maintains a bullish posture. Read on…
Market Commentary:
The rally continues:
While the S&P 500 and Nasdaq have achieved new highs, the Dow isn’t far behind, and only the Russell 2000 small cap index is still about 9% below its high, but it too seems to be ready to attempt to break out above the 1600 level. Since the Christmas Eve “capitulation day,” the Nasdaq has climbed +31% and the S&P 500 +26% through the end of April. Strong breadth has been notable so far this year, led by the Technology sector with +37%, and with strong supporting performance from Consumer Discretionary, Financials, Industrials, and the new Communications Services sector, all of which are up +25% or more since Christmas Eve. Equal-weighted indexes (another indicator of market breadth versus the cap-weighted versions) are right in line – for example, the Invesco S&P 500 Equal-weight (RSP) has the same performance as the cap-weighted SPDR S&P 500 ETF (SPY).
Notably, the highly-cyclical Semiconductor industry has shown strong leadership (+42% from Christmas Eve through April for the SMH) while presenting a more upbeat tone and an upturn from a cyclical bottom (due to temporary oversupply, partly due to a demand falloff after the huge surge in cryptocurrency mining tools), while crude oil has broken out solidly above overhead resistance at $60. Moreover, Barron’s wrote of the bullishness of rising yield spreads and the macro factors that suggest continued widening, including a dovish Fed and rising oil prices potentially leading to that elusive uptick in inflation.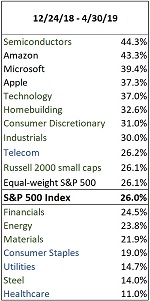
On the other hand, Healthcare companies have been doing well from a financial/business standpoint, but investors have grown increasingly cautious given the ominous presidential campaign rhetoric about various federal government-sponsored healthcare plan proposals – perhaps reminiscent of the early campaigning in 2015 when attacks on Pharmaceuticals industry pricing caused a pullback from which that market segment still hasn’t recovered. The accompanying table illustrates the relative performance of various cyclical and defensive market segments and the three juggernaut mega-caps (AAPL, MSFT, AMZN):
An upside surprise in GDP:
Of course, the big news last week was the strong initial GDP print for Q1 reported by the BEA, growing at a +3.2% annual rate (the strongest Q1 since 2015), due primarily to increases in consumer spending, business inventories, and exports, while inflation indications from core PCE price index (personal consumption expenditures excluding food & energy, which is the Fed’s metric of choice for inflation) slowed to 1.3% qoq growth (well below their 2.0% target). Several weeks back, so many prognosticators were expecting flat or even negative growth, but forecasts kept rising up until the announcement. Going into Friday’s announcement, Bloomberg’s polling consensus of economists was about +2.3%. Atlanta Fed’s GDPNow forecast fell to only +0.2% in mid-March, and then later reached +2.7% qoq growth, while the New York Fed’s NowCast report expected +1.4%, and the St. Louis Fed’s GDP Nowcast estimate was +1.9%.
So, the BEA’s number of +3.2% seems to have blown away everyone’s estimates. However, although consumer spending slightly beat lowered expectations, overall consumer and business spending were lackluster, which has many commentators discounting the strong GDP print, and they think the rise in inventories and exports were related to fears of escalation in trade wars with China and Europe and will likely cool in upcoming quarters. But these metrics are all mostly lagging or coincident indicators rather than leading indicators, and as Brian Wesbury at First Trust opined, the data is already showing signs of a strengthening in consumer spending and homebuilding. Looking ahead to 2Q2019, the Atlanta Fed’s GDPNow model (as of May 1) issued an initial estimate 1.2% GDP growth while the NY Fed’s NowCast says 2.1%, so these forecast models aren’t yet reflecting much acceleration. The IMF forecasts US GDP growth to average 2.3% for full-year 2019 and 1.9% in 2020.
I have been eager to see the Q4 reading for real Gross Output (GO), which is gaining traction as a key metric among economists since it measures total economic activity including transactions within the supply chain and not just final products. It always takes a bit longer to come out than GDP, so while the first estimate of Q1 GDP came out last Friday, we finally saw GO for Q4 come out the prior Friday – and it indicated +2.3% growth (while Q4 GDP was +2.2%). For comparison, Q3 GO growth came in at +3.9% while GDP growth measured +3.4%. Historically, when GO grows faster than GDP, it foreshadows continued strong growth, and Q4 saw GO still slightly ahead of GDP.
So, it appears that the economies of the US and China are both improving while global economic conditions elsewhere are generally stabilizing. China had to reverse course on its deleveraging efforts to boost stimulus like increased business lending, tax cuts, and infrastructure spending (including 3,200 km of additional high-speed rail lines). Moreover, there is little indication of inflation in any developed market such that the Fed and other central banks are likely to remain accommodative for the foreseeable future, or until inflation does begin to flare up. However, China’s extreme debt situation (which I have written about extensively) will require it to quickly refocus on deleveraging (especially the pervasive and insidious off-balance sheet “shadow banking”) and suppressing rampant housing market speculation. This remains the biggest risk to the global economy, in my view, but I believe it is a longer-term issue rather than an imminent one.
This is all bullish for equities, and yield-hungry global capital continues to flow into both US equities and US Treasuries, which has kept a lid on Treasury yields, which in turn justifies higher P/E multiples for stocks (on either a discounted cash flow basis or on a relative yield basis). Moreover, the Fed has not only stopped further rate hikes and announced that its balance sheet run-off would stop in September, but as excess reserves have fallen to $1.4 trillion, indications are increasing that the US financial system may actually need more liquidity (e.g., JP Morgan pointed out that the ratio of reserve balances at the Federal Reserve to total assets of US banks has fallen below 9% for the first time since early 2011), which might lead the Fed to halt further quantitative tightening even sooner. Notably, in Fed chair Jay Powell’s post-FOMC press conference, he noted that they will immediately reduce the proportion of Treasuries being rolled off until the balance sheet reductions end in October – at which time mortgage-backed securities will continue to roll off at a pace of $20 billion per month, but those proceeds will be reinvested in Treasuries, keeping the balance sheet size the same. Evidently, the Fed wants to keep a bid under Treasuries to ensure longer-term interest rates remain modest.
The Fed remains in its dove’s nest:
After a brief inversion of the 3-month/10-year yield curve following the March FOMC meeting when all those dovish announcements were made (and as I pointed out last month, it was likely a false signal due to too much market intervention by central banks’ QE rather than inflation – and by the way, the 2-year/10-year spread never did invert), spreads have widened a bit as economic optimism grows and US equities attract capital flows. The 10-year US T-note closed April at 2.50%, the 2-year at 2.27%, and the 3-month T-bill at 2.43%, although the 3-month/10-year spread is only 7 bps, the 2-10 spread has widened to 23 bps. The US 10-year yield continues to look quite good compared with other developed market 10-year yields, like Australia at 1.78%, Canada at 1.71%, UK at 1.17%, France at 0.37%, Germany at 0.012%, and Japan at -0.039%. Even troubled Italy only pays 2.57% – a mere 7 bps more than the US. Notably, Deutsche Bank recently reported that there is roughly $10 trillion invested in European bonds paying negative yields.
Wednesday’s May FOMC meeting concluded with no action on rates, as expected – despite President Trump’s unsolicited opinion that rates should be cut by 1% (!), ostensibly to give the economy the 1-2 punch of monetary-plus-fiscal stimulus that he has wanted all along (and perhaps a 1-2-3 punch if he can consummate his tentative pact with Dems on big infrastructure spending package). Following the FOMC announcement, CME Group fed funds futures gyrated around quite a bit. By the end of the day, they placed zero probability of another rate hike by January 2020 and instead indicate a 56% probability of at least one 25-bp rate cut by then (down from 70% prior to the announcement), and a 17% chance of more than one rate cut (down from 25% prior).
Recession on the horizon?
The significant odds of a rate cut might sound like an economy on the verge of recession and in need of renewed monetary stimulus. Indeed, there are a number of indicators that many pundits say point toward a recession within the next 18 months, including a (briefly) inverted yield curve, persistently low inflation, less-than-satisfying metrics underlying the latest Q1 GDP print, corporate earnings contraction expected in Q1-Q2, high corporate debt levels, etc. Typically, rising inflation is considered a hallmark of a robust economy. For example, during the “reflation trade” of 2016, the dollar fell and gold rallied, but that’s not happening this year. Nevertheless, I think the high odds of a Fed rate cut this year (reflected in the fed funds futures) will soon decline as geopolitical risks recede and a trade deal with China is inked, leading US companies to ramp up capital spending and forward guidance.
Thus, I continue to believe that the economy is not really late-cycle (as so many others take as a given), but more like the latter stages of mid-cycle, as we simply haven’t had much in the way of capex growth in quite some time, nor have we seen the proverbial “boom” stage of the economic cycle. After all, expansion cycles don’t end due to old age (and I will note here that Australia has enjoyed 28 straight years of consistently positive quarterly GDP growth). BlackRock CEO Larry Fink recently made a much-quoted remark, “We have a risk of a melt-up, not a meltdown,” citing the record amounts of idle cash held by overly-cautious investors that may suddenly flow into the market and drive prices sharply higher from a Fear of Missing Out (aka FOMO). But I’m not expecting that such an occurrence would denote a proverbial “blow-off top” and an end to this bull market, as he may have been implying. Rather, I agree with what JP Morgan’s Jamie Dimon said after his stellar Q1 earnings report, “If you look at the American economy, the consumer is in good shape, balance sheets are in good shape, people are going back into the workforce, companies have plenty of capital…It could go on for years.” Fed chair Jay Powell seems to feel the same way.
As for any signs of recession on the horizon, DataTrek has pointed out in their Morning Briefings that the S&P 500 companies show a dividend payout ratio (dividends divided by net income) of approximately 35%, which makes the aggregate dividend payment seem pretty safe. They are also encouraged by a lowly 3.8% unemployment rate, rising labor participation rates, ultra-low levels of initial claims for unemployment, rising home prices (further supported by falling mortgage rates), strong pricing of late-model used vehicles, and no sign of a disruptive price spike in oil prices (which has preceded every US recession since 1973). Core inflation has remained low and steady since 2010 despite the Fed’s attempts to raise it, and there remain no signs that core inflation will ramp up anytime soon. The 5-year TIPS continue to price in muted inflation expectations of 1.86%. But as DataTrek has pointed out, low volatility in the inflation reading translates into low volatility in bond prices, which in turn translates into low volatility in stocks. Indeed, investors have been reluctant to sell, and the CBOE Volatility Index (VIX) closed April at 13.12 – well under the 15 level that typically demarks a move from complacency to fear.
Although there has been legitimate concern that aggregate (cap-weighted) corporate earnings forecast for the S&P 500 companies has been revised downward to flat or negative for the first couple of quarters of 2019, that’s not the whole story. As Brian Wesbury of First Trust recently pointed out, the median projected earnings growth is in the 6-7% range, and even aggregate earnings is expected to return to a growth track in 2H2019 and 2020, so there are still many individual names displaying solid earnings growth.
Not to be overlooked, aggregate revenue projections for S&P 500 companies are expected to remain solid all year (in the 4.5-5.0% range, yoy versus the same quarter last year) and then increase in 2020. However, net margins are down (so far, about 10.9% -- versus a peak of 12.0% in 3Q2018), likely due to higher costs (such as wages and raw materials). Looking ahead, analysts expect higher net profit margins (around 11.5%) over the next few quarters.
The next 12 months (NTM) forward P/E ratio is nearly 17x (implying 5.9% earnings yield), which although elevated is still quite attractive given a 10-year Treasury yield around 2.5%, strong GDP growth, strong consumer sentiment, rising business investment, a dovish Fed, rising optimism about a trade deal with China, and supply/demand dynamics of capital flows leaving non-US equity funds and moving into US equity funds. As I have been opining for quite some time, the US is where I believe equity investors should be focused, and indeed, the US has continued to outperform. And although the aggregate forward P/E is elevated at 17x, we can still find some high-quality individual names with more attractive valuations, particularly among neglected small-mid caps.
Controversy around the torrid pace of buybacks:
Of course, S&P 500 companies have continued their torrid pace of share repurchases/retirement this year after last year’s record levels, with an expectation for nearly $1 trillion put to work this year, driven by tax savings and low interest rates. Warren Buffett is one who is willing to use cash to reward shareholders when he believes market conditions have undervalued Berkshire Hathaway (BRK.A), as he bought back $233 million in stock during the depths of the Q4 swoon between 12/13/18 and 12/24/18. Apple is a buyback monster, according to CNBC, having reduced share count 28% since 2013, and they just announced another $75 billion program that would reduce shares an additional 8%. This popular but controversial use of cash by so many companies has led many market pundits and CIOs to lament the fact that 30% of EPS growth has come from share buybacks and acquisition – the single largest source of equity demand each year since 2010 (according to Goldman Sachs). In other words, the EPS denominator is reduced while the numerator stays the same. This has led those experts to question the sustainability of the stock market’s rise on the belief that share buybacks have been driving up the market indexes, and so, they say, when the buyback programs dry up, there will be little demand to keep stocks from falling off the cliff.
But here’s the thing, buybacks alone cannot directly boost the S&P 500 index because it is a float-adjusted index. It is calculated by taking the sum of the float-adjusted market capitalizations of all its stocks and dividing it by S&P’s proprietary divisor that adjusts for non-economic factors. If share count goes down while share price goes up commensurately (to keep P/E the same), there is no net impact on the company’s market capitalization, and thus, no net impact on the index value. If there is no growth in total earnings (not EPS), then the index only can go up based on P/E multiple expansion. It is certainly true that reducing the number of shares outstanding (by retiring shares through corporate buyback programs) typically increases the value of each remaining share as price per share rises commensurately with share reduction to keep the P/E and market capitalization (share price x outstanding shares) of the company the same. So, it is great for existing shareholders. But buybacks don’t have a direct impact on business operations or total earnings, any more than a stock split does when it increases the number of shares (and thus reduces EPS).
The only two things that can directly drive up the S&P 500 index value are these: either total earnings rise (while the P/E remains stable), or the P/E multiple expands. Artificially boosting EPS by shrinking the share count for a fixed amount of aggregate earnings has no impact on the index. Admittedly, there can be indirect impacts on supply/demand and investor psychology as corporate demand from buybacks overwhelms the sellers, but without true earnings growth, the index can only increase from P/E expansion.
Buybacks have become a hot political topic due to the fact that the corporate tax cuts were expected to generate big increases in capital spending on growth (expansion, upgrades, onshoring, hiring, training, R&D, etc.), but although there has been a modest uptick in capex, much of the tax savings has been used for share buybacks and dividend increases – both of which benefit the shareholder but not the broader economy and workforce. On the one hand, we all would agree that private companies in a free market economy should be free to deploy their capital as they see fit, but on the other hand, we also may sympathize with the view that if there were no commensurate cuts to spending and entitlements to offset the tax cuts, then the federal budget is dependent upon increased tax receipts derived from capital investment on growth projects rather than on one-time buybacks. But we must always keep in mind that more regulations and constraints on business is not the answer. Creating incentives for companies to invest in real earnings growth rather than in artificial EPS enhancement is a better approach than passing yet another law that restricts and controls their decisions.
One of our analysts from the Gradient Analytics team (a forensic accounting research firm and wholly-owned subsidiary of Sabrient) will be writing a blog post to delve further into the various ways (both proper and sketchy) that companies employ buybacks to enhance their financial statements. So, please watch out for that article over the next couple of weeks.
Continued optimism for stocks:
In closing, as opposed to last summer when the market continued to hit new all-time highs on the backs of defensive sectors and mega-cap Tech names – which at the time I said was unhealthy, and it ultimately culminated in a massive selloff in Q4 – this time around it is rising in a much more healthy manner, with strong breadth and leadership from risk-on market segments, fueled by a combination of solid economic growth, reasonable valuations, a dovish Fed, and optimism of an imminent trade deal. And once such a trade deal with China is consummated, I expect to see companies further ramp up capital spending plans and restate guidance higher (rather than simply buy back shares or acquire other companies), which would support higher stock prices as earnings expectations rise while interest rates hold steady. This would be expected to entice capital out of idle cash and bonds and into stocks from risk-on sectors and small-mid caps.
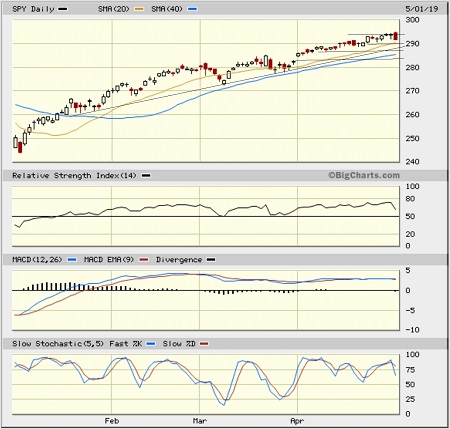
SPY Chart Review:
The SPDR S&P 500 ETF (SPY) closed Wednesday (May 1) at 291.81. Price continued its march steadily higher during April, ultimately setting new all-time highs, but without any volatility to speak of. Oscillators like RSI, MACD, and Slow Stochastic essentially remained in overbought territory throughout the month. This complacency was bound to break eventually, and the bearish engulfing candle that formed on May 1 (after the FOMC announcement) may finally lead to some healthy profit-taking, retrenchment, and testing of support levels, including the 20-day simple moving average, the breakout level of 290, minor support near 287, and the bullish gap up at the beginning of the month from 283. The three oscillators all are pointing bearishly downward, while price remains above all of its key daily moving averages. It is typical (and healthy, from a technical standpoint) after an upside breakout for such price action to occur.
Latest Sector Rankings:
Relative sector rankings are based on our proprietary SectorCast model, which builds a composite profile of each of nearly 500 equity ETFs based on bottom-up aggregate scoring of the constituent stocks. The Outlook Score employs a forward-looking, fundamentals-based multifactor algorithm considering forward valuation, historical and projected earnings growth, the dynamics of Wall Street analysts’ consensus earnings estimates and recent revisions (up or down), quality and sustainability of reported earnings, and various return ratios. It helps us predict relative performance over the next 2-6 months.
In addition, SectorCast computes a Bull Score and Bear Score for each ETF based on recent price behavior of the constituent stocks on particularly strong and weak market days. A high Bull score indicates that stocks within the ETF recently have tended toward relative outperformance when the market is strong, while a high Bear score indicates that stocks within the ETF have tended to hold up relatively well (i.e., safe havens) when the market is weak.
Outlook score is forward-looking while Bull and Bear are backward-looking. As a group, these three scores can be helpful for positioning a portfolio for a given set of anticipated market conditions. Of course, each ETF holds a unique portfolio of stocks and position weights, so the sectors represented will score differently depending upon which set of ETFs is used. We use the iShares that represent the ten major U.S. business sectors: Financial (IYF), Technology (IYW), Industrial (IYJ), Healthcare (IYH), Consumer Goods (IYK), Consumer Services (IYC), Energy (IYE), Basic Materials (IYM), Telecommunications (IYZ), and Utilities (IDU). Whereas the Select Sector SPDRs only contain stocks from the S&P 500 large cap index, I prefer the iShares for their larger universe and broader diversity.
Here are some of my observations on this week’s scores:
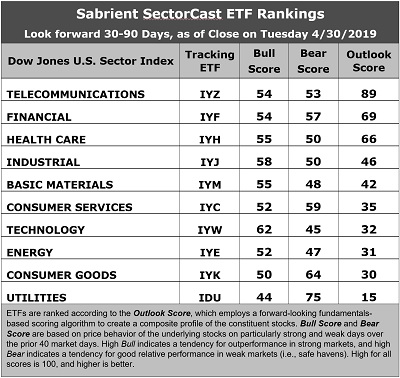
1. Telecom returns to the top spot with a robust Outlook score of 89. It displays the lowest forward P/E of 14.6x, improving sell-side analyst sentiment (net positive revisions to EPS estimates), and solid return ratios. However, its pure GARP metrics are only average, with projected year-over-year EPS growth rate falling to 6.6% and a forward PEG ratio (forward P/E divided by projected EPS growth rate) of 2.21, which ranks it 7th out of 10 sectors on PEG, ahead of only defensive sectors Utilities and Consumer Goods (Staples/Noncyclical), which is why we don’t see many Telecoms as candidates for Sabrient’s GARP portfolios (which have a 12-24 month outlook rather than 2-6 months). Financial moves into second with an Outlook score of 69, as it displays a relatively low forward P/E of 15.3x, good sell-side analyst sentiment, and solid projected year-over-year EPS growth rate of 13.8%, along with a low forward PEG ratio of 1.11. Healthcare takes third with an Outlook score of 66, as its pure GARP metrics have become more attractive as investors have shied away due to election campaign rhetoric (forward P/E of 16.1, projected EPS growth of 10.5%, forward PEG of 1.53). Rounding out the top seven are Industrial, Materials, Consumer Services (Discretionary/Cyclical), and Technology. Tech has fallen in the rankings as its price has been bid up to a forward P/E of 20.4x.
2. At the bottom of the rankings we find defensive sectors Utilities and Consumer Goods (Staples/Noncyclical). Both have seen modest reductions to their earnings estimates from the sell-side analyst community, and their forward P/Es continue to increase even though they have only modest expected EPS growth, so their pure GARP metrics are poor, with the highest forward PEG ratios (3.72 and 2.55, respectively).
3. Looking at the Bull scores, Technology enjoys the top score of 62, followed by Industrial at 58, as stocks within these sectors have displayed relative strength on strong market days. Defensive sector Utilities scores the lowest at 44. The top-bottom spread is 18 points, which reflects low sector correlations on strong market days. It is desirable in a healthy market to see low correlations reflected in a top-bottom spread of at least 20 points, which indicates that investors have clear preferences in the market segments and stocks they want to hold (rather than broad risk-on behavior).
4. Looking at the Bear scores, as usual we find defensive sector Utilities alone in the top spot with a score of 75, followed by Consumer Goods (Staples/Noncyclical) at 64, which means that stocks within these sectors have been the preferred safe havens lately on weak market days. Technology has the lowest score of 45, as investors have fled during recent market weakness (although there hasn’t been much this year). The top-bottom spread is 19 points, which reflects low sector correlations on weak market days. Ideally, certain sectors will hold up relatively well while others are selling off (rather than broad risk-off behavior), so it is desirable in a healthy market to see low correlations reflected in a top-bottom spread of at least 20 points.
5. Telecom displays the best all-around combination of Outlook/Bull/Bear scores, followed by Financial, while Energy is the worst. Looking at just the Bull/Bear combination, Utilities is the best (due to its ultra-high Bear score), followed by Consumer Goods (which shows better balance between its Bull and Bear scores), indicating superior relative performance (on average) in extreme market conditions (whether bullish or bearish), while Energy again scores the worst.
6. This week’s fundamentals-based Outlook rankings reflect a mostly bullish bias, given that seven of the top eight sectors are economically-sensitive or all-weather while defensive sectors sit at the bottom. Keep in mind, the Outlook Rank does not include timing, momentum, or relative strength factors, but rather reflects the consensus fundamental expectations at a given point in time for individual stocks, aggregated by sector.
ETF Trading Ideas:
Our Sector Rotation model, which appropriately weights Outlook, Bull, and Bear scores in accordance with the overall market’s prevailing trend (bullish, neutral, or defensive), still displays a bullish bias and suggests holding Technology (IYW), Telecom (IYZ), and Industrial (IYJ), in that order. (Note: In this model, we consider the bias to be bullish from a rules-based trend-following standpoint when SPY is above both its 50-day and 200-day simple moving averages.)
Besides iShares’ IYW, IYZ, and IYJ, other highly-ranked ETFs in our SectorCast model (which scores nearly 500 US-listed equity ETFs) from the Technology, Telecom, and Industrial sectors include First Trust NASDAQ Technology Dividend Index (TDIV), iShares Global Comm Services (IXP), and John Hancock Multifactor Industrials (JHMI).
If you prefer a neutral bias, the Sector Rotation model suggests holding Telecom, Financial, and Healthcare, in that order. On the other hand, if you are more comfortable with a defensive stance on the market, the model suggests holding Utilities, Telecom, and Financial, in that order.
An assortment of other interesting ETFs that are scoring well in our latest rankings include Davis Select Financial (DFNL), WBI BullBear Yield 2000 (WBIC), SPDR MFS Systematic Value Equity (SYV), iShares NASDAQ Biotechnology (IBB), First Trust Natural Gas (FCG), VanEck Vectors Biotech (BBH), VanEck Vectors BDC Income (BIZD), Oppenheimer S&P Financials Revenue (RWW), SPDR S&P Insurance (KIE), Direxion All Cap Insider Sentiment (KNOW, which tracks a Sabrient index), SPDR S&P Oil & Gas Exploration & Production (XOP), First Trust Rising Dividend Achievers (RDVY), and First Trust Long/Short Equity (FTLS, which licenses Sabrient’s Earnings Quality Rank, which was developed in collaboration with wholly-owned subsidiary Gradient Analytics).
IMPORTANT NOTE: I post this information periodically as a free look inside some of our institutional research and as a source of some trading ideas for your own further investigation. It is not intended to be traded directly as a rules-based strategy in a real money portfolio. I am simply showing what a sector rotation model might suggest if a given portfolio was due for a rebalance, and I do not update the information on a regular schedule or on technical triggers. There are many ways for a client to trade such a strategy, including monthly or quarterly rebalancing, perhaps with interim adjustments to the bullish/neutral/defensive bias when warranted, but not necessarily on the days that I happen to post this article. The enhanced strategy seeks higher returns by employing individual stocks (or stock options) that are also highly ranked, but this introduces greater risks and volatility. I do not track performance of the ideas mentioned here as a managed portfolio.
Disclosure: At the time of this writing, the author holds long options positions on the SPY.
Disclaimer: This newsletter is published solely for informational purposes and is not to be construed as advice or a recommendation to specific individuals. Individuals should take into account their personal financial circumstances in acting on any opinions, commentary, rankings, or stock selections provided by Sabrient Systems or its wholly-owned subsidiary Gradient Analytics. Sabrient makes no representations that the techniques used in its rankings or analysis will result in or guarantee profits in trading. Trading involves risk, including possible loss of principal and other losses, and past performance is no indication of future results.