 by Scott Martindale
President & CEO, Sabrient Systems LLC
Key Points:
1. The country’s 40-year path into a debt & deficit spending spiral was not working and had to change dramatically, not gradually, and the process to fix it is scary and uncomfortable.
2. The president’s “Liberation Day” tariff regime is at once simplistic and perplexing, but the selloff seems overdone, in my view, although the market remains fragile.
3. After an initial price shock, tariffs are deflationary like any tax; and countries are already coming to the table to negotiate them down.
4. The US is much less dependent on trade, less vulnerable to trade disruptions, and in far better position to weather a brief trade war than any other country, including mercantilist China, which is saber-rattling as a Trumpian bargaining tactic and to stoke the flames of political division in our country, in my view.
5. The $10 trillion that left the stock market was not lost like a wildfire burning down homes; it simply rotated into bonds and cash and can quickly rotate back if the outlook does not change and we have fiscal stimulus, supportive Fed, and rising global liquidity.
6. Volatility (up and down) may be sticking around through H1 until clarity improves later in the year.
7. For those still contributing to a 401(k), the selloff has presented a long-awaited opportunity to “buy low.”
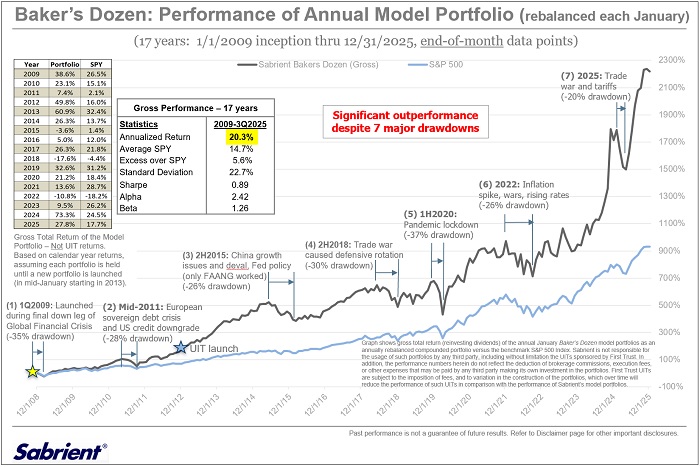
8. Investors may be better served by active stock selection, such as Sabrient’s Baker’s Dozen, Small Cap, and Dividend portfolios.
Overview:
The news has been dominated by President Trump’s announced “Liberation Day” regimen of draconian tariffs, which are intended to induce both fairer trade policies from our trading partners and the onshoring of manufacturing. As his words moved from a 10% across-the-board baseline tariff (a nominal amount that initially sent stocks higher) to the gory details of his broader plan, the swan dive commenced. Negative volume went through the roof. Margin calls rained in. Algorithmic trading systems switched from leveraged long to either leveraged short or out of the market completely (thus removing critical liquidity), tripping stop losses and creating a cascade of selling pressure. The next day’s weekly AAII Sentiment Survey hit an extreme 62% bearish reading and will likely fall lower in this week’s survey. IPOs are being put on hold. The Polymarket odds of an emergency rate cut surged to 285, as did the odds of a rate cut meeting (36% at the May FOMC meeting but a 92% lock by the June meeting).
As of Monday morning’s open, the stock market had essentially given back all last year’s gains. Chartists are lamenting the failure of scary-bearish chart patterns (like the dreaded inverse flag pattern) that could potentially send stock indexes all the way down to their pandemic lows. The CBOE Volatility Index (VIX) surged above 45 on Friday 4/4 and then touched 60 in the pre-hours on Monday 4/7, which is reminiscent of the pandemic lockdown five years ago.
But are things today really as bad as that, when global supply chains were paralyzed and people were falling ill (and/or dying) en masse? I would say no, and in just a couple of blood-red, gap-down days, the rapid market meltdown already seems overdone, as I discuss further in today’s post. As famed value investor Ben Graham once said, “In the short run, the market is a voting machine, but in the long run it is a weighting machine.”
Although the VIX certainly could still go higher (perhaps a lot higher) and stocks lower, Friday looked to me a lot like capitulation and perhaps the start of a bottoming process leading to a great (and long-awaited) buying opportunity for long-term investors. Just be careful about “catching a falling knife.” Many countries (reportedly more than 50) have apparently reached out to fix their trade arrangements, although the biggie, China, is still in saber-rattling mode, at least for now.
Of course, the current selloff also was exacerbated by “priced for perfection” valuations and a complacent “buy every dip” mentality, largely driven by AI exuberance (and its promise of transformation disruption and rapid growth in productivity) and the massive capex allocated for AI infrastructure and datacenters. Furthermore, during the run-up to all-time highs in 2024, hedge funds had become more heavily leveraged long in US equities than at any time since the pandemic lockdown (as much 300% leveraged), essentially pulling forward gains from 2025 based on strong earnings expectations. So, there might be some similarities to the dot-com bubble bursting in 2001 in that respect. But even at its recent high, the overvaluation was nowhere near 1999 levels of the dot-com mania, and we don’t have the systemic credit and accounting issues leading into the 2008 Global Financial Crisis. Company balance sheets are quite sound, and although credit spreads have spiked, they remain low on a historical basis.
Even before the 4/2 tariff announcement, stocks were already looking shaky. It was fascinating to watch the charts of the major indexes like the S&P 500 ETF (SPY) and Nasdaq 100 ETF (QQQ) as they struggled for several days to hold support at the 300-day simply moving average, like a sloth hanging from a tree branch, until ultimately losing grip in dramatic fashion following the big tariff announcement. I opined in my March post that it might be time to create a shopping list of stocks but that volatility would likely continue into the tariff target date (4/2) and perhaps into Tax Day (as liquidity draws down for making tax payments). But few (including me) expected the cataclysmic selloff. Volatility may be sticking around for a while until clarity improves, particularly as Q1 earnings season (and forward guidance) kicks off this week.
To be sure, the reality of the new administration’s aggressive policies to fix many long-festering trade issues has caused much consternation and gnashing of teeth, drawn swift retaliation (particularly from China), disrupted global supply chains, lowered corporate earnings estimates, and raised recession risk (both domestically and globally). In response, just like when the so-called “bond vigilantes” short Treasury notes and bonds (or go to cash) in protest of rising budget deficits and total debt, the “stock vigilantes” went to work shorting stocks (or defensively moving to cash or Treasuries, removing market liquidity and briefly driving the 10-year yield below 4.0%) in protest of the uncertain impacts on the economy and corporate earnings. Or as former Democrat turned Trump supporter Batya Ungar-Sargon sees it, “Suddenly, everybody is sitting around saying, ‘Oh, no, the stock market!’ Yeah, the stock market looks like that because the rich [i.e., Wall Street institutional investors and hedge funds] are punishing Trump for siding with the neglected and humiliated American working class over them.” Indeed, the top 10% of Americans by income own 88% of stocks, the next 40% own 12%, and the bottom 50% are shut out.
So, yes, stock portfolios, IRAs, and 401(k) plans are way down, as the evening news keeps telling us. According to Bespoke Investment Group, the Russell 3000 has seen well over $10 trillion in lost market cap since Inauguration Day (1/20). However—and this is an important point—this is not “capital destruction” in the same sense that a wildfire can destroy homes and businesses. The capital pulled from the stock market didn’t vanish from the earth. It simply rotated into cash and bonds. And it very likely will return to stocks once trade situations are ironed out and visibility improves. It might take several months…or it could come back in a hurry. Be prepared. Perhaps start nibbling at stocks now. If you’re like me, you probably received a slew of low-price alerts for your target list. Some speculative investors might be going all-in at current levels. Regardless, for those still contributing to their IRA or 401(k) and not yet drawing on it, this selloff is a gift to be appreciated, in my view, restoring some value back into the market. After all, when you are in long-term accumulation mode, you want to “buy low.”
Of course, no one knows for sure how low it can go and when the selloff will bottom—and the bottoming process may be lengthy and volatile. The wild card for stocks going forward is uncertainty around the severity and duration of tariffs, which seem designed by their sheer audacity to induce a swift resolution. After all, there is no underlying malady in the economy that prevents business leaders and entrepreneurs from adapting like they always do, and only pride and prejudice can prevent a quick resolution to most of the trade arrangements.
Political, economic, and market volatility will surely continue during H1. But even if we get a larger correction than I expect, I continue to believe stocks will soon find support and ultimately give way to a gradual melt-up, sending the market to back near its highs of Q1 by year-end or early-2026, driven by rising global liquidity, a weaker US dollar, reduced wasteful/reckless government spending and regulatory red tape, lower interest and tax rates, massive corporate capex, and the “animal spirits” of a rejuvenated private sector and housing market. So, if you have been hoping and praying for lower prices in risk assets (including stocks and crypto) or for a lower mortgage rate to buy a house, you are getting them now, with the forward P/E on the S&P 500 at 18.7x as of 4/4 (before any significant downward revisions to earnings estimates), versus 22.7x at its February peak. As the poet Virgil once said (in Latin), “audentes Fortuna iuvat” — i.e., “fortune favors the bold.”
Because this market correction was led by the bull market-leading MAG-7 stocks and all things AI related, investors now have a second chance to get positions in some of those mega-cap titans at more attractive prices. There remains a persistent sense among global investors of “American exceptionalism” based on ouir entrepreneurial culture, a tenacious focus on building shareholder value, and the mesmerizing appeal of our Big Tech companies that offer disruptive innovation, huge cash positions, reliable and consistently strong earnings growth, free cash flow, margins, return ratios, low interest-rate exposure, global scalability, and wide protective moats.
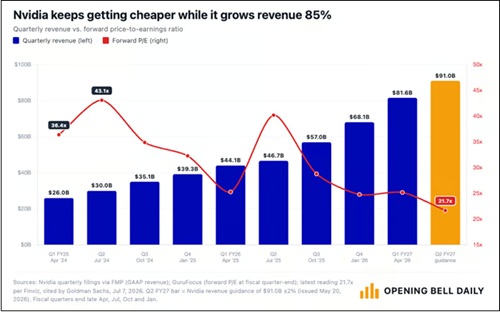
So, the initial recovery may well be led by the Big Tech titans that are now much more fairly valued, such as NVIDIA (NVDA) at a forward P/E of 21x (as of 4/4). Notably, some of these names have seen their valuations retreat such that they are once again scoring well in Sabrient’s growth models (as found in our next-gen Sabrient Scorecards subscription product)—including names like Amazon (AMZN), NVIDIA (NVDA), Salesforce (CRM), Alphabet (GOOGL), Meta Platforms (META), Microsoft (MSFT), Broadcom (AVGO), Oracle (ORCL), Arista Networks (ANET), Fortinet (FTNT), Palo Alto Networks (PANW), Palantir (PLTR), and Taiwan Semiconductor (TSM)—two of which (TSM and AMZN) are in the Q1 2025 Sabrient Baker’s Dozen.
But longer term, rather than the passive cap-weighted indexes dominated by Big Tech, investors may be better served by active stock selection that seeks to identify under-the-radar and undervalued gems primed for explosive growth—many of whom could coattail on the Big Tech names and provide greater returns. This is what Sabrient seeks to do in our various portfolios, all of which provide exposure to Value, Quality, Growth, and Size factors and to both secular and cyclical growth trends.
As for small caps, which as pointed out by Fama French used to outperform large caps over the long haul (higher risk, higher reward), the small cap indexes have been consistently lagging large cap indexes over the past 20 years, mostly due to their much lower allocation to the Technology sector. For example, the S&P 500 has a massive 17.6% relative overweight to the Tech sector (30.3%) versus the Russell 2000 (12.7%). And if you include the Tech-adjacent MAG-7 names that are categorized as Consumer Discretionary (i.e., Amazon and Tesla totaling 5.3%) and Communications (Alphabet and Meta Platforms totaling 6.4%), the S&P 500 allocation to the MAG-7 is 30.5%, and the combined Tech plus Tech-adjacent allocation is a whopping 42.0%—or a 28.9% relative overweight versus the Russell 2000!
Some might say that small caps are due for a mean reversion versus the S&P 500, but it seems its relative overweight to cyclical sectors like Industrials, Financials, Real Estate, Materials, and Energy (with only noncyclical/secular growth Healthcare having an overweight of 5.9%) rather than to secular growth Technology would make any attempt at mean reversion temporary. Nevertheless, I still think the small cap universe is where to find the most explosive growth opportunities (with the notable exception of large cap names like NVDA), even if the broad passive indexes (like Russell 2000) can't keep up. So, insightful active selection is important for small cap investing—which is easier to do given the relative lack of analyst coverage and institutional ownership of small caps.
We at Sabrient have become best known for our “Baker’s Dozen” portfolio of 13 diverse growth-at-a-reasonable-price (GARP) stocks, which is packaged and distributed quarterly to the financial advisor community as a unit investment trust through First Trust Portfolios, along with three other offshoot strategies based on Value, Dividend, and Small Cap investing. By the way, our Q1 2025 Baker’s Dozen remains in primary market until 4/16, after which time the Q2 portfolio launches. Also, our Small Cap Growth 45 portfolio remains in primary market until 4/21, followed by the launch of Small Cap Growth 46, and Dividend 51 is in primary market paying a 4.25% yield on new purchases.
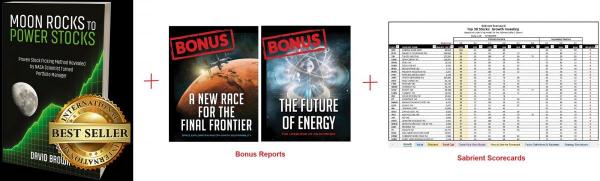
As a reminder, Sabrient founder David Brown’s new book, How to Build High Performance Stock Portfolios, is available in both paperback and eBook versions on Amazon. And as a companion product to the book, we have launched next-gen versions of Sabrient Scorecards for Stocks and ETFs. You can learn more about the scorecards book and, download a sample scorecard, and sign-up for a free trial subscription—by visiting: http://DavidBrownInvestingBook.com/
In today's post, I examine in detail the new tariff regimen, the case for reducing (but not eliminating) the trade deficit, the liquidity challenge and “debt maturity wall,” and the case for tariffs and trade realignment. You won’t regret reading it through! I also discuss Sabrient’s latest fundamental-based SectorCast quantitative rankings of the ten U.S. business sectors, current positioning of our sector rotation model, and several top-ranked ETF ideas. Here is a link to this post in printable PDF format. Read on….