Sector Detector: Stocks regain their footing after trade negotiations stumble
 by Scott Martindale
President, Sabrient Systems LLC
In my prior commentary in early May, I wrote that investors were aggressively bidding up stocks and appeared to have “stopped looking over their shoulders with fear and anxiety and are instead focused on the opportunities ahead.” The S&P 500 was retrenching after a breakout to new highs in preparation for a major upside move driven by a risk-on rotation – which I expected would bode quite well for Sabrient’s Baker’s Dozen portfolios that have been predominantly composed of stocks from growth-oriented cyclical sectors and small-mid caps. After all, recession fears had subsided, US and Chinese economic data were improving, Q1 corporate profits were coming in better than expected, the Fed had professed that it had our backs, and of course, a resolution to the US/China trade impasse was imminent. Or so it seemed. Instead, the month of May gave stocks a wild ride.
It was exactly one year ago that President Trump escalated the trade war with China from simple threats of tariffs to actual numbers and dates, which ignited a risk-off rotation and a starkly bifurcated market, as the S&P 500 large-cap index continued to rise on the backs of defensive sectors and mega-caps while risk-on cyclical sectors and small-mid caps sold off. The big oversold risk-on recovery following Christmas Eve began to peter out in late-April as the S&P 500 challenged its all-time high, but then the breakdown in negotiations in last month created another risk-off market reaction reminiscent of last summer. In other words, stocks and investor sentiment have been jerked around by Trump’s tweetstorms.
I talk a lot more about China and the trade war in today’s commentary, but the upshot is that this problem has been festering for a long time, and to his credit, President Trump decided he wasn’t going to continue the practice of kicking the can down the road to a future administration. China clearly (and dangerously) is intent on challenging the US for global dominance – economically, technologically, and militarily – with its powerful brand of state-sponsored capitalism. I support the cause against China’s unfair practices, given the enormous importance for our nation’s future – even though the resulting lengthy period of risk-off sentiment (essentially 9 of the past 12 months) has been challenging for Sabrient’s growth-and-valuation-driven portfolios (which are dominated by the neglected cyclical sectors and smaller caps), as the negative news stream creates a disconnect between analyst consensus earnings estimates and investor preferences. Fund flows instead suggest strong demand for low-volatility and momentum strategies as well as fixed income (tilted to shorter maturities and higher credit quality), and the 10-year TIPS breakeven inflation rate has fallen to 1.73% (as worries of deflation have set in).
In response to the recession fears and rampant defensive sentiment, the FOMC felt compelled last week to issue a highly accommodative statement that essentially said, we got your back, which turned around the fading stock market. Fed chairman Jay Powell asserted that the trade war is on the list of the committee’s concerns and that the central bank would “act as appropriate to sustain the expansion,” i.e., cut interest rates if necessary. This explicitly reestablished the proverbial “Fed put” as a market backstop, and investors liked it. We already are seeing a somewhat weaker dollar, which could be a further boost to US equities (especially those that sell internationally).
My view is that the May pullback was another buy-the-dip opportunity, particularly in risk-on market segments, as the pervasive worries about imminent global recession and a bear market caused by escalating trade wars have little basis in reality. The latest defensive rotation, including shunning of cyclical sectors, relative weakness in small caps, and global capital flight into Treasuries causing plunging yields (and a 3-mo/10-yr yield curve inversion), has been driven by uncertainty rather than hard data. Every piece of worsening economic data can be offset with encouraging data, in my view. Yes, the economic expansion (consecutive positive GDP prints) has been going on for a longer-than-average period of time, but there is no time limit on expansions, i.e., they don’t die of old age but rather from excesses and inflation that must be reined in (but there is nary of whiff of inflation anywhere in the developed world). I still expect that a resolution to the trade war will send stocks in general, and risk-on market segments in particular, into orbit … but until then, it is hard to predict when investor sentiment will again align with the still-solid fundamentals.
In this periodic update, I provide a market commentary, offer my technical analysis of the S&P 500, review Sabrient’s latest fundamentals based SectorCast rankings of the ten US business sectors, and serve up some actionable ETF trading ideas. In summary, our sector rankings have turned neutral, while the sector rotation model retains its bullish posture. Read on…
Market Commentary:
I just returned last week from my first “real” vacation in quite some time (you know, one in which you bring your phone but not your laptop, and only check email sporadically). My wife and I met up with my two adult daughters in Cancun, Mexico for several days of fun, sun, food, libations, and relaxation. Refreshed and rejuvenated, it’s good to be back home and plugged back into the markets. And after a brief worry that Trump’s “shot across the bow” at Mexico might tank stocks into testing their Christmas Eve lows, the market is suddenly surging once again – with some encouragement from the Federal Reserve. Nevertheless, there remains understandable concern that this might be simply a “dead cat bounce” given the intractable trade war with China casting a pall over what otherwise should be a very bullish environment.
Sabrient’s quantitative model has continued to reflect an optimistic outlook among the analyst community regarding earnings growth in cyclical sectors and small caps (through 2020), but that could change if expectations of a nasty, prolonged trade war set in. Even though the US is much better positioned than China to weather the storm, investors are prone to follow the crowd, which has again driven down forward valuations (e.g., P/E and PEG ratios) in those risk-on segments. And while the large-cap S&P 500 recently hit a new high on May 1 (and after a big May selloff have recovered this month to within 2.3% of that high), small caps have not come close to last August’s record levels (despite a strong start to the year), and so the Russell 2000 (IWM) remains about 12.8% below its all-time high.
After a promising start to the year when investors snapped up bargains in cyclical sectors and small-mid caps, the biggest laggards recently have been those risk-on market segments like steel, semiconductors, transports, materials, and energy, as a trade deal became less of a sure thing, and small caps couldn’t even keep up during last week’s big rally! The risk-off rotation has driven capital into the relative safety of US Treasuries, defensive sectors, and reliable dividend payers like Utilities and REITs, leading to sky-high valuations in low-growth risk-off market segments and head-scratchingly low valuations in those risk-on segments.
Let’s go in-depth on the China situation:
Last year (especially in my September commentary), I talked a lot about China as the biggest risk to the global economy – given its opacity, Communist Party authoritarianism, precarious debt situation (including unofficial off-balance sheet “shadow banking” estimated to be as high as $10 trillion), its growth-at-any-cost approach, and its unfair trade practices like state-sponsorship and tariffs to ensure competitive pricing, restricting of capital flows, inhospitable view of foreign investment, and the appropriation of new technologies by any means necessary – so much so that I wondered aloud whether I was obsessing too much on the country. The US supported its entrance into the WTO nearly 18 years ago, largely to gain access to its growing consumer market, and in return China has been flouting its commitments ever since, which is finally being confronted. Nevertheless, I was optimistic that logic would prevail and that the trade war would not escalate, and that unwinding of the China debt bubble was more of a long-term problem. But the way things have developed, it appears my worst fears were justified. Despite an early facade of good intentions, President Xi and his minions have suddenly betrayed the fact that they will vigorously resist any further push toward Western-style capitalism – with the attendant intellectual property protections, free markets, and open flow of global capital – which would serve up too many risks to the iron-fisted state control of their economy.
Just when all the ducks seemed to be lining up and the Trump Administration was professing that negotiations were 90% done, Friday May 10 brought a letter from China filled with edits and retractions to the draft deal as it stood, essentially reneging on months of hard-fought negotiated terms (“Nothing is agreed until everything is agreed,” China's vice commerce minister Wang Shouwen said later). And so, President Trump in his swashbuckling style pulled up his Twitter account and immediately reinstated the additional 25% tariffs that had been postponed to demonstrate good faith in the progress of negotiations, and on the following Monday May 13, the S&P 500 fell -2.4% for its worst single-day loss since January 3. Trump’s actions included an executive order declaring a national emergency targeting companies “increasingly creating and exploiting vulnerabilities in information and communications technology and services,” and a major target is Chinese juggernaut Huawei, with the US government and Google taking steps to block its path to 5G dominance. (The WSJ recently published an in-depth article on Huawei’s dubious practices that have propelled its amazing growth.)
The negative reaction in stocks laid a particularly big hit on the Technology sector (especially semiconductors) and the Nasdaq Composite, and sent Treasury yields plummeting. As if the trade war with China wasn’t enough, investors are concerned about Mexico, Venezuela, Iran, and North Korea – plus the heightened turmoil around the latest European elections and Brexit (including yet another British Prime Minister stepping down), which far exceeds the level of political acrimony we have here in the US.
It is entirely possible that China’s team intentionally misled our negotiators in something of a bait-and-switch or good-cop/bad-cop routine. My view is that this is how China intends to negotiate with its back against the wall – using feigned outrage, hostility, and threats (via their puppet press). Moreover, President Xi is trying to pump up the populace to support his cause by couching the trade war as a modern version of their “Long March” (re: its civil war in the 1930s). And although he is trying to portray this as a battle that China is better prepared to fight over a long timeframe than the US (given our “short-termism” and upcoming 2020 election), my view is that the clock is ticking on China’s financial house of cards, and we are in a much better position to wait it out – thanks to a combination of tax cuts and the “Fed put.”
My regular readers know that I have been borderline obsessed with China, not the least of which is its stated goals toward global dominance. To that end, it has implemented massive programs like the $8 trillion Belt & Road Initiative (BRI), which is an international infrastructure development program that puts developing nations in its debt and control (aka “debt-trap diplomacy”), and Made in China 2025, which aims to overtake the West in high-tech and advanced manufacturing preeminence.
But there is little doubt that the trade war is taking its toll on China, as GDP, consumption, and manufacturing activity have slowed. US companies are increasingly incented to take manufacturing elsewhere, like Vietnam, Malaysia, Bangladesh, Taiwan, South Korea, Cambodia, and even Japan. But beyond the trade war, the country was already running into some treacherous challenges, including a secular decline in its current account surplus that made funding of the massive BRI projects more difficult such that it must take on more debt (or print money) to fund them. Moreover, many of these BRI projects likely will not generate a return as the developing countries taking on large risky loans ultimately won’t be able to make payments. Thus, the BRI could well be unsustainable without injections of foreign capital (primarily from the West) to shore up China’s capital account. Many of the countries hosting these massive projects are rethinking their commitments as they face criticism (both internal and external) about the overwhelming debt they are taking on, not to mention being the prey for China’s predatory “economic colonialism.”
From a broader perspective, the so-called China Miracle has been characterized by unrelenting growth, largely driven by monetary stimulus in the form of new loans, mandated lending quotas, rampant off-balance sheet “shadow banking,” cuts to the reserve ratio for banks, and when deemed absolutely necessary, devaluation of the currency (including a single -34% move in 1993). Over the past 20 years, the total value of credit in the Chinese financial system has increased more than 40x, such that today estimates are that China’s debt-to-GDP ratio may be approaching 400% (including shadow banking), although it’s hard to measure given the opacity of the data. Estimates suggest that perhaps 25% of the debt is tied to real estate, 25% of the country’s GDP is from construction, and 80% of the country’s wealth is tied up in domestic property while the vacancy rate for investment properties could be as high as 20%. As a result, the fallout from a prolonged and debilitating trade war could be disastrous. Zero Hedge reported last week on PBOC efforts to handle the aftermath of the failure of one major Chinese bank (Baoshang Bank), with an even larger one (Bank of Jinzhou) apparently on the verge (its auditors have already resigned).
China’s renminbi (RMB) weakened most of last year against the USD as a result of the tariffs, helping to offset their impact. Then, after December 1 it began to strengthen through April as the trade negotiations seemed so promising. But when the negotiations broke down in May, the RMB quickly fell about 2.8% against the USD to a 6-month low, and as of Friday, it remains at about 6.91 to the dollar – once again approaching strong long-term resistance at 7.0 – a level it hasn’t broached since May 2008.
For the moment, China is trying to fight back against the US mostly with its own tariff hikes, as well as by encouraging its consumers not to buy US-made products. In addition, it has taken to leveling massive fines against US companies that do business in China for dubious “anti-trust violations.” According to Bloomberg, Ford (F) and FedEx (FDX) already have been investigated and/or fined, and others on the list of potentially “unreliable entities” include Alphabet (GOOGL), Qualcomm (QCOM), and Intel (INTC).
But it has not yet resorted to a “last resort” tactic like currency devaluation like it did back in 2015, mainly because it would undermine its deleveraging efforts, drive unlawful capital flight, ignite inflation, reduce domestic consumers’ purchasing power, and perhaps reverse the burgeoning interest of foreign investors in China’s capital markets (which it desperately needs to offset its falling current account surplus, as rising wages have driven production elsewhere and rising consumption has led to rising imports). But burning through its foreign reserves to support the RMB is not a good choice, either.
Another “last resort” retaliatory tactic that pundits have been floating around (and which I wrote about last fall) is the withholding from the marketplace of rare earth metals, which are critical ingredients in virtually all high-tech consumer and military electronics, and of which China is the world’s primary producer (with about 80% of the market, even though it holds only about 1/3 of the world’s reserves). In fact, in 1992 Deng Xiaoping made it a top priority to corner the market, famously stating, “The Middle East has oil, we have rare earths,” and indeed they did just that by becoming the low-cost producer (albeit at great environmental cost). President Xi recently visited a rare earth mining site in an unspoken threat that such a move is now on the table. But the reality is that although rare earth mining is an arduous process, the metals are indeed available in other parts of the world (including here in the Western US), and although it would be much more expensive, we could develop alternative supply chains for the critical metals in relatively short order, if need be.
Some commentators have opined that a more logical retaliatory tactic would be the dumping of its massive holdings (about $1.1 trillion) of US Treasuries, with the idea of destabilizing our economy by rapidly driving up longer-term interest rates as supply floods the market, driving down bond prices as other investors dump their holdings in the name of capital preservation. However, there are $22 trillion in US Treasuries, and the recent surge in bond prices (and commensurate drop in yields) here in the US as global investors seek the safety of the US whenever there is global economic uncertainty indicates to me that there is plenty of global demand for Treasuries to absorb any extra supply from China – and don’t forget that the Fed can choose to swoop in with a strong bid to support prices if necessary, as well. So, this tactic likely wouldn’t work well, and in fact, China knows it must hold ultra-safe asset like US Treasuries to maintain stable foreign reserves.
So, China faces a difficult Catch-22. On the one hand, with its economy weakening materially, forcing it to reinstitute stimulus (and debt, which was already sky-high), it can ill-afford to absorb the pain of fighting this trade war much longer, no matter what the bluster from their official press seems to suggest. But on the other hand, giving up its long-standing unfair advantages may be nearly as destructive, given its reliance on forced (contractual) technology transfer, cyber espionage, physical theft, counterfeiting, piracy, and the blatant disregard of IP rights (not to mention massive state subsidies) to power its incredible growth (e.g., Huawei). A White House whitepaper last year put estimates of the cost to the US from IP theft alone at as much as $540 billion per year.
Ultimately, the writing is on the wall for China. It will soon run a current account deficit that will further weaken its currency without offsetting inflows of investment capital. But becoming a more open economy will challenge a culture that largely has not been hospitable to outside investors. Although cultural changes come about slowly, markets aren’t waiting around, as Chinese assets are taking up a larger proportion of global indices and portfolios. So, I think China’s best approach is to find a way to work around their cultural need for “saving face” and “dignity” in this bilateral trade deal, acknowledge that the country no longer needs the crutch of unbalanced trade rules (and onerous laws impacting foreign companies that want to access the Chinese consumer), and collaborate with the US to fix these issues – moving the ball toward “fairer” trade for the near term and ultimately truly fair trade in the long term. The country has already instituted some reforms aiming to increase foreign investment. The IMF has cut its forecasts for China growth and stated that the country should “work constructively to address shortcomings in the trading system,” including allowing market forces to play a greater role in its economy and to provide greater access to foreign investors.
Although this might seem like a logical outcome for any rational-thinking adult who looks at the trade rules today, this is no slam-dunk. You need not look further than the political situation here in the US to see that intelligent and educated adults can be far from rational thinking for long periods of time. Egos are easily bruised and political posturing and pandering to a political base trumps any rational thought or compromise, even if such compromise is in the best interests of the country. Much like the old saw, “The stock market can stay irrational longer than you can stay solvent,” politicians can stay irrational for a long time. China has been unwilling to give up its obviously lopsided advantages and acquiesce to US demands that it change its laws and practices regarding international trade, given that it is so much more expedient to appropriate the technology needed to drive growth than to go through the arduous and expensive process of R&D. Ultimately, I think a new trade deal likely will provide for a gradual phase-out of technology transfer. But as I opined last fall, there will be little room to compromise on recognizing and defending intellectual property rights as well as cracking down on state-sponsored hacking and technology theft – although enforcement on these topics will be difficult.
Trump has surprised many by holding firm on many of these issues rather than fearing the impact on his reelection prospects from a hit to the economy and stock market. But he seems to understand that, from a long-term strategic perspective, there is much more at stake in his negotiations with China than with Mexico, Canada, South Korea, Japan, or the EU. Those other countries are our staunch allies, whereas China clearly is not. I don’t think China’s intelligence agencies are going to suddenly back off and play nice, no matter what trade agreement comes about. They likely will continue to seek ways to spy, such as building “backdoors” into tech devices, and devise schemes to gain military and strategic advantages.
Moreover, the Communist Party of China (CPC) is clearly determined to solidify and spread its control and dominance through mass surveillance (via internet, cameras, social credit scores, reeducation camps), and the like – not just domestically but globally, as well. Most recently, it seems intent on gradually eroding civil liberties and asserting tighter control over Hong Kong, which has led to mass protests in the streets there. So, there is plenty of good reason to be suspicious of Chinese technologies being adopted worldwide.
As a result, I’m not one to criticize the President for throwing down the gauntlet with China (even though the trade war has distorted investor preferences and hurt our Baker’s Dozen portfolios). To be sure, numerous commentators have proposed alternative approaches to tariffs, which hurt US consumers and exporters nearly as much as they hurt China (such as Mark Cuban’s suggestion that China be shut out of the US IPO market until a trade deal is inked, or even halt trading of all Chinese stocks listed on US exchanges – and something like this is working its way through Congress). But the fact of the matter is that China has enjoyed exponential growth largely thanks to ready access to advanced technologies from the US and other Western nations (through contractually forced technology transfer, piracy, and ignoring of intellectual property protections), including military applications. As a reminder, China has long banned Google, Facebook, Amazon, eBay, and Twitter in order to protect their home-ground versions. And when I see a new IPO like Beyond Meat (BYND), which projects tremendous growth potential for its plant-based protein burgers in Asia through local partnerships, I can only assume that China would require sharing of technology with the local partner, copy the secret sauce, and ultimately launch competitor companies to squeeze out BYND.
For too long these practices have been ignored by our federal leaders, and now we see China leveraging these same technologies to challenge us for global dominance (economic, technological, and military). So, this trade war indeed needed to be fought sooner rather than later. As Eric Peters of One River Asset Management recently wrote, the US long ago chose to become the world’s “buyer of last resort” and encouraged other countries (especially China) to expand export capacity while we neglected our own manufacturing sector. But then, he said, “…in 2016, Americans voted to reengineer our relationship with the world. And this marked the dawn of a new Cold War.”
To me, the voters purposefully elected a populist and hardnosed outsider (a cutthroat businessman, at that, who rubs many the wrong way). Voters effectively demanded that our government stop the partisan bickering and gridlock, end the long-standing lopsided trade advantages that have essentially become an entitlement to our trade partners, and put the focus back on America. But instead, the political divisiveness at home – while arguably not as bad as what we see today in governments across Europe (e.g., UK, France, Germany) – has worsened rather than improved, greatly hurting our negotiating position and prolonging the trade war. I believe the uncooperative approach of the Democratic side of Congress has played into China’s hands, given their singular obsession with overturning the 2016 election (through special prosecutor, congressional hearings, subpoenaing tax returns, impeachment, or any other means possible) and resisting all things Trump seeks to accomplish while China has continued to build up its strategic and military capabilities at our expense.
I admit that Trump has done himself no favors with his incessant bravado and continual pandering to his base through combative tweets and campaign-style rallies rather than reaching out to the broader electorate of independent-minded voters, but this is the person voters elected, and I can’t help but be amazed that there are otherwise lucid and educated people in the press and in elected leadership who want to bring down this president at any cost. It seems they would prefer to see an escalation in the trade war, a global recession, an unrelenting immigration crisis, crumbling infrastructure, worsening addiction and homelessness, a wasteful and divisive impeachment process, and a bear market in stocks, rather than give Trump any victories, no matter the impact on the American citizenry and our nation’s economic health, national security, and global technological dominance. Instead, much like our unified efforts to winning WWII or putting men on the moon, we would be so much better off right now as a country if we could pull together and put up a united front on trade to China and the rest of the world, fix the immigration laws, and implement a desperately needed infrastructure repair plan.
Back to the economy, interest rates, and earnings:
As a result of May’s re-escalation in the trade war and all the negativity from so many pundits, investor sentiment turned decidedly defensive, as steel, semiconductors, transports, materials, energy, and other highly cyclical market segments were shunned, while the odds of a Fed rate cut surged. I thought domestic steel companies were supposed to benefit from the tariffs on imported steel, but instead, those stocks have sunk nearly to the December lows and at ultra-low forward P/E ratios – witness the SLX steel ETF, down about -20% since the beginning of 2018 (and at an 8.6x forward P/E today, versus 14.2x at the start of 2018 in anticipation of surging corporate capex and infrastructure spending) despite solid financial results and little change in forward estimates, versus the S&P 500, which is up +10% over the same timeframe. According to BMO’s Brian Belski, analysts cut price targets for the 25 S&P 500 companies with the largest revenue exposure to China by just 0.5%, but their share prices fell nearly 10% in a mad rush to the exits.
According to S&P Global, correlations rose and dispersion fell across most sectors, especially in large-cap Information Technology, Communication Services, and Energy, and all industries posted losses in May. Real Estate was the top performing large cap sector during the month and the only one showing positive performance, while Oil & Gas Equipment was the worst performing industry (down -23%!).
But last week’s strong bounce to kick off June was quite impressive, posting the best week (+4.5%) since November (led by the highly cyclical Materials sector, +9%), and providing a very powerful technical signal (as discussed below). And for all the negativity around trade negotiations, the S&P 500 today trades at a forward multiple of about 16.4x (which is slightly above historical averages) and with only moderate volatility (VIX of 16.3). Investors have shown a willingness to stick with equities (albeit with a defensive tilt), as the S&P 500 has surged back above its 50-day moving average and very near its all-time high. Moreover, economic reports showed better than expected housing starts, employment metrics (3.6% unemployment and jobless claims at 50-year lows), and consumer sentiment (a 15-year high!), while the Fed remains dovish. In fact, the fed funds futures are indicating that at least one rate cut is a virtual certainty as this uncertainty persists, and as you know, lower interest rates justify higher P/E multiples.
Nevertheless, it seems to me that equity investors have been fearful of both the consequences of a prolonged trade war as well as missing a rally (aka FOMO) on a sudden trade deal, as there has been a strong preference for large and mega caps (except those with the heaviest international revenue exposure), defensive sectors, and reliable dividend payers/growers, over small-mid caps and cyclical sectors – much like the summer of 2018, right after the trade war had escalated from tariff threats to actual numbers and dates. As an example, Utilities (e.g., the XLU) and REITs (e.g., the XLRE) are at all-time highs, having been bought up for their stable and stout dividend yields in a low interest rate environment.
Although many market commentators have insisted that it is multinational large cap that are most vulnerable to trade wars and a strengthening dollar, which should in theory benefit small caps, in fact it is small caps that continue to lag so far this year and remain well below their all-time highs from last August, even though the large cap indexes recently achieved new highs. DataTrek surmises that it has been rising high-yield credit spreads that has been holding back small caps. During the risk-on rotation of Q1, global capital seeking safe yield poured into US Treasuries and yields fell while credit spreads tightened, and the riskier high-yield and emerging markets performed well. In addition, the concurrent surge in oil price was also helpful as there are many small, highly levered energy companies. However, more recently, oil has fallen nearly 20% from its April peak, and high yield spreads have widened as recession fears abound.
FactSet reported that as of 5/31/19, 98% of S&P 500 companies had announced 1Q2019 earnings, with 76% of them beating estimates (versus a 5-year average of 72%). The firm also reported that investors are rewarding positive earnings surprises less than average and punishing negative earnings surprises more than average. As of the end of May (before last week’s surge), the S&P 500 traded at a P/E ratio of 15.9 times forward 12-month EPS estimates, with Consumer Discretionary (20.2x), Real Estate (19.0x), Consumer Staples (18.7x), and Utilities (18.2x) on the higher end, and Financials (11.3x), Health Care (14.7x), and Energy (14.8x) on the lower end. In the middle are Tech (17.9x), Communication Services (17.4x), Materials (15.3x), and Industrials (15.1x). As I said earlier, cautious investors have been pricing up low-growth defensive sectors and passing up high-growth cyclicals and small caps.
Furthermore, regarding analyst estimates for 2Q2019, FactSet observed that S&P 500 companies that generate less than 50% of sales outside the US (i.e., less global exposure) have an estimated earnings growth rate of +1.4%, but companies that generate more than 50% of sales outside the US (more global exposure) have an estimated earnings decline of -9.3%. Shifting to the top line, the aggregate estimated revenue growth rate for the S&P 500 for 2Q2019 is +4.0%, but companies that generate less than 50% of sales outside the US (less global exposure) show an estimated revenue growth rate of +6.0% while companies that generate more than 50% of sales outside the US are expected to show a revenue decline of -1.2%. The Information Technology sector is expected to be the largest contributor to the earnings decline since it has both the highest weighting in the index and the highest international revenue exposure of all eleven sectors in the index.
As for US GDP, the BEA’s second estimate of Q1 growth (as of 5/30/19) is +3.1%. Looking ahead to 2Q2019, the Atlanta Fed’s GDPNow model issued an updated estimate (as of June 7) of 1.4% GDP growth while the NY Fed’s NowCast has fallen to 1.0 for Q2 and 1.3% for Q3. But the St. Louis Fed’s NowCast sees 2.9%. So, there is some dispersion there. And the IMF just updated its projection for full-year 2019 US GDP growth to 2.6%, which is up from 2.3% forecasted in April.
Regarding interest rates, as I said earlier, even if China retaliates by continuing to dump its massive holding of US Treasuries on the market, there seems to be plenty of global demand to absorb that supply – especially if the 10-year approaches the 3% level again – and the Fed would likely step in to absorb more if necessary. The 10-year US T-note closed Friday at 2.08% (down 42 bps since my last article in early May!), the 2-year at 1.85%, and the 3-month T-bill at 2.28%. Although the 3-month/10-year spread is inverted by -20 bps, the 2-10 spread remains at 23 bps. Despite its big fall, the US 10-year yield continues to look quite good compared with other developed market 10-year yields (some of which have fallen off a cliff), like Australia at 1.45%, Canada at 1.46%, UK at 0.81%, France at 0.084%, Germany at -0.25%, and Japan at -0.13%. So, beyond a global flight to safety from the trade wars and turmoil in Europe, also helping to keep US yields so low is the massive $10 trillion of global debt that pays negative yields.
CME Group fed funds futures have been volatile in the wake of the trade war escalation. They now place zero probability of another rate hike by the December meeting and instead indicate a 98.5% probability of at least one 25-bp rate cut by then, an 86% chance of two rate cuts, and a 54% chance of three rate cuts. Just a remarkable turn of events.
However, despite all the consternation and gnashing of teeth about an inverted yield curve, I continue to believe that the inversion in the 3-month/10-year yield spread is a false signal. Because the 3-month is controlled mostly by where the Fed sets the fed funds rate while the 2-year and longer are market-driven, so I am more inclined to watch the 2-year/10-year spread. With so much market intervention by central banks’ QE keeping longer rates low, and with virtually no inflation anywhere in the developed world, the Fed raising on the short end while market forces keep the longer end low is misleading, in my view.
The TED spread (3-month Treasury yield versus 3-month LIBOR) is relatively narrow at 0.20, which indicates calm debt markets (above 0.5 indicates fear in the global financial system, especially emerging markets). So, this indicates a calm debt market. On the other hand, the trade-weighted dollar sat at 10-year highs at the end of May, and a strong dollar makes it more difficult for emerging markets to repay dollar-denominated debt. Nevertheless, the increasingly dovish tone from the Fed suggests lower interest rates and a weaker dollar ahead, which should support emerging markets and risk assets (including US equities).
However, the downside to ultra-low rates is that a low cost of capital creates a low hurdle rate for investments, which can lead to a misallocation of capital. As Stanley Druckenmiller said, "It’s very clear to me that you need a [meaningful] hurdle rate for investment and that if you don’t have a hurdle rate for investment, bad things happen.”
Also concerning is quarterly capex, which peaked in mid-2018 and has slid quite a bit since then, prompting some observers to call this a further sign of a late-cycle economy nearing its end. However, keep in mind, services-oriented industries (which predominate our economy), tend to require lower capex while offering more stable revenue streams and higher margins (profitability). But in any case, my view is that corporate chieftains across the board have been holding back on spending plans while awaiting a trade deal, which would entice them to ramp up spending plans and boost forward guidance on revenues and earnings, reigniting the economy and stocks.
In addition, we have structurally low interest rates that many economists are seeing as “permanent,” a Fed that is firmly sitting on the backburner, and plenty of idle cash still on the sidelines that can help fuel a renewed rally. In fact, UBS put out data on the holdings of its high net worth portfolios globally showing that there is 32% of investment capital sitting in cash, and 23% among US investors. Moreover, even though pundits are worrying about US corporate debt at record highs, profitability and cash flow are also at record highs, and Goldman Sachs has observed that companies are spending a smaller proportion of cash flow on interest than they were a decade ago, while debt-to-asset ratios and net debt (debt minus cash on hand) relative to GDP are modest. Thus, GS opined that US companies are in an “unusually healthy position this deep into a business cycle expansion.”
All of this seems to support my often-stated view that we are not so late in the cycle as so many pundits seem to assume. As JP Morgan’s Jamie Dimon said after his stellar Q1 earnings report, “If you look at the American economy, the consumer is in good shape, balance sheets are in good shape, people are going back into the workforce, companies have plenty of capital…It could go on for years.” Fed chair Jay Powell seems to feel the same way.
I still believe that once a trade deal is finally achieved, stocks will rocket higher. But in the interim, I think the US can weather the storm pretty well, and fear will subside and bond yields will firm up as risk capital rotates from bonds to equities in an improving growth environment, stabilizing an advancing dollar, while reducing the odds of a Fed rate cut in 2019. A healthy economy helps corporate earnings, while a dovish Fed keeps rates low and supports equity valuations. Rather than an impending recession, we may be returning to the type of growth and inflation we enjoyed just prior to the tax reform bill, which would provide a predictable environment for corporate planning and steady (but not exuberant or inflationary) corporate earnings growth. Thus, I believe investors are poised for a major risk-on rotation into equities – led by small-mid caps and cyclical sectors – once the fog has lifted and longer-term visibility has returned.
With earnings growth expectations still positive, interest rates low and the Fed possibly prepared to cut rates, even a small amount of earnings growth can support solid equity market gains, so a forward P/E multiple for the S&P 500 of 17x is not unreasonable – as it suggests an “earnings yield” of 5.8%, which towers above the 10-year Treasury yield of 2.08%. So, with a current bottom-up EPS estimate for CY2020 of $186.78 (according to FactSet as of May 31) and a 17x multiple, the S&P 500 could hit 3175 by year end. But even a forward P/E of 16x (slightly below where it sits right now) would put the index close to 3000. Looking at it another way, when FactSet did a bottom-up aggregation of all the analyst consensus price targets, the target price year-end price for the S&P 500 is even higher, at 3215.
SPY Chart Review:
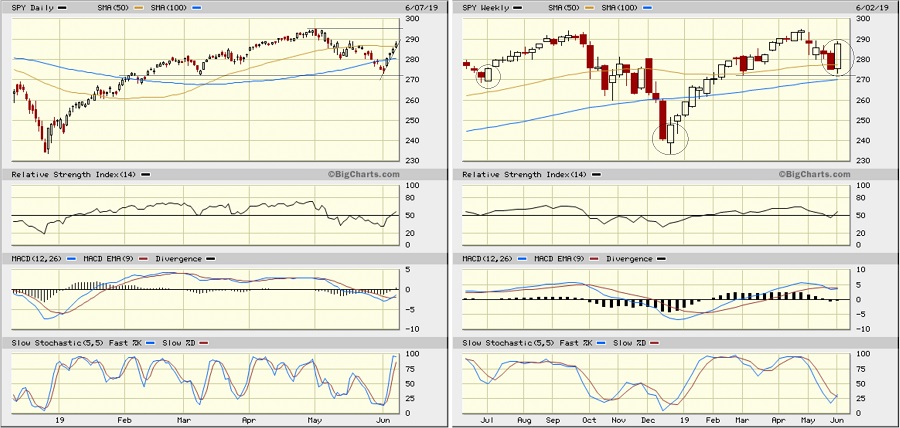
At the close of May, the technical picture for the SPDR S&P 500 ETF (SPY) was looking pretty bleak, having fallen from a new all-time high to below the 200-day simple moving average (SMA). But it was also deeply oversold and testing a strong support level near 272. In response, SPY bounced quite strongly last week (the best week since November), closing Friday June 7 at 287.65. Oscillators RSI and Slow Stochastic cycled down through oversold territory and back up, and now may be setting up for some consolidation and perhaps backfilling some of those price gaps, while MACD still looks like it could move higher. But make no mistake, the short-term technical picture on the daily chart is strong. The second chart shows the weekly picture, and it looks even stronger, as last week closed with a bullish engulfing candlestick. I have circled two other times over the past year in which a solidly green candle (either bullish engulfing in July or just a solid bounce from a severely overdone red candle in December) foreshadowed strong bullish move higher. I suggested in my prior article at the start of May that the bearish engulfing candle on May 1 (after making a new all-time high) might lead to some healthy profit-taking, retrenchment, and testing of support levels, which is exactly what happened. Now the bullish engulfing candle on the weekly chart, along with the upward-pointing oscillators, might be suggesting another imminent run at the highs.
Latest Sector Rankings:
Relative sector rankings are based on our proprietary SectorCast model, which builds a composite profile of each of nearly 500 equity ETFs based on bottom-up aggregate scoring of the constituent stocks. The Outlook Score employs a forward-looking, fundamentals-based multifactor algorithm considering forward valuation, historical and projected earnings growth, the dynamics of Wall Street analysts’ consensus earnings estimates and recent revisions (up or down), quality and sustainability of reported earnings, and various return ratios. It helps us predict relative performance over the next 2-6 months.
In addition, SectorCast computes a Bull Score and Bear Score for each ETF based on recent price behavior of the constituent stocks on particularly strong and weak market days. A high Bull score indicates that stocks within the ETF recently have tended toward relative outperformance when the market is strong, while a high Bear score indicates that stocks within the ETF have tended to hold up relatively well (i.e., safe havens) when the market is weak.
Outlook score is forward-looking while Bull and Bear are backward-looking. As a group, these three scores can be helpful for positioning a portfolio for a given set of anticipated market conditions. Of course, each ETF holds a unique portfolio of stocks and position weights, so the sectors represented will score differently depending upon which set of ETFs is used. We use the iShares that represent the ten major U.S. business sectors: Financial (IYF), Technology (IYW), Industrial (IYJ), Healthcare (IYH), Consumer Goods (IYK), Consumer Services (IYC), Energy (IYE), Basic Materials (IYM), Telecommunications (IYZ), and Utilities (IDU). Whereas the Select Sector SPDRs only contain stocks from the S&P 500 large cap index, I prefer the iShares for their larger universe and broader diversity.
Here are some of my observations on this week’s scores:
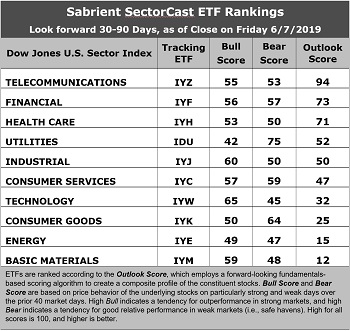
1. Telecom stays in the top spot with a robust Outlook score of 94. (It is worth noting that nearly 50% of the IYZ ETF is made up of two stocks: CSCO and VZ.) It displays the lowest forward P/E of 14.4x, the best sell-side analyst sentiment (net positive revisions to EPS estimates), and solid return ratios. However, its pure GARP metrics are only average, with projected year-over-year EPS growth rate of 7.3% and a forward PEG ratio (forward P/E divided by projected EPS growth rate) of 1.96, which ranks it 8th out of 10 sectors on PEG, ahead of only fellow defensive sectors Utilities and Consumer Goods (Staples/Noncyclical), which is why we don’t see many Telecoms as candidates for Sabrient’s GARP portfolios (which have a 12-24 month outlook rather than 2-6 months used in SectorCast). Financial remains in second with an Outlook score of 73, as it displays a relatively low forward P/E of 14.4x, neutral sell-side analyst sentiment (when many sectors have net negative revisions), and solid projected year-over-year EPS growth rate of 13.6%, along with a low forward PEG ratio of 1.06. Healthcare takes third once again with an Outlook score of 71, as its pure GARP metrics have become more attractive as investors have shied away due to election campaign rhetoric (forward P/E of 16.6, projected EPS growth of 10.2%, forward PEG of 1.63). Somewhat surprisingly, defensive stalwart Utilities sits in the fourth spot despite a high forward P/E of 18.4x and the lowest projected EPS growth rate of 4.9%, mainly because it still has slightly positive net EPS revisions. Rounding out the top seven are Industrial, Consumer Services (Discretionary/Cyclical), and Technology.
2. At the bottom of the rankings we find cyclical sectors Materials and Energy. These sectors have seen the largest net reductions to their earnings estimates from the sell-side analyst community (even though Materials led the rally last week).
3. Looking at the Bull scores, Technology enjoys the top score of 65, followed by Industrial at 60, as stocks within these sectors have displayed relative strength on strong market days. Defensive sector Utilities scores the lowest at 42. The top-bottom spread is a healthy 23 points, which reflects low sector correlations on strong market days. It is desirable in a healthy market to see low correlations reflected in a top-bottom spread of at least 20 points, which indicates that investors have clear preferences in the market segments and stocks they want to hold (rather than broad risk-on behavior).
4. Looking at the Bear scores, as usual we find defensive sector Utilities alone in the top spot with a score of 75, followed by Consumer Goods (Staples/Noncyclical) at 64, which means that stocks within these sectors have been the preferred safe havens lately on weak market days. Technology has the lowest score of 45, as investors have fled during recent market weakness (although there hasn’t been much this year). The top-bottom spread is 19 points, which reflects low sector correlations on weak market days. Ideally, certain sectors will hold up relatively well while others are selling off (rather than broad risk-off behavior), so it is desirable in a healthy market to see low correlations reflected in a top-bottom spread of at least 20 points.
5. Telecom displays the best all-around combination of Outlook/Bull/Bear scores, followed by Financial, while Energy is the worst. Looking at just the Bull/Bear combination, Utilities is the best (due to its ultra-high Bear score), followed by Consumer Services (Discretionary/Cyclical). Note that Consumer Services shows better balance between its Bull and Bear scores, indicating superior relative performance (on average) in extreme market conditions (whether bullish or bearish). Energy again scores the worst, as oil prices have been weak.
6. I would say this week’s fundamentals-based Outlook rankings reflect a neutral bias, given that a couple of defensive sectors score on the higher end while a couple of highly cyclical sectors sit on the bottom. We’ll watch how this trend develops. Keep in mind, the Outlook Rank does not include timing, momentum, or relative strength factors, but rather reflects the consensus fundamental expectations at a given point in time for individual stocks, aggregated by sector.
ETF Trading Ideas:
Our Sector Rotation model, which appropriately weights Outlook, Bull, and Bear scores in accordance with the overall market’s prevailing trend (bullish, neutral, or defensive), still displays a bullish bias and suggests holding Telecom (IYZ), Technology (IYW), and Industrial (IYJ), in that order. (Note: In this model, we consider the bias to be bullish from a rules-based trend-following standpoint when SPY is above both its 50-day and 200-day simple moving averages.) During May, the bias moved from bullish to neutral to defensive, but the first week of June has returned it to the bullish bias it displayed at the beginning of May.
Besides iShares’ IYW, IYZ, and IYJ, other highly-ranked ETFs in our SectorCast model (which scores nearly 500 US-listed equity ETFs) from the Telecom, Technology, and Industrial sectors include First Trust SPDR S&P Telecom (XTL), iShares North America Tech-Multimedia Networking (IGN), and First Trust Industrials/Producer Durables AlphaDEX (FXR).
If you prefer a neutral bias, the Sector Rotation model suggests holding Telecom, Financial, and Healthcare, in that order. On the other hand, if you are more comfortable with a defensive stance on the market, the model suggests holding Utilities, Telecom, and Financial, in that order.
An assortment of other interesting ETFs that are scoring well in our latest rankings include SPDR S&P Regional Banking (KRE), VanEck Vectors Pharmaceutical (PPH), US Global Jets (JETS), First Trust NASDAQ Bank (FTXO), Direxion Zacks MLP High Income (ZMLP), iShares NASDAQ Biotechnology (IBB), Global X MLP (MLPA), iShares US Financial Services (IYG), ALPS Alerian MLP (AMLP), SPDR S&P Capital Markets (KCE), First Trust RBA American Industrial Renaissance (AIRR), and Arrow QVM Equity Factor (QVM).
IMPORTANT NOTE: I post this information periodically as a free look inside some of our institutional research and as a source of some trading ideas for your own further investigation. It is not intended to be traded directly as a rules-based strategy in a real money portfolio. I am simply showing what a sector rotation model might suggest if a given portfolio was due for a rebalance, and I do not update the information on a regular schedule or on technical triggers. There are many ways for a client to trade such a strategy, including monthly or quarterly rebalancing, perhaps with interim adjustments to the bullish/neutral/defensive bias when warranted, but not necessarily on the days that I happen to post this article. The enhanced strategy seeks higher returns by employing individual stocks (or stock options) that are also highly ranked, but this introduces greater risks and volatility. I do not track performance of the ideas mentioned here as a managed portfolio.
Disclosure: At the time of this writing, the author held long options positions on the SPY and IWM.
Disclaimer: This newsletter is published solely for informational purposes and is not to be construed as advice or a recommendation to specific individuals. Individuals should take into account their personal financial circumstances in acting on any opinions, commentary, rankings, or stock selections provided by Sabrient Systems or its wholly-owned subsidiary Gradient Analytics. Sabrient makes no representations that the techniques used in its rankings or analysis will result in or guarantee profits in trading. Trading involves risk, including possible loss of principal and other losses, and past performance is no indication of future results.