Sector Detector: Historic earnings boom outpaces meteoric stock market surge

by Scott Martindale
CEO, Sabrient Systems LLC
Quick note 1: Sabrient’s new Dividend 56 Portfolio just launched on 5/6 as a 24-month portfolio holding 46 dividend-paying stocks across a range of market caps and sectors. It employs a Growth & Income strategy, offering a bond-like current dividend yield of 3.36% while seeking capital appreciation potential. Notably, the next-to-terminate Dividend 48 ends on 5/22 and currently shows a gross total return of +55% vs. +26% for S&P 500 High Dividend ETF (SPYD) and +44% for S&P 500 (SPY), as of 5/15.
Quick note 2: Sabrient employs a variety of fundamental financial factors in our quantitative models and portfolio selection process. Sabrient Scorecards for Stocks and ETFs are investor tools that provide access to several of our proprietary models for idea generation and portfolio monitoring. I invite you as well to visit https://MoonRocksToPowerStocks.com to immediately download founder David Brown’s latest book (an Amazon international bestseller) and 2 bonus reports (on investing in the Future of Energy and Space Exploration)—all in PDF format.
Overview
The market has been in parabolic mode—and it’s all about earnings, pricing power, and ROI (current and forward) rather than multiple expansion (or hope and prayers). As Bespoke Investment Group observed last week, following a 70% gain just since 3/31 the PHLX Semiconductor Index (SOX) was trading 36% above its 50-day moving average for only the third time in the past 30 years, with the other two occurring during the dot-com bubble. Moreover, the Nasdaq 100 (QQQ) was trading 15% above its 50-day moving average for the first time since 2009 (coming out of the GFC). However, today’s enthusiasm differs from prior speculative technology cycles in several ways. For instance, revenue growth tied to AI infrastructure has been tangible and substantial, particularly with datacenter businesses that fulfill the insatiable compute demand by housing high-density servers, GPUs, and networking equipment that act as the infrastructure backbone for cloud computing and AI training workloads. In other words, the rally is not being driven solely by narrative momentum like the dot-com boom—it is also driven by accelerating revenue generation and real cash flow and earnings.
Indeed, Q1 corporate earnings season has been particularly strong, beating even the most optimistic forecasts and providing big increases in forward guidance. Approximately 84% of S&P 500 companies have exceeded analyst profit expectations, representing the highest beat rate since 2021, according to FactSet. Large-cap companies, especially within Technology and Communications Services, continue to demonstrate operating leverage and strong margin resilience despite elevated interest rates and lingering inflationary pressures. According to DataTrek, “US Big Tech (ex-Nvidia) generated $183.4 bn in cash flow in Q1 2026 and spent $183.7 bn on CapEx and strategic investments….” We are entering a productivity boom, which is driving an historic earnings boom. Forward estimates are growing faster than they did in the mid-90s or late dot-com bubble years—and without having economic recovery comps to artificially boost them.
FactSet data shows that for Q1, with 89% of companies having reported, the S&P 500 in aggregate is showing a YoY earnings growth rate of +27.7% (the highest since +32.0% in Q4 2021). The sectors seeing the biggest increases are Information Technology (+50.7%); Communication Services (+48.8%); and Materials (+43.2%), while Healthcare trails with a negative growth rate of -3.1% (the only one negative). As for revenue growth, the aggregate is +11.4% YoY (the highest since +13.9% in Q2 2022), led by InfoTech at +29.2% and Comm Services at +15.0%. Moreover, analysts have increased their S&P 500 earnings estimate for CY2026 to $333.25—implying a P/E of 22.2x based on the closing price on 5/15. Thus the CY2026 EPS forecast suggests +21.3% YoY growth over CY2025 (vs. +17.1% expected as of 3/31, before the latest reports and guidance came out), and Tech is now indicating +38.7% YoY EPS growth (vs. +23.4% expected on 3/31).
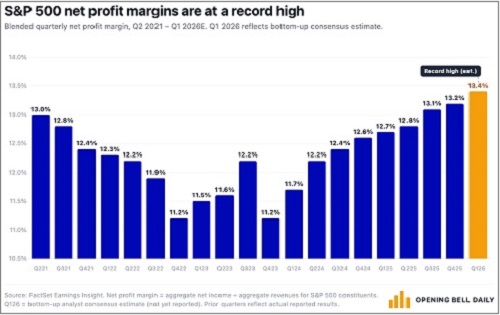
Furthermore, according to FactSet, Q1 2026 net profit margin for the S&P 500 (aggregated bottom-up) is tracking toward a record high (since data began publication in 2009) of 13.9% vs. the 5-year average of 12.3%, as illustrated in the chart below from Phil Rosen of Open Bell Daily. Notably, 6 of the 11 sectors are tracking above their 5-year average. And looking ahead, net margin is expected to climb to 14.6% by Q3. According to DataTrek Research, ““Earnings growth drives the narrative around price/earnings ratios, but it is trends in structural profitability that actually change investors' perceptions of underlying value…. Index valuations are increasing as a result, a natural if underappreciated outcome related to these improvements…and supports the argument for a ‘recession proof’ US economy.”
The Buffett Indicator (total US stock market cap divided by GDP) has reached 230% of GDP, far beyond even the 2000 dot-com bubble. And yet because of extraordinary earnings reports and optimistic forward guidance, P/E multiples are actually falling. For example, the next-12-months forward P/E for the Technology Select Sector SPDR (XLK) is 27.6x, down from its peak above 31 last October. Meanwhile, the S&P 500 trades at only 22.0x, down from 23.5x in October.
As for inflation and interest rates, I continue to believe the Fed is missing the mark and should be more accommodative. Incoming Fed chair Kevin Warsh will confront an FOMC that largely believes monetary policy should be tighter, with higher fed funds rate in the face of rising inflation readings. However, as I explain in my full commentary below, the latest inflationary surge is an event-driven supply shock—i.e., supply chain disruptions in the Strait of Hormuz and the resulting oil price spike (illustrated by the surging Global Supply Chain Pressure Index)—rather than structural (i.e., an overheated economy and excess consumer demand), many interest-rate-sensitive segments of the economy are still struggling. I believe that the fed funds rate should be 3.0% and that the 10-year Treasury note yield will eventually retreat back down to around 4.0%.
In my full commentary below, I discuss stock patterns and valuations, the AI-driven earnings boom, the 4-layer AI “stack” and its major players, GDP, productivity, inflation, liquidity, and Fed policy. And in my Final Comments section I discuss why the Iran oil supply shock is a reason to better diversify oil supply routes and pursue nuclear energy—not give license to ramp up solar, wind, and batteries. Then I close with my usual update on Sabrient’s sector rankings, positioning of our sector rotation model, and some top-ranked ETF ideas.
Despite narrow market breadth, Big Tech remains a must-own for its amazing growth and safe haven sentiment among investors. Still, 2026 should continue to be a good year for active stock selection, small caps, and bond-alternative dividend payers (particularly since the dividend yield on the S&P 500 is down to just 1.03%). Indeed, Sabrient’s Baker’s Dozen, Forward Looking Value, Small Cap Growth, and Dividend portfolios have been largely outperforming their benchmarks. Each is packaged and distributed as a unit investment trust (UIT) by First Trust Portfolios (https://ftportfolios.com).
By the way, our new Q2 2026 Baker’s Dozen Portfolio just launched on 4/17 as a 15-month portfolio with a mid-cap bias and a diverse group of 13 stocks across 8 business sectors (InfoTech, Financials, Industrials, Healthcare, Consumer, Comm Services, Energy, and Materials). Notably, last year’s Q1 2025 Baker’s Dozen terminated on 4/20 with a gross total return of +46.7% (vs. +20.3% for SPY), and the next-to-terminate Q2 2025 portfolio is up +56% vs +42% for SPY (as of 5/15). And, as a reminder, our Earnings Quality Rank (EQR) is licensed to the actively managed, low-beta First Trust Long-Short ETF (FTLS) as a quality prescreen. It has over $2.3 billion in AUM.
Sabrient’s models and selection process seek high-quality companies with strong growth trends and expectations. Specifically, it identifies stocks that are fundamentally strong with a history of consistent, reliable, resilient, durable, and accelerating sales and earnings growth, positive revisions to Wall Street analysts’ consensus estimates, a history of meeting/beating estimates, rising profit margins and free cash flow, high capital efficiency (e.g., ROI), solid earnings quality and conservative accounting practices, a strong balance sheet, low debt burden, competitive advantage, a wide moat, and a reasonable valuation compared to its peers and its own history.
These are the factors Sabrient employs in our quantitative models and “quantamental” portfolio selection process. You can learn how to access several of our proprietary models for idea generation and portfolio monitoring through Sabrient Scorecards, as well as download Sabrient founder David Brown’s latest book (an Amazon international bestseller), by visiting this link: Moon Rocks to Power Stocks
Here is a link to this post in printable PDF format, where you also can find my latest Baker’s Dozen presentation slide deck. As always, I’d love to hear from you! Please feel free to email me your thoughts on this article or if you’d like me to speak on any of these topics at your event! Read on….
Market Commentary
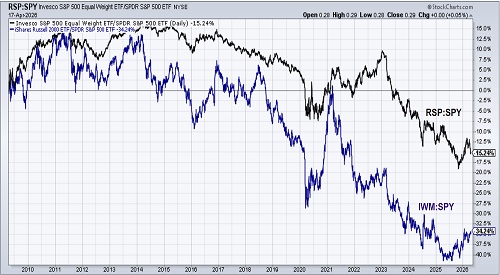
Despite the amazing Q1 earnings season and ramped-up guidance, market breadth has weakened once again, with more new 52-week lows than highs while the index itself simultaneously reached a new high. And sector dispersion has become increasingly pronounced. Technology and semiconductor-related equities continue to attract capital flows, while cyclical and defensive sectors alike struggle to establish sustained momentum. The chart below shows the past 20-year history of the ratio of equal-weight S&P 500 (RSP) to cap-weight (SPY), along with the ratio of small-cap Russell 2000 (IWM) to SPY. Both RSP and IWM remain near their lowest historical levels versus SPY. This to me is indicative of the many struggling interest-rate-sensitive segments of the economy…and the need for rate cuts.
Those struggling segments include Healthcare, Financials, Consumer Discretionary, and housing (high mortgage rates). According to economist Julien Garran of MacroStrategy Partners UK, “Several factors are set to keep long yields higher for longer across the cycle: blowout US budget deficits, geopolitical fracture, while collapsing demographics and rising budget deficits offshore reduce the overseas demand for Treasuries. This is squeezing rate sensitive sectors like housing, multifamily, office, autos, private credit & private equity, at a time when, in past cycles, they would be thriving.” By the way, our federal deficit is tracking at about $1.9 trillion (of which about $1 trillion is interest expense), or 6.2% of US GDP.
However, it is encouraging to see that small cap leadership has been gaining traction versus SPY since Q4 2025, even though RSP has resumed its (relative) slide with its ratio to SPY back to historical lows (which means the vast majority of large caps can’t keep up with Big Tech). The renewed interest in small caps likely has been driven by a combination of an historic valuation discount, fiscal support from the One Big Beautiful Bill Act (OBBBA), monetary support from lower interest rates (likely more impactful once the Iran conflict ends), and an expected +43% YoY EPS growth for 2026. DataTrek opined that, rather than purely an early cycle trade as in days of yore, “small caps are a useful way to play a resilient US economy without the overhangs of potential AI overinvestment or disruption to software business models.”
Consider the equity risk premium (ERP) over the 10-year Treasury yield for both SPY and RSP. RSP displays a much more favorable valuation, with an earnings yield of 6.0% (inverse of P/E=16.5x) while SPY has an earnings yield of 4.5% (inverse of P/E=22.0x). Comparing these numbers to the current 10-year yield of around 4.6%, RSP offers a risk premium of +1.4% while SPY is slightly negative (-0.1%). Either way, these numbers are well below what historically has been considered a “good” ERP of 2.0-3.0%—which suggests either Treasury yields or P/Es (or both) must come down. My bet is that yields will fall markedly over time as investor capital flows into both bonds (driving down yields) and stocks (on robust earnings growth rather than multiple expansion).
Improving breadth seems necessary for the market to continue higher this year. It reflects a healthy market and strong bullish conviction rather than simply momentum, which can easily reverse. CNBC recently reported that while the broad indexes keep hitting new highs, only 22% of stocks in the S&P 500 had outperformed the index over the previous 30 days as the market surge was driven by a small number of AI-oriented Big Tech firms that dominate the cap-weighted index. This compares to February’s flat market performance when the MAG-7 stocks sold off and 65% of the other stocks outperformed the broad index.
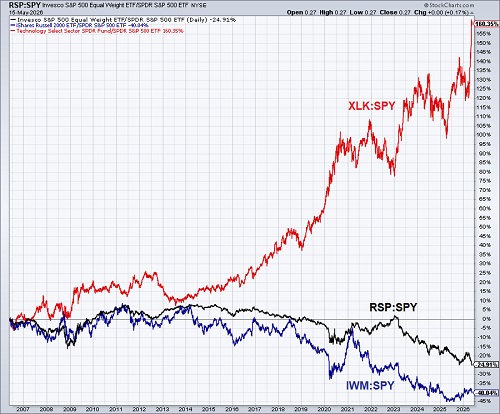
This illustrates the valuation premium investors have been willing to pay for the high-growth, mega-cap, AI-driven juggernauts. It also suggests a need for improved market breadth and some convergence of the valuation divergences. Below is another 20-year chart, which simply adds the ratio of Technology Select Sector SPDR (XLK) (Tech subset of SPY) to SPY along with the earlier two ratios (RSP:SPY and IWM:SPY), highlighting the stark outperformance of AI-driven Big Tech versus everything else.
No doubt, Tech capex and stock performance is driving the market higher. Big Tech AI capex topped $650 billion in the first quarter alone in a major move from asset-light to asset-heavy. Global semiconductor sales hit a record of $795.6 billion in 2025 (up +26.2% YoY) as demand surges across AI infrastructure, robotics/automation, and smartphones/tablets/wearables. Advanced Micro Devices (AMD) CEO Lisa Su predicts the total addressable market for AI chips will reach $1 trillion by 2030, driven by an "insatiable" demand for high-performance computing, which represents a 40% compound annual growth rate (CAGR). Taiwan Semiconductor (TSM) goes further, expecting it to reach $1.5 trillion. Jensen Huang of NVIDIA (NVDA) expects the broader, “full-stack” AI infrastructure market globally will reach $3-4 trillion by 2030, which includes datacenter construction, networking, cooling systems, power management, and server architecture.
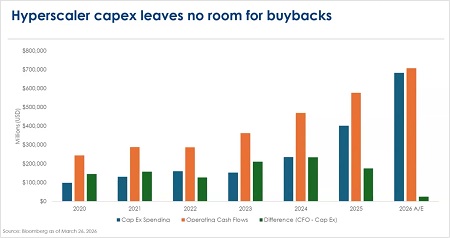
Although AI investment is only around 1-2% of the total US economy, it is driving growth with its unprecedented capex. The chart below from MassMutual shows that hyperscalers are committing hundreds of billions of dollars to AI infrastructure, which is eating up the massive cash flow of these cash-generation juggernauts, leaving little room for shareholder friendly buybacks or dividends. But investors don’t seem to mind, as they hitch their wagons to this extraordinary, generational growth story.
According to DataTrek Research, “US Big Tech now dominates global indices to the point where a handful outweigh most countries, while the AI ‘picks and shovels’ trade is near the value of the platform layer it supports. Together, this reflects a market that rewards near-term earnings visibility but is also still pricing in long-term AI-driven growth… To avoid a repeat of the Dot-Com Bust, Tech companies will need to show that incremental profits from AI exist outside the chip sector.”
On a related note, Cathie Wood of Ark Invest (always the free thinker) is focused on enterprise software, structural deflation (with AI training and inference costs falling by 75-90% annually), and specialized custom hardware. She sees current capex in the industry as a long-term floor rather than the short-term bubble that many fear. She argues that hardware efficiency gains will drastically lower the cost barrier for AI deployment, and as such, the big payoff will be in enterprise software that may hit $13 trillion globally by 2030, driven by widespread corporate adoption and the automation of 80% of current tasks in the workplace.
More broadly, Wood has outlined five primary, converging innovation themes that are set to reshape the global economy: 1) AI, 2) Blockchain/Crypto/Fintech, 3) Robotics, 4) Energy Storage (i.e., batteries), and 5) Biotech/Multiomics (e.g., DNA sequencing and personalized medicine). By “converging,” she means these technologies are not evolving in isolation but rather merging and feeding into each other with a “multiplier effect” that accelerates development across all themes, i.e., a virtuous cycle that she and her team believe will drive exponential growth in the global economy.
The inimitable Josh Brown of Ritholtz Capital wrote, “The big five hyperscalers are on track to spend over $600 billion on infrastructure in 2026 alone, with roughly 75% of that tied directly to AI. Goldman Sachs notes that consensus estimates have been too low two years running. The market keeps getting bigger faster than anyone models it…. Custom (AI chips) doesn't replace the GPU ecosystem (dominated by Nvidia). It runs alongside it, handling narrower workloads while Nvidia owns the rest. Anthropic, OpenAI and others have been explicit that inference demand is growing faster than anyone projected. The ‘we don't know how big this gets’ argument stops being a hunch and starts looking like the most defensible position in the room…. If we're all going to be walking around employing agents as personal assistants and digital coworkers three years from now, it's highly doubtful we're going to run into a glut of compute, unless the efficiency of the models just absolutely explodes, enabling us to do a lot more with a lot less than we think…. So if we can’t be sure of the overall size of the market, then it’s okay for us to harbor some uncertainty about whether or not a near-monopoly like the Nvidia GPU business may cede some market share to other players… Better to stay focused on the overall size of the pizza than start worrying about whose slice is bigger or smaller than expected.”
Taking a step back, AI can be understood through a four-layer technology “stack” and its supporting supply chain, including:
- Semiconductors – the foundational chips powering AI [e.g., NVIDIA, ASML (ASML), AMD, Micron (MU), Broadcom (AVGO), Taiwan Semi]
- Cloud infrastructure – hyperscalers providing computing power and storage [e.g., Amazon (AMZN), Microsoft (MSFT), Arista (ANET), Alphabet (GOOGL)]
- AI models – large language models (e.g., ChatGPT, Claude, Gemini)
- Applications – end-user tools that apply AI to real-world tasks [e.g., Meta (META), Adobe (ADBE), Accenture (ACN)
Hyperscalers are large-scale cloud service providers that offer computing power and storage to organizations and individuals globally. Some companies operate in a single layer, while others span multiple. Alphabet is notable for participating across nearly the full AI stack, from chips to cloud to AI models.
The AI market is also evolving. The first phase centered on training large AI models—massive, compute-intensive workloads where NVIDIA’s GPUs dominate, supported by its CUDA software ecosystem, which has become the standard for AI developers. NVIDIA and its GPU (graphics processing unit) chips dominate and should continue do so, particularly given the strong moat around its CUDA parallel computing platform and programming model that has become the de facto standard for AI developers in using NVIDIA GPUs for general-purpose processing. It acts as an intermediary layer between software and hardware, providing a programming model (using C/C++ syntax) and a runtime environment. Indeed, NVIDIA is back above $5 trillion market cap.
The next growth phase is inference—actually deploying trained models to perform useful work in real time, such as chatbots, copilots, autonomous agents, and enterprise applications. Inference has different hardware needs, relying more heavily on CPUs, ASICs, NPUs, memory, storage, and networking infrastructure. This shift is reviving companies like Intel while also benefiting Advance Micro (AMD), Arm Holdings (ARM), Micron (MU), Qualcomm (QCOM), and others.
Intel (INTC), long dismissed as a relic of the bygone dot-com era, just hit 25-year, dot-com era highs after strong Q1 earnings report and raised Q2 guidance of 11% sales growth. Why? Because the maturing AI landscape is expanding from training to inference—i.e., running models (like LLMs and SLMs) at scale in purpose-build applications—which requires different hardware, like CPUs (central processing unit), ASICs (application-specific integrated circuit, as an AI inference chip), and NPUs (neural processing unit, for on-device AI inference). According the GraniteShares, Intel is “reconsidering whether to make the company’s 18A manufacturing process available to external foundry customers, a decision that could reshape Intel’s competitive position in contract chipmaking…. the company is close to signing advanced packaging deals worth ‘billions per year,’ a sign that real revenue from foundry services is no longer theoretical.”
Agentic AI represents the next frontier, i.e., systems that don’t just answer questions but autonomously plan, code, research, and execute projects. For example, AI now generates 75% of Google’s new code and up to 30% of Microsoft’s new code, according to Chamath Palihapitiya. This requires orchestration—coordinating multiple models, workflows, and systems efficiently at scale—which increases demand for both CPUs and GPUs. This has brought back to life Intel’s long-favored x86 architecture, but Advanced Micro, Micron, and Arm will benefit as well. Those companies that become major players in custom silicon design, foundries, power suppliers, and supply chains will benefit as the entire AI ecosystem grows into its full potential. AMD’s Q1 revenue jumped nearly 38% on surging data center demand.
By the way, Taiwan Semi (aka TSMC) has become the world’s chip foundry, making over 60% of the world’s semiconductors and over 90% of the most advanced microchips—including serving as the exclusive foundry for NVIDIA’s market-leading designs. This makes the island even more desirable for China to enforce “reunification,” but also makes it so that US does not want that to happen. But if TSMC can successfully replicate its highest precision manufacturing in the US at scale, as it has begun to do at its new facility in Phoenix, then perhaps neither China nor the US will feel as strongly (one way or the other) about Taiwan’s continued independence.
Beyond chips, the broader AI infrastructure buildout is creating opportunities across the supply chain, including semiconductor equipment, memory, data center cooling, power systems, storage, networking, and construction. Beneficiaries include Broadcom (AVGO), Marvell (MRVL), Lam Research (LRCX), STMicroelectronics (STM), Texas Instruments (TXN), Western Digital (WDC), Seagate (STX), MaxLinear (MXL), Micron, Sandisk (SNDK), Lumentum (LITE), SK Hynix, Vertiv (VRT), GE Vernova (GEV), Monolithic Power (MPWR), ASM International (ASM), Sterling Infrastructure (STRL), and Comfort Systems (FIX).
Another emerging trend in the workplace is “on-premises AI,” which addresses the potential disruptions and threats to latency, connectivity, and cybersecurity. This includes the AI-powered personal computer, which incorporates CPU + GPU + NPU to run AI-accelerated software locally to learn, make decisions, and perform complex tasks like a human analyst or assistant might do. Companies that will provide the software, microprocessors, and PCs for this wave include the usual suspects like Dell (DELL), HP (HPQ), Qualcomm, Microsoft, AMD, Intel, and NVIDIA.
Unlike many software markets where competition rapidly compresses margins, AI infrastructure businesses tend to benefit from wide moats, including high barriers to entry, massive capital requirements, and deep technical expertise. That could make this AI cycle more durable than prior tech booms.
AI’s expansion is driving enormous real-world capital spending—not just on chips, but on copper, electricity, land, data centers, cooling systems, and industrial infrastructure. Datacenters require land acquisition, rapid construction near reliable power sources, and long-term energy contracts. This creates investment opportunities well beyond technology, such as in traditional utility, industrial, and mining companies. In many ways, this marks the next industrial era (Industry 5.0) comprising a deeper integration of Industry 4.0’s AI/ML, automation/robotics, IoT, Big Data, cloud computing, and human-machine collaboration that could reshape productivity across the global economy.
As Eric Peters of One River Capital wrote last weekend in his unique style, “One of the most remarkable aspects of America and our economy is how every once in a while, we develop some new technology and use it to reinvent how we operate, escaping the predicaments we face. It produces prosperity to pay for our financial sins. It’s what’s gotten us here. It fuels our optimism as a nation. AI is the technology that may save us, and the stakes have never been higher…. It’s almost as if the country has been waiting for this moment for decades. Our government has been intervening for all these years to keep the economic wheels spinning in the hope that some new innovation comes along to lift productivity and bail us all out. Our monopolies have been deepening their war chests for the day when they can build something to rival the railroad boom. Now they’re all in, pushing well past their free cash flow, leveraging up their balance sheets to win an existential race. The Trump administration in particular is making the bet that the only way over the rack is an all-in commitment, full speed ahead, no hesitation whatsoever.”
Supply chain disruptions and inflation:
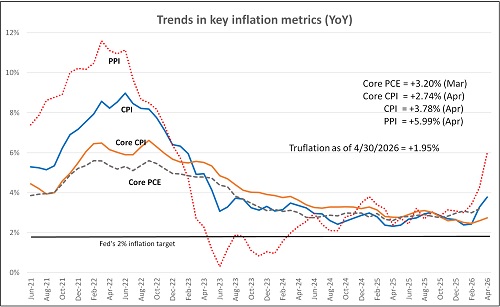
Let's examine the latest inflation readings juxtaposed with supply chain metrics. The BLS reported last week that April PPI was up +6.0% YoY, the highest in over 4 years, while Core PPI (x-food & energy) was up +5.3%. (Note: China’s PPI also jumped from +0.5% YoY in March to +2.8% in April.) Meanwhile, April CPI came in at +3.8% YoY, while Core CPI (x-food & energy) read +2.8%. Energy prices accounted for 40% of the monthly increase from March. Housing rents were the main driver of core inflation for the month and have been for the last few years, although recent data was hinting that rent increases might be slowing down. Still, as illustrated by the chart below, these are frightening trends to be sure—if they were indicative of a structural problem in the global economy.
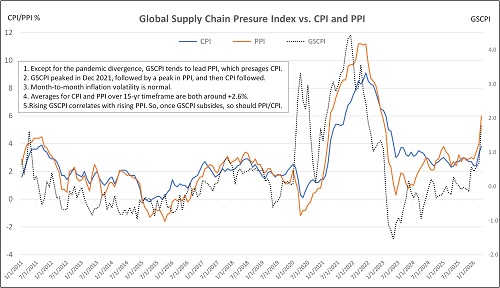
However, we all know this is mostly driven by disruptions to supply chains and the spike in oil and gas prices from the Iran conflict and ongoing blockade of the Strait of Hormuz (with only 2–5 ships/day passing through the strait compared to 70 under normal conditions). This is reflected in the New York Fed’s Global Supply Pressure Index (GSCPI) for April, which shows a z-score (number of standard deviations from the long-run average) surge to +1.82, which (not surprisingly) suggests elevated supply chain pressures back to 2022 levels (but still well below the December 2021 high of +4.49).
The chart below shows how GSCPI tends to lead PPI, which in turn tends to lead CPI. Note that correlation over the past 3 years of rising GSCPI and PPI, which is finally making CPI tick upward. Once the Iran conflict ends, energy prices and supply chain disruptions should gradually recede, alleviating these event-driven inflationary drivers so that GSCPI can recede back to the zero line—and pull PPI (and CPI) back down with it.
Looking ahead to the May inflation metrics, the Cleveland Fed Inflation Nowcast model predicts CPI of +4.18%, Core CPI of +2.82%, PCE of +4.06%, and Core PCE of +3.36%, as of 5/13. Another metric I follow is the real-time, blockchain based "Truflation” metric, which is updated daily based on 30 million data points and tends to presage CPI by several months. It is much better at reflecting current housing costs than CPI or PCE. As of the end of April, it showed just +1.95% after briefly rising well above 2.0% for a period of time.
Although the kneejerk reaction to rising CPI (no matter the cause) is to raise interest rates, but in today’s case it would create a dangerously recessionary duo of rising oil price coupled with rising interest rates. As the Natixis team wrote, “When inflation is driven by supply constraints, rather than excess demand, the objective should not be limited to reducing inflation as quickly as possible. It should be to minimize total economic damage over time… Monetary policy is designed to manage demand. When inflation arises from excess demand, the prescription is clear—hike rates. But when inflation arises from supply shocks (today’s Iran Conflict, COVID, or the Russia/Ukraine war), the problem changes but the tool does not….”
Also, former foreign service officer James Rogan wrote in the Washington Examiner, “Personal consumption growth, which drives the economy, is running at under 2%, hardly an inflationary pace. Monetary policy is also a blunt instrument. Higher interest rates cannot produce more oil, reopen shipping lanes in the Persian Gulf, or lower gasoline prices in the short term… Raising interest rates aggressively in response to an energy shock can weaken economic growth without meaningfully reducing inflation. Higher borrowing costs would slow housing activity, business investment, and hiring. The Federal Reserve should not short-circuit what appears to be sustainable 2% economic growth accompanied by rising productivity.”
I have been quite clear on my view of the overriding weight of the many powerful, secular, disinflationary trends vs. short-term, event-driven, or one-time price spikes. Those trends include aging demographics, slowing global population growth, accelerating disruptive innovation like AI and automation, rising productivity, falling shelter and energy costs, global peace (as hostile nations are quickly pacified/disarmed), modest liquidity growth, a stable dollar, and the deflationary impulse on the world from a struggling China. In addition, although there might be some inflationary impacts of reshoring of manufacturing and diversification of supply chains in the short term, it is also adding redundancy and additional domestic industrial capacity, i.e., “duplicative excess capacity,” in the words of Treasury Secretary Scott Bessent (for national security purposes), which is ultimately disinflationary.
GDP, jobs, and productivity:
I have discussed in the past that allowing for a slightly elevated inflation rate can help “inflate away” our massive federal debt as part of a 3-pronged approach in tandem with “cutting away” debt through lower spending growth and “growing our way out of debt” by targeting real GDP growth above 3%. Although GDP is sluggish for now, remember that it was dependent on government spending and subsidies, while today government spending is flat under the new administration, replaced with policies and incentives to boost the private sector—which takes some time.
Some observers believe we will hit 6% nominal GDP growth this year. One keen observer, Elon Musk, says he is “fairly comfortable” that, “In the absence of WWIII, if current trends continue, I would say that the economy is 10x in 10 years, and we’ll have a base on the moon, and we’ll people on Mars.” He also thinks we’ll have a “mass driver” on the moon, which is a electromagnetic launch system that uses magnetic fields to accelerate payloads into space at extreme speeds by converting electrical energy into kinetic energy without the need for today’s chemical rocket fuel. And yet people are fretting about things like datacenter intrusion in their neighborhoods and self-driving tractor-trailers taking away truckdriver jobs.
As a reminder, federal receipts historically (since 1960) have averaged 17% of GDP, regardless of individual and corporate tax rates. So, economic growth is the best path to higher government revenues. In fact, tax cuts can be desirable (and actually pay for themselves) if they stimulate real economic growth—and by extension, corporate capex, productivity, margins, earnings, wages, consumer spending, and tax receipts. The emerging productivity growth boom can boost real GDP growth while keeping a lid on inflation, drive up real labor compensation, and widen profit margins.
Economist Ed Yardeni observed that Q1 real GDP “…grew at an inflation-adjusted annual rate of 2.0% in Q1. Final sales to private domestic purchasers, the cleanest read on underlying demand, came in at a solid 2.5%. Business investment surged at its fastest pace in nearly three years, driven by spending on AI-related equipment and software. Exports jumped sharply. Consumer spending was up only 1.6%, probably because the weather was very bad during January and February. It should grow faster in Q2….” Notably, business investment (including IP, software, R&D, equipment, semiconductors, non-defense capital goods orders excluding aircraft, and commercial construction) has been surging at a 10.4% annualized rate (the highest in 3 years) and hitting record highs.
There are plenty of mixed economic signals. While headline Q1 GDP growth came in below expectations, the Atlanta Fed’s GDPNow for Q2 is showing 4.0%. Also, while real (inflation-adjusted) household disposable income has been flat over the past 12 months, underlying private domestic demand has remained relatively healthy as retail sales (with the exception of autos) and real consumer spending continues to grow (led by goods rather than services). Moreover, real average hourly earnings declined 0.5% in April and are down 0.3% over the past 12 months. Heather Long, chief economist for Navy Federal Credit Union, observed that, “Inflation is now eating up all wage gains for the first time in about three years… a true financial squeeze.” This combination of weaker real income and rising spending translates into a falling personal savings rate ever since Q3 2024.
Initial and continuing unemployment claims continue to fall in an ongoing “low hire, low fire” jobs market. And while the ISM Services Index for April showed expansion, the employment index at 48.0 is still in contraction, and the prices index remained elevated at 70.7 in April (highest since October 2022). Also, the latest jobs report for April showed a nice headline number and steady unemployment rate at 4.3%, but a disconcerting number of workers moved from full-time to part-time (445,000, the most since the pandemic), and the labor participation rate fell to 61.8% (lowest since 2021).
The BLS reported earlier in the month that nonfarm business productivity for Q1 2026 increased +2.9% YoY versus Q1 2025 (versus +1.5% long-term trend)—in other words, a productivity renaissance—while unit labor costs increased +2.3% QoQ (reflecting +3.1% increase in hourly compensation minus +0.8% increase in productivity) but only +1.2% YoY. Job gains were concentrated in health care, transportation and warehousing, and retail trade, suggesting continued demand in service-oriented and logistics sectors. At the same time, federal government employment continued to decline.
However, the NY Fed’s HPW Labor Market Tightness Index, which shows a z-score (number of standard deviations from the long-run average) based on the quits rate and job vacancies per job seeker to summarize current wage pressures and to forecast wage inflation, has been in a 4-year downtrend, and the March reading below the zero line at -0.02 suggests nominal wage growth below the historical average and thus no inflationary impact.
Thus, among the most significant economic concerns is the potential slowdown in consumer spending. This year’s large tax refunds have largely been spent by now, gasoline prices continue to rise (cutting into disposable income, like a tax), and wage growth has been slowing. Any meaningful deterioration in consumer spending would impact the trajectory of GDP, corporate earnings, and labor markets.
Regardless, as DataTrek recently observed, “US Demand Deposits (literally cash in the bank) stand at $6.8 trillion and have grown by +25 pct per year since 2020. This cash buffer, larger than the GDPs of every country except the US, China, and Germany, helps explain the resilience of the American economy.” Also, the Treasury General Account (TGA) recently hit its highest level since the 2020 pandemic, as taxes were paid, so as it draws down it will inject stimulative liquidity into the US economy.
And as Louis Navellier opined, “…investors seem confident the U.S. remains the safest place in the world to invest. Foreigners now hold a record $9.5 trillion in U.S. Treasuries and are expected to benefit from an appreciating U.S. dollar due to stronger economic growth, as well as higher interest rates than those available in China, Japan or the EU. Finally, the U.S. has better demographics than most countries, so its potential for future economic growth remains unmatched.”
We also have the most brilliant, visionary, polymath disruptor of our generation, Elon Musk apparently aiming to take public SpaceX/xAI on 6/12 (expected ticker is Nasdaq:SPCX), in what is sure to be biggest IPO of all time. Expectations are for the company to raise around $80 billion with a roughly $1 trillion pre-IPO valuation. Also, Anthropic—riding a meteoric rise in both revenues and status (vs. competitors like OpenAI)—apparently just agreed to a $30 billion funding round at a $900 billion pre-money valuation (giving it a $930 billion post-money valuation vs. $380 billion just in February). By the way, AI chipmaker (single-chip, wafer-scale AI accelerators) Cerebras (CRBS) IPO’d on 5/14 as the largest US Tech IPO of the year so far, raising $5.5 billion and closing its first day with a $95 billion market cap.
As economist Ed Yardeni opined a couple of years ago, “In our Roaring 2020s scenario, we are expecting a productivity growth boom during the second half of the current decade much like the one during the second half of the 1990s. In addition to boosting the growth rate of real GDP, productivity (along with hourly compensation) determines unit labor costs (ULC)—the y/y percent change of which is the underlying inflation rate… In our Roaring 2020s scenario, CPI inflation continues to moderate along with ULC inflation as productivity growth continues to improve…. If productivity growth climbs to 3.5%-4.5% over the rest of this decade, as we expect, that would boost the growth rate of real GDP while keeping a tight lid on inflation.”
While artificial intelligence is widely expected to enhance productivity and improve operational efficiency across industries, Goldman Sachs chief economist Jan Hatzius cautioned that these gains may not produce uniformly disinflationary outcomes and “could reduce labor demand intensity over time, potentially reshaping employment dynamics.” He noted that each incremental improvement in productivity may lead to fewer workers needed to support a given level of GDP growth.
However, Ed Yardeni wrote, “We disagree with the widely held notion that AI is a net job killer. In our opinion, AI will create jobs on balance. Humans will use AI to achieve greater output at lower cost, creating a wealthier society that needs more and newer types of human labor. We agree with Jevons' Paradox: Making a production input more efficient lowers the cost of the final product, which stimulates demand for it, and ultimately results in greater demand for the input itself, despite the productivity gain.” Eric Peters believes, “The shape of the resulting chart for AI compute price vs. demand is logarithmic, and consumption trends toward infinity.” Indeed, the NY Fed’s latest Survey of Consumer Expectations shows that not only are inflation expectations modest, but respondents don’t seem concerned about job loss.
Liquidity and Fed policy:
The 10-year Treasury yield climbed from 3.84% in early March to 4.44% by March 27, the fastest 3-week rise since October 2023. It then meandered lower to around 4.25%, but now it is spiking again to nearly 4.60%, as of 5/15—and the 30-year surged past the 5.0% mark (to 5.13% on 5/15), triggered by a $25 billion auction that drew such weak demand that it was the first time since 2007 that a 30-year bond auctioned with a 5% handle. However, looking back over the 30-year period that ended 4/30, the average monthly yield on the 10-year T-note was around 3.6% while the CPI averaged 2.5%, according to Bloomberg—implying an average real yield of 1.1%. So, with April CPI at 3.8%, it’s not surprising for the 10-year T-note rising as well. Adding the 1.1% average real yield would put it at 4.9%.
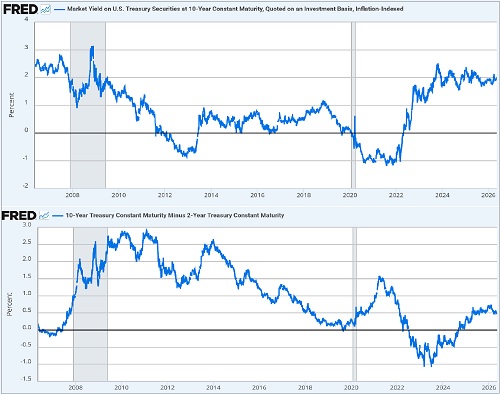
However, as I discussed earlier, this event-driven supply-shock spike in inflation is not likely the new normal. As shown in the upper chart below from the St. Louis Fed (FRED), the 10-year constant maturity market (real, inflation adjusted) yield continues to hover around the 2.0% line, as it has for the past 3 years. According to DataTrek Research, “US short term real (after inflation) interest rates have been positive since June 2023, the longest stretch since the mid/late 1990s. This is unalloyed good news for all investors, as it sets the cost of capital correctly and suggests continued strength in the US economy.” Also, the lower chart shows that the 10-2 Treasury yield spread un-inverted in late-2024 (after 2 years of inversion) and has normalized back to around +0.50% for the past 13 months.
The private sector is good at creating price deflation (lower prices due to competition and productivity improvement) while the government is good at creating asset inflation (higher prices due to monetary and fiscal policy intervention that increases liquidity). The private sector is the main engine of innovation and productivity, which can lower costs, while government heavily influences financial conditions and liquidity, which can amplify or dampen asset prices.
Incoming Fed chair Kevin Warsh was successfully confirmed last week. He wishes to shorten the maturity structure of the Fed’s assets and reduce its holdings of longer-term securities, as well as eliminate purchases altogether of mortgage-backed securities (MBS), focusing exclusively on Treasuries. Importantly, he also wants the Fed to unwind its past Quantitative Easing (strategically purchasing securities to control the yield curve) and end QE as a permanent form of monetary policy rather than as a temporary (emergency) tactic.
This means the Fed also would have to end today’s abundant reserves policy of paying banks interest on reserves and return to its previous scarce reserves policy. Simply put, before 2008, the Federal Reserve used scarce reserves to manage monetary policy, influencing interest rates through small changes in reserve supply. Banks were not incentivized to hold reserves. After the financial crisis, the Fed adopted an abundant reserves system, setting rates administratively using tools like interest rate on reserve balances (IORB) and overnight reverse repurchase agreements (ON RRP), which create target interest rates to incentive more (looser) or less (tighter) outside lending. This shift brought greater stability and less market volatility but increased the Fed’s presence in money markets and blurred the lines between monetary and fiscal policy while also making the financial system more dependent on the Fed and thus more vulnerable to policy risks.
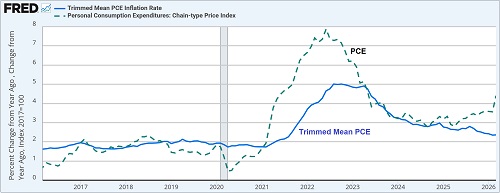
Warsh seems to advocate a “trimmed-mean” inflation metric as a replacement for the Fed’s current models. Trimmed mean strips out the outliers to filter the most extreme price swings that can distort. By excluding outliers—both unusually high and unusually low—it is designed to offer a more stable and relevant perspective. As displayed in the chart below, it is less volatile, and the current reading (for March) of +2.36% is well below headline PCE of +4.40%.
Furthermore, Warsh desires a more collaborative relationship between the Fed and US Treasury Department, stating, “We need a new Treasury-Fed accord, like we did in 1951 after another period where we built up our nation’s debt and we were stuck with a central bank that was working at cross purposes with the Treasury. That’s the state of things now. So, if we have a new accord, then the Fed chair and the Treasury secretary can describe to markets plainly and with deliberation. This is our objective for the size of the Fed’s balance sheet.”
The 1951 Fed-Treasury Accord separated monetary policy from debt management. Today, we are again seeing a similar version of this whereby the Treasury Dept. skews debt issuance toward short-term T-bills and volatility-targeted buybacks, aka Yield Curve Control (YCC). While QE focuses on purchasing a specific quantity of bonds to inject liquidity, YCC targets a specific interest rate (price) for government bonds.
A concern presented by Julien Garran of MacroStrategy Partners UK, is that we might be on the precipice of a reflation/dollar debasement cycle, which would push up prices of natural resources and turbocharge the commodity Supercycle, lead to a value rotation, and perhaps benefit a country like India due to its strong domestic consumption, rapid industrialization, massive infrastructure development, and growing foreign investment (as a diversification away from China and the US). Other countries like Brazil, Chile, Indonesia, Australia, and Canada also might be boosted by rising commodity prices and foreign direct investment (FDI).
Another perspective comes from economist Michael Howell of CrossBorder Capital, who asserts that while financial markets are intended to provide capital for new projects and ventures, and interest rates are supposed to balance between the needs of both borrowers and investors, the reality is that roughly 80% of all primary transactions are actually debt refinancing (rather than new capital raising). So, the country that “wins” the capital wars is the one that controls the collateral, of which there are really just two—sovereign treasury bonds and gold. Regarding sovereign bonds, the US dollar and US Treasury market are in total control, despite what you hear about BRICS nations and their de-dollarization intentions, and this is further reinforced by the US embrace of stablecoins (as opposed to China’s limits on crypto, given the country’s economic and financial struggles and capital controls to protect the value of the yuan).
In addition, the massive trade surpluses in China, Japan, South Korea, and Taiwan creates cash that must be invested, and the only market large enough to absorb much of it is the US, primarily US Treasuries but also stocks and foreign direct investment (FDI). However, it should be noted that although China has a massive trade surplus (nearly $1.2 trillion in 2025), it also has a large budget deficit (officially 4% of GDP in 2025, although accounting for substantial off-budget bonds and local government debt, the actual deficit may be more like 7.2–8.8% of GDP), which can eat up its surplus cash and thus lower its demand for US Treasuries.
Although the economic data has remained resilient despite the geopolitical turmoil, money is being drained from financial assets to fund the real economy. I mentioned earlier Michael Howell’s opinion that the country that wins the capital wars is the one that controls the collateral, mainly sovereign bonds and gold, but today he is concerned that the concurrent selloff in both bonds and gold is evidence of stagnant global liquidity.
Interestingly, Howell is not convinced that lower interest rates have a net benefit to the private sector as is widely assumed. Why? Because the private sector is essentially a major lending source for the federal government, if the US pays out higher interest rates, that means more money into the private sector (including pension funds and retirees) and thus more disposable income. However, it seems to me that the negative impact on the middle/working classes and interest-rate sensitive market segments—like the housing market (mortgage rates)—is more clear-cut.
Final comments:
The ongoing oil supply disruption and price spike has severely hindered the global economy. But it has not crippled it, in particular the US economy and stock market, which is again challenging all-time highs. Why? According to Real Investment Advice (RIA), “Look at the futures curve. Front-month Brent is around $108–110, but the December 2026 contract is pricing roughly $80, and the back end falls into the $60s by late 2027. That is the steepest backwardation in modern oil history. The futures market is making a clean bet: this shock is severe but short-lived. Equities are trading the futures view that by year-end, oil normalizes and the earnings drag is contained.”
But even as the oil shock has ignited extensive rerouting of supply chains to put the world less at the mercy of such a volatile part of the world (as I discussed at length in my April post), including surging production and exports from North America, it begs the question, why not fully decarbonize and use 100% solar/wind/batteries? Indeed, according to Bloomberg, “BloombergNEF has tracked 4.9 gigawatts of energy storage announcements that are co-located with on-site fossil fuel generation at data centers. That's about 32% of announced global on-site data center battery capacity. The sites include some of the largest AI data center complexes under development, such as Elon Musk's Colossus supercomputer in Memphis, Tennessee, and the combo has become so popular that companies such as Caterpillar Inc. and GE Vernova Inc. have announced products or partnerships pairing energy storage with gas generation.”
The primary criticism of a grid built entirely on renewables and batteries isn’t that the technology doesn’t work, it’s that it doesn’t yet work reliably over long durations at a tolerable cost. Solar and wind are inherently intermittent; they produce power when conditions allow, not necessarily when demand requires it. Batteries can certainly help bridge that gap, but today’s dominant systems, primarily lithium-ion, are optimized for short-duration storage, typically no more than a few hours. That’s enough to smooth daily fluctuations, such as shifting excess solar power into the evening, but it falls short when the grid faces multi-day periods of low wind and/or limited sunlight (cloudiness). Those events, which are not rare, are exactly the conditions the grid must be designed to survive.
The economics compound the problem. Although battery costs have fallen dramatically, they scale roughly in proportion to the amount of energy stored. Extending storage from four hours to a full day or several days requires proportionally more materials, more capital, and more physical space. This makes long-duration storage at scale prohibitively expensive with current technology. Alternatives like pumped hydro storage can provide long-duration backup more cheaply, but it is geographically constrained. Meanwhile, lithium-ion systems degrade over time, meaning they must be replaced on a regular basis, adding yet another layer of lifecycle cost.
Beyond the economic issues, there are practical constraints of scale and reliability. Power grids are engineered to extremely high fail-safe reliability standards, i.e., failures (brownouts/blackouts) are unacceptable, not just inconvenient. Meeting those standards with renewables alone would require massive overbuilding of generation capacity, enormous storage reserves to cover worst-case scenarios, and a significant expansion of transmission infrastructure to move power from where it is produced to where it is needed. The materials requirement alone—including lithium, copper, and nickel—would require a substantial expansion of global supply chains. Even then, the system would still need to perform under extreme conditions like prolonged weather disruptions or sudden demand spikes.
For these reasons, batteries are best understood today as a partial solution, not a complete one. They are highly effective at stabilizing short-term fluctuations and increasing the usable share of renewable energy, but they cannot yet replace the role of dispatchable power sources that can be turned on/off at will. Until storage technologies evolve to deliver multi-day reliability at much lower cost, most power systems will continue to rely on a mix of renewables, batteries, and traditional generation. The transition is real, but the final stretch—the last portion required to achieve full reliability without fossil fuels—remains the most technical and economically challenging piece to solve. Until then, we must have sufficient fossil fuels-based generation capacity to meet full baseload requirements…and only employ redundant renewable energy capacity as a means to reduce the volume of oil & gas consumed and the associated carbon footprint.
Our power grid is experiencing the largest growth in demand since World War II due to new manufacturing facilities (reshoring and re-industrialization) as well as cutting-edge innovations like AI and crypto mining. American innovation must have the tools it needs to compete on a global scale and to meet energy demand. I believe nuclear power (fission today, including small modular reactors, and hopefully fusion in the future) is the key to unlocking this potential in the longer term.
Erik Townsend recently wrote on Substack, “Energy transition is the single greatest challenge humanity faces in the 21st Century…. Human prosperity and societal complexity are a function of the amount of abundant and affordable energy available to the economy… But sadly, almost nobody fully appreciates the role of energy in our lives. The more affordable and abundant clean energy we can provide to society, the better our standard of living. The most important point is that cost matters. We need to make clean energy cost much less than fossil fuel energy costs today, else we won’t solve the prosperity problem, which I contend is far more important to humanity than climate change mitigation…. Modern, safe, clean nuclear energy is the only sane solution to this dilemma, and it’s been available to us for decades. Failed U.S. Government energy policy and misplaced anti-nuclear hysteria are to blame for the half-century delay in embracing the obvious solution to our most challenging societal problem.”
I discussed the history of energy, today’s surging demand, likely solutions, key companies, and Sabrient’s top Energy sector picks, in my special report, “The Future of Energy: The Lifeblood of an Economy.” You can find it at: https://MoonRocksToPowerStocks.com.
You also can learn more about Sabrient’s process-driven, growth-at-a-reasonable-price active-selection methodology as revealed by Sabrient founder and former NASA engineer (Apollo Program) David Brown in his new book, Moon Rocks to Power Stocks: Proven Stock Picking Method Revealed by NASA Scientist Turned Portfolio Manager. It is also available in both paperback and eBook formats on Amazon (an international bestseller!). It teaches how to methodically and strategically build wealth in the stock market for four distinct investing styles—growth, value, dividend, and small cap. You also get two Bonus Reports on the history and new opportunities for 1) Energy and 2) Space Exploration, including our top stock picks for each.
Or if you just want to find out how to access the Sabrient Scorecard, an investor tool that provides access to our proprietary scores for all stocks to make the stock evaluation process easy for idea generation and portfolio monitoring, along with our Top 30 stocks each week for 4 distinct investing strategies—Growth, Value, Dividend, and Small Cap—I welcome you to visit: https://www.moonrockstopowerstocks.com/sabrient-scorecard

Latest Sector Rankings
Relative sector rankings are based on Sabrient’s proprietary SectorCast model, which builds a composite profile for each of over 1,500 equity ETFs based on bottom-up aggregate scoring of the constituent stocks. The Outlook Score is a Growth at a Reasonable Price (GARP) model that employs a forward-looking, fundamentals-based multifactor algorithm considering forward valuation, historical and projected earnings growth, the dynamics of Wall Street analysts’ consensus earnings estimates and recent revisions (up or down), quality and sustainability of reported earnings, and various return ratios. It helps us predict relative performance over the next 3-6 months.
In addition, SectorCast computes a Bull Score and Bear Score for each ETF based on recent price behavior of the constituent stocks on particularly strong and weak market days. A high Bull score indicates that stocks held by the ETF recently have tended toward relative outperformance when the market is strong, while a high Bear score indicates that stocks within the ETF have tended to hold up relatively well (i.e., safe havens) when the market is weak. Outlook score is forward-looking while Bull and Bear are backward-looking.
As a group, these three scores can be helpful for positioning a portfolio for a given set of anticipated market conditions. Of course, each ETF holds a unique portfolio of stocks and position weights, so the sectors represented will score differently depending upon which set of ETFs is used. We use the iShares that represent the ten major U.S. business sectors: Financials (IYF), Technology (IYW), Industrials (IYJ), Healthcare (IYH), Consumer Staples (IYK), Consumer Discretionary (IYC), Energy (IYE), Basic Materials (IYM), Telecommunications (IYZ), and Utilities (IDU). Whereas the Select Sector SPDRs only contain stocks from the S&P 500 large cap index, I prefer the iShares for their larger universe and broader diversity.
The table below shows the latest fundamentals-based Outlook rankings and our full sector rotation model:
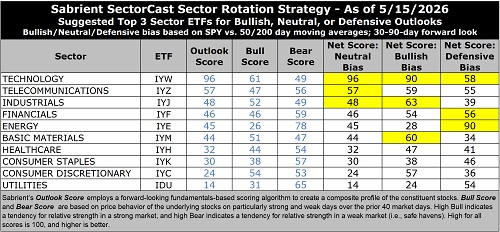
The latest rankings display a neutral bias, in my view, given that cyclicals and secular growth sectors dominate the top of rankings, and most sectors score below 50. Next 12 months (NTM) analyst earnings forecasts still look quite strong across the board, and investors seem to be looking beyond the unknown impacts of war and the on/off shipping blockade on energy supply chains. Only Consumer Staples have seen reduced EPS estimates. As I mentioned earlier, FactSet says S&P 500 Q1 2026 EPS growth is +27.7% YoY (the highest since +32.0% in Q4 2021), led by Information Technology (+50.7%), and expected CY2026 EPS growth over CY2025 is tracking to +21.3%.
Technology (dominated by the mega-cap Big Tech titans and AI-driven highflyers) remains firmly at the top with a robust Outlook score of 96, reflecting the high quality of those juggernauts despite having the highest forward P/E at 29.6x. However, this multiple is still lower than the 31x it reached last fall. Moreover, the consensus NTM EPS growth estimate of +26.9% is rising faster than price, such that the forward PEG (ratio of P/E to EPS growth) for Tech has fallen to just 1.10. Keep in mind, investors tend to be quite willing to pay up for strong growth, so the relative value gap we saw a few weeks ago is closing.
Others with low forward PEGs include Financials (1.08), Basic Materials (1.01), and Energy (1.01). As for forward P/E, Energy (13.0x) and Financials (13.6x) are the lowest.
Tech also displays solidly positive sell-side analyst earnings revisions, by far the highest profit margins and return ratios, and the best insider sentiment (open market buying). Because many Tech stocks are riding secular growth trends (i.e., little cyclicality), no other sector comes close to the consistent sales growth, margins, operating leverage, and ROI. And Tech not only benefits from its own product development and productivity gains, but those products help other companies with their product development, product delivery, and productivity—so Tech benefits also by helping all sectors grow and prosper.
After Tech, the next five sectors are Telecom, Industrials, Financials, Energy, and Basic Materials. At the bottom of the rankings are cyclical sector Consumer Discretionary and noncyclical defensive sectors Utilities and Consumer Staples. These three sectors are also the ones receiving the lowest consensus analyst revisions to EPS estimates.
Keep in mind, the Outlook Rank does not include timing, momentum, or relative strength factors, but rather reflects the consensus fundamental expectations at a given point in time for individual stocks, aggregated by sector.
To learn more about how you can access our weekly Stock and ETF Scorecards, please visit:
https://www.moonrockstopowerstocks.com/sabrient-scorecard
Sector Rotation Model and ETF Ideas
Our rules-based Sector Rotation model, which appropriately weights Outlook, Bull, and Bear scores in accordance with the overall market’s prevailing trend (bullish, neutral, or defensive), switched from a defensive to a bullish bias when the S&P 500 leapt above both its 50-day and 200-day moving averages simultaneously in early April. (Note: In this model, we consider the bias to be bullish from a rules-based trend-following standpoint when SPY is above both its 50-day and 200-day simple moving averages, but neutral if it is between those SMAs while searching for direction, and defensive if below both SMAs.)
As highlighted in the table above, the Sector Rotation model suggests holding Technology (IYW), Industrials (IYJ), and Basic Materials (IYM), in that order. Or, if you prefer to take a neutral stance, it suggests holding Technology, Telecom (IYZ), and Industrials. However, if you prefer the maintain a defensive stance, it suggests holding Energy (IYE), Technology, and Financials (IYF)…with Telecom and Utilities (IDU) close behind. As you can see, Technology is suggested in all three biases, reflecting its can’t-miss, all-weather image.
Here is an assortment of other interesting ETFs that are scoring well in our latest rankings: Sprott Active Gold & Silver Miners (GBUG), Virtus US Dividend (VUS), VanEck Junior Gold Miners (GDXJ), SP Funds S&P Global Technology (SPTE), Technology Trusector (TRUT), First Trust Small Cap Buy-Write Income (FTKI), Fidelity Enhanced Large Cap Growth (FELG), Global X PureCap MSCI Info Tech (GXPT), Invesco Dorsey Wright Technology Momentum (PTF), Inspire Fidelis Multi Factor (FDLS), iShares ESG Aware MSCI USA Growth (EGUS), Franklin Intelligent Machines (IQM), Invesco Dorsey Wright Energy Momentum (PXI), Federated Hermes MDT Large Cap Growth (FLCG), WisdomTree Efficient Gold Plus Gold Miners Strategy (GDMN), NYLI US Large Cap R&D Leaders (LRND), VictoryShares Small Cap Free Cash Flow (SFLO), ARS Focused Opportunities Strategy (AFOS), Alger Russell Innovation (INVN), NestYield Total Return Guard (EGGS), iShares MSCI USA Quality GARP (GARP), Janus Henderson Global Artificial Intelligence (JHAI), and First Trust Nasdaq Lux Digital Health Solutions (EKG). All score in the top decile (90-100) of Sabrient’s Outlook scores.
As always, I welcome your thoughts on this article! Please email me anytime. Any and all feedback is appreciated. Also, please let me know of your interest in any of Sabrient’s new indexes for ETF investing, such as High-Quality Growth, SMID-Cap High-Quality Growth, High-Quality Growth & Income, High-Quality Value, High-Quality Energy, Defensive Equity, Space Exploration & Off-Earth Sustainability, and the actively managed Sabrient Select High-Conviction Portfolio (similar to our Baker’s Dozen portfolio, but larger).
IMPORTANT NOTE: I post this information periodically as a free look inside some of our institutional research and as a source of some trading ideas for your own further investigation. It is not intended to be traded directly as a rules-based strategy in a real money portfolio. I am simply showing what a sector rotation model might suggest if a given portfolio was due for a rebalance, and I do not update the information on a regular schedule or on technical triggers. There are many ways for a client to trade such a strategy, including monthly or quarterly rebalancing, perhaps with interim adjustments to the bullish/neutral/defensive bias when warranted, but not necessarily on the days that I happen to post this article. The enhanced strategy seeks higher returns by employing individual stocks (or stock options) that are also highly ranked, but this introduces greater risks and volatility. I do not track performance of the ideas mentioned here as a managed portfolio.
Disclosure: At the time of this writing, of the securities mentioned, the author held positions in SPY, FTLS, STM, STRL, GEV, gold.
Disclaimer: Opinions expressed are the author’s alone and do not necessarily reflect the views of Sabrient. This newsletter is published solely for informational purposes only. It is neither a solicitation to buy nor an offer to sell securities. It is not intended as investment advice and should not be used as the basis for any investment decision. Individuals should consider their personal financial circumstances in acting on any opinions, commentary, rankings, or stock selections provided by Sabrient Systems. Sabrient makes no representation that the techniques used in its rankings or analyses will result in profits. Trading involves risk, including possible loss of principal and other losses, and past performance is no guarantee of future results. Investment returns will fluctuate, and principal value may either rise or fall. Sabrient disclaims liability for damages of any sort (including lost profits) arising from the use of or inability to use its rankings or analyses. Information contained herein reflects our judgment or interpretation at the time of publication and is subject to change without notice.
Copyright © 2026 Sabrient Systems, LLC. All rights reserved.