Sector Detector: Stocks retrench for another assault on round-number resistance
 “Stocks fall on Fed taper discussion.” That’s the gist of what you heard in the media on Wednesday to account for the market’s late-day pullback. There’s always some sort of attempt to explain daily market action. But the reality is that investors simply must take a periodic breather to regroup and retrench, particularly when making an assault on round-number resistance for a major index. And in this instance, there are multiple indexes encountering such resistance simultaneously, including the S&P 500 at 1800, Dow Jones Industrials at 16,000, and NASDAQ at 4000.
There was an article Wednesday on CNBC.com about short-selling hedge funds seeing the current equity “bubble” as a once-in-a-lifetime short-sale opportunity. They see inflated valuations and P/E multiples as completely out of line and driven solely by the Fed’s quant easing programs, whose days they see as numbered.
No doubt, the trend away from lower-quality companies, i.e., “junk stocks” like Tesla Motors (TSLA), which tend to lead during the speculative phase of bull markets, is starting to give way to more appropriate leadership from higher-quality companies. So, I agree that shorting opportunities should abound going forward. In fact, there already has been a noticeable divergence in the underperformance of small caps, many of which are indeed highly speculative. As the bull run matures and junk stocks become extended, institutional investors (“smart money”) tend to focus more on earnings and fundamentals such that capital shifts away from the lower-quality, high-P/E stocks and into higher-quality companies with strong, steady earnings growth and reasonable multiples.
Nevertheless, I still expect the eagerly anticipated year-end rally to materialize. First of all, the trend is your friend. Second, don’t fight the Fed. (Do those adages sound familiar?) Fed tapering, despite what the media is reading into the Fed minutes, is still a long ways off, particularly given the slowness of the economic recovery and the historically low M1 Multiplier (MULT). Also, the Eurozone is looking more solid every day, and stocks in the PIIGS nations have been performing extremely well. Ireland and Spain have announced that each will soon exit the economic assistance programs. In fact, Ireland’s success with the dreaded austerity path has been quite impressive to witness.
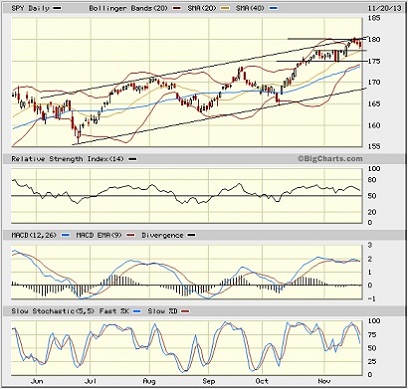
The SPY chart: The SPDR S&P 500 Trust (SPY) closed Wednesday at 178.52, which is right about where it closed last Wednesday and not too far below its all-time intraday high of 180.50 set on Monday. It has continued to enjoy support from its 20-day simple moving average, which has held as strong support during this consolidation period. The long-standing bullish rising channel remains in play, and in fact SPY has pulled back from resistance at the top of the channel as it set its new high, after breaking out of a minor neutral sideways channel last Wednesday. Now it has turned back to test resistance-turned-support from the top of the previous sideways channel around 177.50, which has converged with the 20-day SMA.

Oscillators RSI MACD, and Slow Stochastic have been trying to cycle back down from overbought territory and Slow Stochastic turned back up after a brief attempt to cycle back down, while Bollinger Bands have pinched back together and could be signaling an imminent move in once direction or the other. My guess is that price might need to pull back to near the 50-day SMA and prior support around 175 before making its next push to higher ground.
The CBOE Market Volatility Index (VIX), a.k.a. “fear gauge,” closed Wednesday at 13.39, which is up from last Wednesday but still near its historic lows. Investors remain complacent.
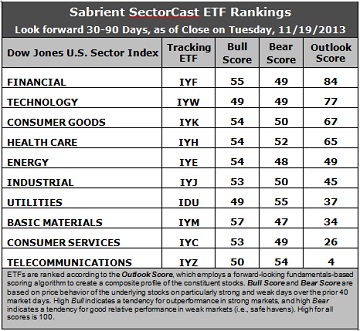
Latest rankings: The table ranks each of the ten U.S. business sector iShares ETFs by Sabrient's proprietary Outlook Score, which employs a forward-looking, fundamentals-based, quantitative algorithm to create a bottom-up composite profile of the constituent stocks within the ETF. The multi-factor model considers forward valuation, historical earnings trends, earnings growth prospects, the dynamics of Wall Street analysts' consensus estimates, accounting practices and earnings quality, and various return ratios. In addition, the table also shows Sabrient's proprietary Bull Score and Bear Score for each ETF.
High Bull score indicates that stocks within the ETF have tended recently toward relative outperformance during particularly strong market periods, while a high Bear score indicates that stocks within the ETF have tended to hold up relatively well during particularly weak market periods. Bull and Bear are backward-looking indicators of recent sentiment trend.
As a group, these three scores can be quite helpful for positioning a portfolio for a given set of anticipated market conditions.

Observations:
1. Financial (IYF) stays at the top spot this week with an Outlook score of 84. IYF displays one of the lowest forward P/Es and excellent sentiment among both Wall Street analysts and company insiders (i.e., open-market buying). Technology (IYW) remains in second place with a score of 77. IYW still displays one of the lowest forward P/Es, one of the strongest long-term forward growth rates, and the best return ratios; however, sentiment among Wall Street analysts and insiders remains poor. In third place with a score of 67 is Consumer Goods (IYK), followed by Healthcare (IYH), which continues to rise primarily due to rapid improvement in sell-side earnings estimates. Energy (IYE) rounds out the top five and sports the lowest forward P/E.
2. Telecom (IYZ) is in the cellar once again with an Outlook score of 4. IYZ scores among the lowest in all factors in the model, including the highest forward P/E, lowest return ratios, a low projected long-term growth rate, and poor sentiment among insiders and Wall Street analysts. Consumer Services (IYC) remains in the bottom two with an Outlook score of 26.
3. This week’s fundamentals-based rankings maintain the mostly bullish bias of last week, with Financial and Tech at the top. The rise of Industrial reflects further bullishness.
4. Looking at the Bull scores, Basic Materials (IYM) has been the leader on particularly strong market days, scoring 57, followed closely by Financial (IYF). Technology (IYW) and Utilities (IDU) score 49. The top-bottom spread is only 8 points, which indicates relatively high sector correlations (all-boats-lifted buying) on particularly strong market days.
5. Looking at the Bear scores, Utilities (IDU) holds the top spot as favorite “safe haven” on weak market days, scoring 55. Materials (IYM) displays the lowest Bear score of 47. The top-bottom spread is only 8 points, which indicates relatively low sector correlations (across-the-board selling) on particularly weak market days.
These Outlook scores represent the view once again that Financial and Technology sectors are still relatively undervalued, while Telecom and Consumer Services may be relatively overvalued based on our 1-3 month forward look.
Some top-ranked stocks that are components of IYF and IYW include MasterCard (MA), Signature Bank (SBNY), CACI International (CACI), and QUALCOMM (QCOM). Each of these ranks highly in the Sabrient Ratings Algorithm, and also scores in the top quintiles of our proprietary Earnings Quality Rank (i.e., they have lower accounting-based risks).
The Earnings Quality Rank (EQR) is a pure accounting-based risk assessment signal co-developed by Sabrient and subsidiary Gradient Analytics, a forensic accounting research firm that evaluates the quality and sustainability of reported earnings. Gradient’s clients, including institutional portfolio managers and analysts, hedge funds, and wealth managers, use it to avoid meltdowns in long positions and to identify short candidates.
The Earnings Quality Rank is a key factor in Sabrient’s “Baker’s Dozen” model. The annual portfolio based on this model is now up +41% since the portfolio’s inception on January 11 through November 13, vs. the S&P 500 return of +21% over the same timeframe. Moreover, all 13 stocks are comfortably positive and 12 are up by double digits, led by Jazz Pharmaceuticals (JAZZ), Genworth Financial (GNW), and Alaska Air Group (ALK). There have been no offsetting meltdowns in the portfolio, and we believe our Earnings Quality Rank is a primary reason.
Note that the next Baker’s Dozen annual portfolio for 2014 will launch on January 13.
Disclosure: Author has no positions in stocks or ETFs mentioned.
About SectorCast: Rankings are based on Sabrient’s SectorCast model, which builds a composite profile of each equity ETF based on bottom-up aggregate scoring of the constituent stocks. The Outlook Score employs a fundamentals-based multi-factor approach considering forward valuation, earnings growth prospects, Wall Street analysts’ consensus revisions, accounting practices, and various return ratios. It has tested to be highly predictive for identifying the best (most undervalued) and worst (most overvalued) sectors, with a 1-3 month forward look.
Bull Score and Bear Score are based on the price behavior of the underlying stocks on particularly strong and weak days during the prior 40 market days. They reflect investor sentiment toward the stocks (on a relative basis) as either aggressive plays or safe havens. So, a high Bull score indicates that stocks within the ETF have tended recently toward relative outperformance during particularly strong market periods, while a high Bear score indicates that stocks within the ETF have tended to hold up relatively well during particularly weak market periods.
Thus, ETFs with high Bull scores generally perform better when the market is hot, ETFs with high Bear scores generally perform better when the market is weak, and ETFs with high Outlook scores generally perform well over time in various market conditions.
Of course, each ETF has a unique set of constituent stocks, so the sectors represented will score differently depending upon which set of ETFs is used. For Sector Detector, I use ten iShares ETFs representing the major U.S. business sectors.
About Trading Strategies: There are various ways to trade these rankings. First, you might run a sector rotation strategy in which you buy long the top 2-4 ETFs from SectorCast-ETF, rebalancing either on a fixed schedule (e.g., monthly or quarterly) or when the rankings change significantly. Another alternative is to enhance a position in the SPDR Trust exchange-traded fund (SPY) depending upon your market bias. If you are bullish on the broad market, you can go long the SPY and enhance it with additional long positions in the top-ranked sector ETFs. Conversely, if you are bearish and short (or buy puts on) the SPY, you could also consider shorting the two lowest-ranked sector ETFs to enhance your short bias.
However, if you prefer not to bet on market direction, you could try a market-neutral, long/short trade—that is, go long (or buy call options on) the top-ranked ETFs and short (or buy put options on) the lowest-ranked ETFs. And here’s a more aggressive strategy to consider: You might trade some of the highest and lowest ranked stocks from within those top and bottom-ranked ETFs.
