
by Scott Martindale
CEO, Sabrient Systems LLC
Overview
Last year nearly brought a third straight 20+% total return for the S&P 500, but alas it fell just short. Looking ahead, the ducks seem to be lining up for more upside in 2026, although leadership should see some rotation. I believe the tailwinds far outweigh the headwinds, and investors seem to be positioning for a strong year for both GDP growth and stocks on continued AI optimism, robust/aggressive capex (led by the MAG7) for AI infrastructure as well as onshoring of strategic manufacturing, looser Fed monetary policy, rising global liquidity, full enactment of the One Big Beautiful Bill Act (OBBBA), tax and interest rate cuts, smaller government, deregulation, re-privatization, re-industrialization, and a potential “peace dividend.”
This should continue to attract foreign capital into the US (“shadow liquidity,” much of which is not counted in M2), cut the deficit-to-GDP ratio, and unleash organic private sector growth, with stock valuations driven by rising earnings rather than multiple expansion. Indeed, January is off to a hot start, led by small caps, and the January Barometer would suggest another solidly positive year for stocks (when the first five trading days of the year are positive, the S&P 500 has historically finished the year higher 85% of the time with an average gain of +15%).
However! This is no guarantee that the S&P 500 necessarily ends the year higher. Valuations on the broad indexes remain stretched (some might say “priced for perfection”), so a lot must go right in a year littered with landmines. Not the least of which, while global liquidity is still rising, its growth rate is slowing—although this is partially offset by rising velocity of money (transactions per dollar in circulation), which in the US is at its highest level since Q4 2019. Furthermore, uncertainties persist regarding trade deals and tariffs, the intractable Ukraine/Russia war, Venezuela invasion and upheaval in Iran (both of which impact China, Russia, and oil markets broadly) rising federal debt, civil strife in US cities, political polarization, midterm elections, Fed policy uncertainty, a weak jobs market, signs of consumer distress, and a government shutdown redux threat.
Nevertheless, stock and bond market volatility remains subdued, forecasts for GDP growth and corporate earnings growth are strong (as the private sector retakes its rightful place as the primary engine of growth, with much more efficient capital allocation and ROI than government), and credit spreads remain near historic lows. In fact, the Financial Times reports that in the first full week of January, corporations secured more than $95 billion in 55 IG bond deals, making it the busiest start to a year on record. Real GDP in Q3 2025 came in at 4.3% annualized growth, and for Q4 2025, the AtlantaFed GDPNow is projecting a whopping 5.3% (!) as of 1/14/26 (yes, that’s a real not nominal number). For Q1 2026, the OBBBA is now fully kicking in.
In addition, the New York Fed’s Global Supply Chain Pressure Index (GSCPI) continues to hover at or below the zero line (i.e., its historical average) and disinflationary trends have resumed, such as the buildout and implementation of Gen AI, automation, and robotics, rising productivity (Q3 2025 came in at a whopping 4.9% growth), falling shelter and energy costs, peace deals (war is inflationary), a deflationary impulse on the world from China (due to its domestic struggles and falling consumer demand), low inflation in Europe (hitting the ECB’s 2% target), increased domestic productive capacity (i.e., “duplicative excess capacity,” in the words of Treasury Secretary Scott Bessent), and a firmer dollar. Also, money market funds (aka cash on the sidelines or “fuel”) now exceed $8 trillion, the highest ever.
Valuations for the broad market indexes have pulled back from their extreme highs but remain elevated, with the forward P/E on the S&P 500 finishing the year at 22.9x and the Nasdaq 100 at 26.3x. DataTrek Research observed that the S&P 500 P/E multiple has increased by +4.2% over the course of the year while the price index gained +16.4%, so the difference of 12.2% is primarily due to rising earnings growth expectations, with analysts now expecting 15% earnings growth for the S&P 500, which would be the highest annual growth rate since 2021. Moreover, the firm observed that the Technology and Financials sectors in particular saw their forward P/E multiples decline while beating earnings growth estimates and performing well. They conclude, “One need not argue for ever-higher PE multiples to be bullish on US large caps. A strong earnings story is more than enough to support an optimistic view.” And it’s not just equities reflecting investor optimism as corporate bond spreads ended the year near historical lows.
It’s been several years of relentless headwinds for small caps, but the fiscal and monetary policy setup is finally looking sufficiently supportive for a mean reversion/catchup. Favorable tax policies, less red tape, cooling inflation, a less aggressive if not yet friendly Fed, and improving credit conditions (including lower rates and tight credit spreads) all bode well especially for small caps, particularly given their domestic focus, higher debt levels, and interest rate sensitivity (with about 65% of their debt being floating rate versus 15% for large caps). According to Oren Shiran of Lazard Asset Management, "The big difference going into 2026 is that we finally are seeing earnings growth come back into small caps."
However, here are some words of caution. While it is historically common for the second year of a presidential term to show strong earnings growth, we may well see some consolidation of gains and rotation into value and cyclical sectors like Industrials and Financials, as well as fields like biotech/biopharma that are successfully leveraging AI for discovery and innovation. But whether the broad indexes finish solidly positive this year may depend upon: 1) liquidity growth, 2) the relative strength of the dollar, 3) the steepness of the yield curve (could the 2-10 spread rise above 100 bps?), 4) the status and outlook on capex for AI and onshoring, and 5) the midterm elections and whether Republicans retain the House.
After the S&P 500’s terrific bull run over the past three years in which the MAG7 accounted for roughly 75% of the index’s total return, I think this year might see the equal-weight RSP outperform the cap-weight SPY, with the SPY gaining perhaps only single-digit percentage. This scenario also might favor strategic beta and active management. So, rather than the broad passive indexes (which are dominated by growth stocks, Big Tech, and the AI hyperscalers), I think 2026 should be a good year for active stock selection, small caps, and bond-alternative dividend payers—which bodes well for Sabrient’s Baker’s Dozen, Forward Looking Value, Small Cap Growth, and Dividend portfolios.
According to economist Michael Howell of CrossBorder Capital, this stage of the liquidity cycle (slowing liquidity growth) is correlated with falling bond term premia and flattening yield curve—which means Treasury notes and bonds may perform well later in the year. Indeed, given where we are with stability in real interest rates and inflation expectations, bonds seem ready to return to their historical role as a portfolio diversifier. Notably, there is record level of short positioning in the 20+ Year Treasury Bonds ETF (TLT) entering the new year, and as Mark Hulbert for MarketWatch opined, “Contrarian investors now believe bonds may outperform both stocks and gold because sentiment toward bonds is unusually pessimistic while optimism for stocks and gold is near historical highs, and history shows markets often rally after extreme pessimism and struggle after peak optimism, suggesting bonds could be a better bet in the months ahead despite strong 2025 performance in stocks and gold.”
In addition, this may favor dividend payers, and industrial metals (like copper, aluminum, cobalt, lithium, platinum, palladium), as well as gold, silver, and bitcoin as hedges against monetary inflation. (This is distinct from CPI and is caused by governments “printing money” to monetize their debt—not to fund new spending but to reduce debt service costs and the debt/GDP ratio.) I also think natural gas and energy stocks could perk up this year.
I go much further into all of this in my full post below, including a review of 2025 relative performance of asset classes, caps, and styles; current valuations, the AI bubble narrative, corporate earnings, GDP, jobs, inflation, and Fed policy. Overall, my recommendation to investors remains this: Don’t chase the highflyers and instead focus on high-quality businesses at reasonable prices, hold inflation and dollar hedges like gold, silver, and bitcoin and be prepared to exploit any market pullbacks—such as by buying out-of-the-money protective put options in advance while VIX is low and then accumulating those high-quality stocks as they rebound, fueled by massive capex in AI, blockchain, infrastructure, energy, and factory onshoring, leading to rising productivity, increased productive capacity (“duplicative excess capacity,” in the words of Treasury Secretary nominee Scott Bessent, would be disinflationary), and economic expansion.
And regarding “high-quality businesses,” I mean fundamentally strong, displaying a history of consistent, reliable, resilient, durable, and accelerating sales and earnings growth, positive revisions to Wall Street analysts’ consensus estimates and a history of meeting/beating estimates, rising profit margins and free cash flow, high capital efficiency (e.g., ROI), solid earnings quality and conservative accounting practices, a strong balance sheet, low debt burden, competitive advantage, and a reasonable valuation compared to its peers and its own history.
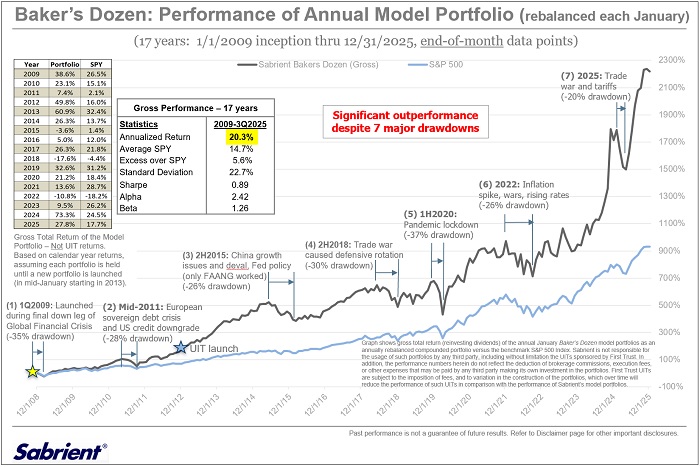
These are the factors Sabrient employs in our quantitative models and portfolio selection process. As former engineers, we use the scientific method and hypothesis-testing to build models that make sense. We are best known for our Baker’s Dozen growth portfolio of 13 diverse picks, which is designed to offer the potential for outsized gains. We have been tracking a Baker’s Dozen Annual Model Portfolio, rebalanced each January since 2009 (during the final stages of the Global Financial Crisis when I first proposed the idea of publishing an annual “Top Picks” list). In mid-January 2013, it began to be packaged and distributed to the financial advisor community as a unit investment trust (UIT) by First Trust Portfolios—along with three other offshoot strategies for value, dividend, and small cap themes—and today it is issued quarterly as a 15-month UIT. In fact, the new Q1 2026 Baker’s Dozen portfolio will launch on 1/20/2026. Until then, the Q4 2025 portfolio remains in primary market.
Below is the 17-year chart comparing the theoretical gross total return of the annual model portfolio versus the S&P 500 from 2009 through 2025. As shown in the table, it reflects an average annual gross total return of +20.3% versus +14.7% for SPY. For calendar year 2025, the Model Portfolio was up +27.8% vs. +17.7% for SPY, following a 2024 gross total return of +73.3% vs. +24.5% for SPY.
Also, because small caps tend to benefit most from lower rates and deregulation, and high dividend payers become more appealing as bond alternatives as interest rates fall, Sabrient’s quarterly Small Cap Growth and Sabrient Dividend (a growth & income strategy) might be timely investments. And notably, our Earnings Quality Rank (EQR) is a key factor in each of our strategies, and it is also licensed to the actively managed, low-beta First Trust Long-Short ETF (FTLS) as a quality prescreen.
Sabrient founder David Brown reveals the primary financial factors used in our models and his portfolio construction process in his latest book, Moon Rocks to Power Stocks: Proven Stock Picking Method Revealed by NASA Scientist Turned Portfolio Manager, which is available on Amazon (Kindle or paperback) for investors of any experience level. David describes his path from NASA engineer in the Apollo Program to creating quantitative multifactor models for ranking stocks and building stock portfolios for four distinct investing styles—growth, value, dividend, or small cap.
Here is a link to this post in printable PDF format, as well as my latest Baker’s Dozen presentation slide deck and my 3-part series on “The Future of Energy, the Lifeblood of an Economy.” As always, I’d love to hear from you! Please feel free to email me your thoughts on this article or if you’d like me to speak on any of these topics at your event! Read on….

 by Scott Martindale
 by Scott Martindale