by Scott Martindale
CEO, Sabrient Systems LLC
Overview
So much for the adage, “Sell in May and go away.” May was the best month for the stock market since November 2023 and the best month of May for the stock market in 35 years, with the S&P 500 up +6.1% and Nasdaq 100 up +9.3%. Moreover, the S&P 500 has risen more than 1,000 points (20%) from its 4/8 low and is back into positive territory YTD (and challenging the 6,000 level). History says when stocks rally so strongly off a low, the 12-month returns tend to be quite good. Even better news is that the rally has been broad-based, with the equal-weight versions of the indexes performing in line with the cap-weights, and with the advance/decline lines hitting all-time highs. An as Warren Pies of 3Fourteen Research observed on X.com, “…the S&P 500 has retraced 84% of its peak-to-trough decline. The [market] has never retraced this much of a bear market and subsequently revisited the lows. The technical evidence points, overwhelmingly, to the beginning of another leg to the bull market and new ATHs.” We certainly aren’t seeing the H1 volatility I expected, with the CBOE Volatility Index (VIX) back down to February levels. So, is this the all-clear signal for stocks? Well, let’s explore this a bit.
As Josh Brown of Ritholtz Wealth Management reminds us, “Stocks [tend to] bottom in price a full 9 months before earnings do… By the time earnings are reaching their cycle low, stocks have already been rallying for three quarters of a year in advance of that low. This is why you don’t wait to get invested or attempt to sit out the economic or earnings downturns.” Typically, the growth rates for GDP, corporate earnings, wages, and stock prices should not stray too far apart since they are all closely linked to a strong economy. And as of 6/9, the Atlanta Fed’s GDPNow model indicates an eye-popping +3.8% growth is in store for Q2 (albeit largely due to a collapse in imports following the negative Q1 print from front-running of imports, ahead of the tariffs).
And with the last administration’s last-minute surge in deficit spending wearing off, the new administration is doing quite well in bringing down inflation, starting with oil prices. Indeed, April CPI came in at +2.33% YoY and the rolling 3-month annualized CPI (a better measure of the current trend) is +1.56%. Looking ahead, the Cleveland Fed’s Inflation NowCasting model forecasts May CPI of +2.40% YoY and an annualized Q2 CPI of +1.70%, while the real-time, blockchain-based Truflation metric is +1.90% (as of 6/9). After all, disruptive innovation like AI is deflationary by increasing productivity, China’s economic woes are deflationary (cheaper goods), and tariffs are deflationary (in the absence of commensurate rise in income), so the rising GDP forecast and falling CPI numbers reflect the exact oppositive of the “stagflation” scare the MSM keeps trumpeting. I discuss inflation in greater length in today’s post below.
It all sounds quite encouraging, right? Well, not so fast. For starters, the charts look severely overbought with ominous negative divergences that could retrace a lot of gains. Moreover, with ISM manufacturing and services indexes both in contraction, with so much lingering uncertainty around trade negotiations, with President Trump’s “one big, beautiful bill” (aka OBBB) wending a treacherous path through congress, and with his ambitious drive to reverse the course and negative outcomes of decades of hyper-globalization, entitlement creep, and climate/cultural activism facing fierce resistance both at home and abroad, the coast is hardly clear.
Witness the rise in bond term premiums even as the Fed contemplates cutting its benchmark rate as foreign central banks and bond vigilantes slash demand for Treasuries (or even sell them short) due to expectations of unbridled federal debt and Treasury issuance. According to Mike Wilson of Morgan Stanley: “we identified 4%-4.5% [10-year yield] as the sweet spot for equity multiples, provided that growth and earnings stay on track.” Similarly, Goldman Sachs sees 4.5% acting as a ceiling for stock valuations—and that is precisely where the rate closed on Friday 6/6. Wilson identified four factors that he believes would sustain market strength: 1) a trade deal with China, 2) stabilizing earnings revisions, 3) a more dovish Fed (i.e., rate cuts), and 4) the 10-year yield below 4% (without being driven by recessionary data)—but there has been observable progress only in the first two.
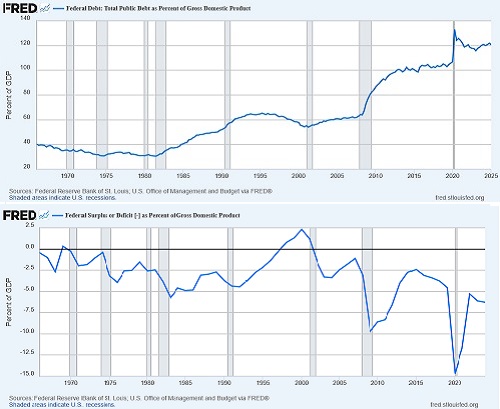
Regarding our debt & deficit death spiral, I will argue in my full commentary below that despite all the uproar, the OBBB might not need to institute harsh austerity with further cuts to entitlements (which, along with interest on the debt, amount to 73% of spending) that would mostly hurt the middle/working classes. The bill rightly repeals low-ROI tax credits and spending for boondoggles from prior bills, most notably low-transformity/low-reliability wind and solar energy projects that require government subsidies to be economically viable. But beyond that, the focus should be on lowering the debt/GDP ratio through fiscal and monetary policies that foster robust organic economic growth (the denominator) led by an unleashed private sector fueled by tax rate cuts and incentives for capital investment, deregulation, disruptive innovation, and high-transformity/high-reliability natural gas and next-generation nuclear technology. Real Investment Advice agrees, arguing that market pundits might be “too focused on the deficit amount…rather than our ability to pay for it, i.e., economic growth.” The charts below show the debt-to-GDP ratio, which is about 120% today, alongside the federal deficit-to-GDP ratio, which is about 6.6% today. (Note that US Treasury Secretary Scott Bessent’s target of 3% deficit-to-GDP was last seen in 2016.)
Of course, nothing is all bad or all good. But Trump is shining a bright light on the devastating fallout on our national security, strategic supply chains, and middle/working classes. Changing the pace and direction of globalization, including deglobalizing some supply chains, reshoring strategic manufacturing, and focusing on low-cost energy solutions for a power-hungry world cannot occur without significant disruption. Within the US, we can have different states provide different types of industries and services depending upon their comparative advantages like natural resources, labor costs, demographics, geography, etc.—after all, we are all part of one country. But on a global scale, with some key trading partners that might be better considered rivals, or even enemies in some cases, we can’t entrust our national security to the goodwill and mutual benefit of international trade. Indeed, China has a history of not fulfilling its commitments in prior trade agreements, like reducing state subsidies overproduction (“dumping”), and IP theft, moving some manufacturing into the US, and increasing imports of US goods.
I have talked often about the 3-pronged approach of addressing our federal debt by: 1) inflating it away with slightly elevated inflation around 2.4% to erode the value of dollars owed and increase nominal GDP to reduce the debt-to-GDP ratio, 2) cutting it away with modest reductions or at least freezes on spending and entitlements, and 3) growing it away by fostering robust organic growth from a vibrant private sector with pro-cyclical fiscal and monetary policies that ultimately grows tax receipts on higher income and GDP (even at lower tax rates) and reduces the debt-to-GDP ratio. But of these three, the big “clean-up hitter” must be #3—robust growth. In fact, a key reason that the OBBB does not propose more austerity measures (i.e., spending cuts beyond waste, fraud, and the “peace dividend”) is to ensure that GDP grows faster than the debt and deficit. We can only live with slightly elevated inflation, and it is difficult to cut much spending given the dominance of mandatory spending (entitlements and interest payments) over discretionary spending. So, the primary driver must be robust private sector organic growth—and by extension an embrace of disruptive innovation and a productivity growth boom that boosts real GDP growth, keeps a lid on inflation, widens profit margins—leading to rising wages tax remittances.
As a case in point, I highly recommend a recent episode of the All-In Podcast in which the panel of four Tech billionaires (of various political persuasions) speak with Miami Mayor Francis Suarez. In 2017, Suarez took over leadership of a city that was in distress, near bankruptcy, and a murder capital of the country, and he resurrected it with three core principles for success: “keep taxes low, keep people safe, lean into innovation”—whereas he laments that most other big-city mayors prefer to do the opposite, i.e., raise taxes, tolerate crime, create suffocating regulations, and reject the offers and entreaties of billionaire entrepreneurs like Jeff Bezos (Amazon) and Elon Musk (Tesla) as overly disruptive or politically incorrect.
May inflation metrics will come out this week, and then the June FOMC meeting convenes 6/17-18. So far, the FOMC has been quite happy to just sit on its hands (while the ECB just cut for an 8th time) in the face of tariff paralysis; falling oil prices, unit labor costs, and New Tenant Rents; declining inflation and savings rates; rising delinquencies; and slowing jobs growth; instead preferring to be reactive to sudden distress rather than proactive in preventing such distress. Inflation metrics continue to pull back after being propped up by elevated energy prices, long-lag shelter costs, and the prior administration’s profligate federal deficit spending that overshadowed—and indeed created—sluggish growth in the private sector. Economist Michael Howell of CrossBorder Capital persuasively asserts that monetary policy “must prioritize liquidity over inflation concerns, so the Fed’s current hands-off, higher-for-longer, reactionary approach risks causing a liquidity crunch.”
So, I believe it’s going to be hard for Fed Chair Jay Powell to justify continuing to “wait & watch.” As of 6/9, CME Group fed funds futures show zero odds of a 25-bp rate cut this month, but increases to 17% at the July meeting, and 64% odds of at least 50 bps by year-end. I have been insisting for some time that the FFR needs to be 100 bps lower, as the US economy's headline GDP and jobs numbers were long artificially propped up by excessive, inefficient, and often unproductive federal deficit spending, while the hamstrung private sector has seen sluggish growth, and 30-year mortgage rates need to be closer to 5% to allow the housing market to function properly. But regardless of the FOMC decision this month, I expect the rate-cutting cycle to restart soon and signed trade deals to emerge with our 18 key trading partners, calming domestic and foreign investors.
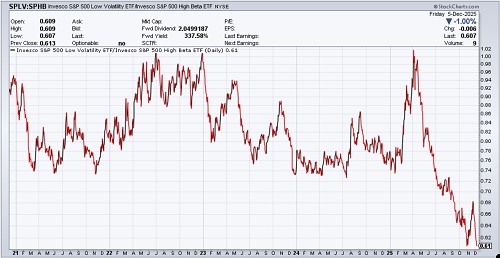
I still expect new highs in stocks by year end. For now, traders might wait for a pullback and bounce from support levels, or perhaps an upside breakout beyond the 6,000 level on the S&P 500. But my suggestion to investors remains this: Don’t chase the highflyers and instead focus on high-quality businesses at reasonable prices, expect elevated volatility given the uncertainty of the new administration’s policies and impact, and be prepared to exploit any market pullbacks by accumulating those high-quality stocks in anticipation of gains by year end and beyond, fueled by the massive and relentless capital investment in blockchain and AI applications, infrastructure, and energy, leading to rising productivity, increased productive capacity (or “duplicative excess capacity,” in the words of Secretary Bessent, which would be disinflationary), and economic expansion, as I explore in greater depth in my full post below.
Rather than investing in the passive cap-weighted indexes dominated by Big Tech, investors may be better served by active stock selection that seeks to identify under-the-radar, undervalued, high-quality gems. This is what Sabrient seeks to do in our various portfolios, all of which provide exposure to Value, Quality, Growth, and Size factors and to both secular and cyclical growth trends. When I say, “high-quality company,” I mean one that is fundamentally strong, displaying a history of consistent, reliable, and accelerating sales and earnings growth, a history of meeting/beating estimates, high capital efficiency, rising profit margins and free cash flow, solid earnings quality, low debt burden, and a reasonable valuation compared to its peers and its own history. These are the factors Sabrient employs in selecting our Baker’s Dozen, Forward Looking Value, Dividend, and Small Cap Growth portfolios (which are packaged and distributed as UITs by First Trust Portfolios). We also use many of those factors in our SectorCast ETF ranking model, and notably, our proprietary Earnings Quality Rank (EQR) is a key factor used in each of our portfolios, and it is also licensed to the actively managed First Trust Long-Short ETF (FTLS) as a quality prescreen.
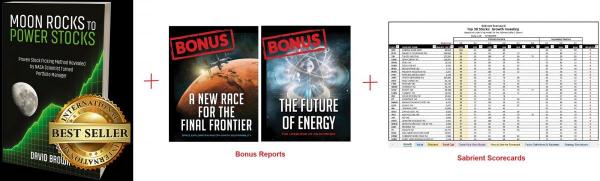
Sabrient founder David Brown describes these and other factors as well as his portfolio construction process in his latest book. He also describes his path from NASA scientist in the Apollo moon landing program to creating quant models for ranking stocks and building stock portfolios. And as a companion product to the book, we have launched our next-generation Sabrient Scorecards for Stocks and ETFs, which are powerful digital tools that rank stocks and ETFs using our proprietary factors. You can learn more about both the book and scorecards by visiting: http://HighPerformanceStockPortfolios.com.
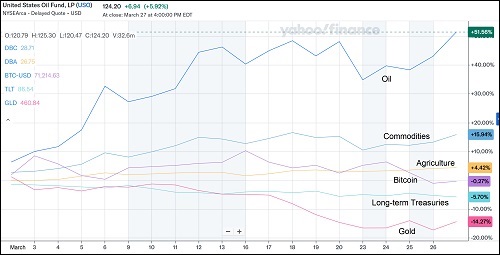
Keep in mind, stock market tops rarely happen when investors are cautious, as they continue to be today. So, I continue to believe in staying invested in stocks but also in gold, gold royalty companies, Bitcoin (as an alternative store of value), and perhaps Ethereum (for its expanding use case). These not only serve as hedges against dollar debasement but as core holdings within a strategically diversified portfolio. Bitcoin’s climb back to new highs in May has been much more methodical and disciplined than its previous history of maniacal FOMO momentum surges that were always destined to retrace. This is what comes from maturity and broader institutional acceptance, characterized by “stickier” holders and strategic allocations. Notably, iShares Bitcoin Trust ETF (IBIT) had its largest-ever monthly inflow during May.
I highly encourage you to read my full commentary below. I discuss in greater depth the economic metrics, the truth about the OBBB, deglobalization, trade wars, affordable energy, economic growth, jobs, inflation, and global liquidity. I also discuss Sabrient’s latest fundamental-based SectorCast quantitative rankings of the ten U.S. business sectors, current positioning of our sector rotation model, and several top-ranked ETF ideas. Click HERE for a link to this post in printable PDF format.
By the way, rather than including my in-depth discussion of energy and electrical power generation in this post, I will be releasing it in a special report a little later this month, so please watch for it. As always, please let me know your thoughts on this article, and feel free to contact me about speaking on any of these topics at your event! Read on….