Sector Detector: Convergence of negative events depresses sentiment and valuations but provides new buying opportunity
 by Scott Martindale
President & CEO, Sabrient Systems LLC
Needless to say, investors have been piling out of stocks and bonds and into cash. So much for the 60/40 portfolio approach that expects bonds to hold up when stocks sell off. In fact, few assets have escaped unscathed, leaving the US dollar as the undisputed safe haven in uncertain times like these, along with hard assets like real estate, oil, and commodities. Gold was looking great in early-March but has returned to the flatline YTD. Even cryptocurrencies have tumbled, showing that they are still too early in adoption to serve as an effective “store of value”; instead, they are still leveraged, speculative risk assets that have become highly correlated with aggressive growth stocks.
From its record high in early January to Thursday’s intraday low, the S&P 500 (SPY) was down -19.9% (representing more than $7.5 trillion in value). At its lows on Thursday, the Nasdaq 100 (QQQ) was down as much as -29.2% from its November high. Both SPY and QQQ are now struggling to regain critical “round-number” support at 400 and 300, respectively. The CBOE Volatility Index (VIX) further illustrates the bearishness. After hitting 36.6 on May 2, which is two standard deviations above the low-run average of 20 (i.e., Z-score of 2.0), VIX stayed in the 30’s all last week, which reflects a level of panic. This broad retreat from all asset classes has been driven by fear of loss, capital preservation, deleveraging/margin calls among institutional traders, and the appeal of a strong dollar (which hit a 20-year high last week). The move to cash caused bond yields to soar and P/E ratios to crater. Also, there has been a striking preference for dividend-paying stocks over bonds.
It appears I underestimated the potential for market carnage, having expected that the March lows would hold as support and the “taper tantrum” surge in bond yields would soon top out once the 10-year yield rose much above 2%, due to a combination of US dollar strength as the global safe haven, lower comparable rates in most developed markets, moderating inflation, leverage and “financialization” of the global economy, and regulatory or investor mandates for holding “cash or cash equivalents.” There are some signs that surging yields and the stock/bond correlation may be petering out, as last week was characterized by stock/bond divergence. After spiking as high as 3.16% last Monday, the 10-year yield fell back to close Thursday at 2.82% (i.e., bonds attracted capital) while stocks continued to sell off, and then Friday was the opposite, as capital rolled out of bonds into stocks.
Although nominal yields may be finally ready to recede a bit, real yields (net of inflation) are still solidly negative. Although inflation may be peaking, the moderation I have expected has not commenced – at least not yet – as supply chains have been slow to mend given new challenges from escalation in Russian’s war on Ukraine, China’s growth slowdown and prolonged zero-tolerance COVID lockdowns in important manufacturing cities, and various other hindrances. Indeed, the risks to my expectations that I outlined in earlier blog posts and in my Baker’s Dozen slide deck have largely come to pass, as I discuss in this post.
Nevertheless, I still expect a sequence of events over the coming months as follows: more hawkish Fed rhetoric and some tightening actions, modest demand destruction, a temporary economic slowdown, and more stock market volatility … followed by mending supply chains, some catch-up of supply to slowing demand, moderating inflationary pressures, bonds continuing to find buyers (and yields falling), and a dovish turn from the Fed – plus (if necessary) a return of the “Fed put” to support markets. Time will tell. Too bad the Fed can’t turn its printing press into a 3D printer and start printing supply chain parts, semiconductors, oil, commodities, fertilizers, and all the other goods in short supply – that would be far more helpful than the limited tools they have at hand.
Although both consumer and investor sentiment are quite weak (as I discuss below), and there has been no sustained dip-buying since March, history tells us bear markets do not start when everyone is already bearish, so perhaps Friday’s strong rally is the start of something better. Perhaps the near -20% decline in the S&P 500 is all it took to wring out the excesses, with Thursday closing at a forward P/E of 16.8x ahead of Friday’s rally, which is the lowest since April 2020. So, the S&P 500 is trading at a steep 22% discount compared to 21.7x at the start of the year, a 5-year average of 18.6x, and a 20-year post-Internet-bubble average of 15.5x (according to FactSet), Moreover, the Invesco S&P 500 Equal Weight (RSP) is at 15.0x compared to 17.7x at the beginning of the year, and the S&P 600 small cap forward P/E fell to just 11.6x (versus 15.2x at start of the year).
But from an equity risk premium standpoint, which measures the spread between equity earnings yields and long-term bond yields, stock valuations have actually worsened relative to bonds. So, although this may well be a great buying opportunity, especially given the solid earnings growth outlook, the big wildcards for stocks are whether current estimates are too optimistic and whether bond yields continue to recede (or at least hold steady).
Recall Christmas Eve of 2018, when the market capitulated to peak-to-trough selloff of -19.7% – again, just shy of the 20% bear market threshold – before recovering in dazzling fashion. The drivers today are not the same, so it’s not necessarily and indicator of what comes next. Regardless, you should be prepared for continued volatility ahead.
In this periodic update, I provide a comprehensive market commentary, offer my technical analysis of the S&P 500 chart, review Sabrient’s latest fundamentals based SectorCast quant rankings of the ten US business sectors, and serve up some actionable ETF trading ideas. To summarize, our SectorCast rankings reflect a bullish bias, with 5 of the top 6 scorers being cyclical sectors, Energy, Basic Materials, Financials, Industrials, and Technology. In addition, the near-term technical picture looks bullish for at least a solid bounce, if not more (although the mid-to-long-term is still murky, subject to news developments), but our sector rotation model switched to a defensive posture last month when technical conditions weakened.
Regardless, Sabrient’s Baker’s Dozen, Dividend, and Small Cap Growth portfolios leverage our enhanced Growth at a Reasonable Price (GARP) selection approach (which combines Quality, Value, and Growth factors) to provide exposure to both the longer-term secular growth trends and the shorter-term cyclical growth and value-based opportunities – without sacrificing strong performance potential. Sabrient’s latest Q2 2022 Baker’s Dozen launched on 4/20/2022 and is off to a good start versus the benchmark, led by three Energy firms, with a diverse mix across market caps and industries. In addition, the live Dividend and Small Cap Growth portfolios have performed quite well relative to their benchmarks. Read on....
Commentary:
The S&P 500 has now fallen six straight weeks and finds itself in its second-longest correction since the global financial crisis and its worst start to a calendar year since 1932. And that’s not the worst of it, as both the Nasdaq Composite and Russell 2000 small cap index have given up all their 2021 gains. The Nasdaq’s -29% fall from its November record high happened more quickly than its fall in 2000 the start of the bursting dot-com bubble. Moreover, according to Bloomberg, $10.5 billion was withdrawn from ETFs in April, which ended a 34-month streak of ETF inflows totaling $1.8 trillion. May seems to be following suit.
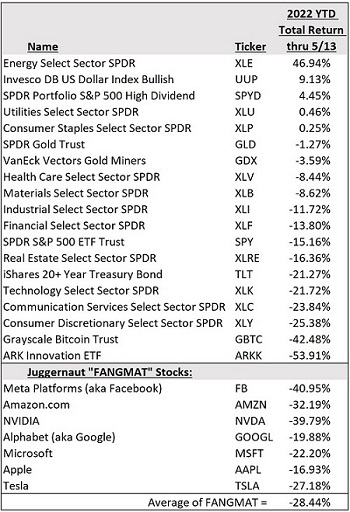
To get further indication of the erosion in bullish optimism, look at how far the speculative, high-P/E, aggressive-growth darlings have fallen. The ARK Innovation ETF (ARKK), which holds many such stocks like Tesla (TSLA), Roku (ROKU), Teledoc (TDOC), Square (SQ), Zoom Video (ZM), Spotify (SPOT), Coinbase (COIN), and Unity Software (U), plummeted as much as -77% from its all-time high in February 2021 (a scant 15 months ago). Even the invincible and all-weather “FANGMAT” juggernauts that dominate the passive, cap-weighted, broad-market indexes and are so widely loved and institutionally owned – i.e., Facebook (FB), Apple (AAPL), NVIDIA (NVDA), Google (GOOG), Microsoft (MSFT), Amazon.com (AMZN), and TSLA – have taken it on the chin, which I believe is yet another sign of investor capitulation. The table below illustrates via representative ETFs the broad weakness in stocks, bonds, bitcoin, and gold, as only Energy (i.e., oil & gas, due to surging oil prices), the US dollar, and strong dividend-paying stocks have provided positive returns so far this year. [By the way, the original “N” in the old FAANG acronym, Netflix (NFLX), is down -69% YTD.]
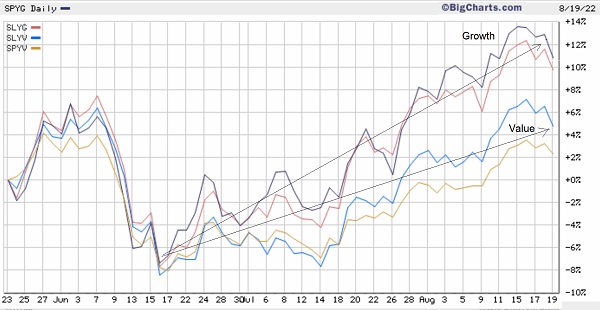
As for the Value/Growth performance differential this year, the chart below is illustrative. After watching the Growth factor greatly outperform over the past several years, with brief attempts at mean reversion by Value, this year has seen a dramatic and persistent outperformance in Value (and the Quality factor, as well). Notably, Sabrient’s growth-at-a-reasonable-price (GARP) approach is biased toward Value and Quality in a quest to find under-the-radar investment opportunities among both cyclical and secular growth companies.
A convergence of negative events:
We are enduring a rare convergence of negative events, including high oil prices, the first war in Europe since WWII, widespread sanctions on Russian energy, ongoing COVID lockdowns in China (including important manufacturing centers like Shanghai), hobbled supply chains, soaring inflation, a hawkish Fed, rising interest rates, GDP contraction, high stock valuations, and a frenzied housing market characterized by high demand, short supply, and cash-flush private equity firms gobbling up rental properties. It’s like we combined all the various issues we faced in previous recessions/market corrections in the mid-1970s (Arab oil embargo and end of gold standard), early-2000s (Internet bubble burst), mid-2000s (Great Financial Crisis), and 2020 (COVID pandemic and lockdowns).
Similarly, the risks that I have cited to my generally positive expectations for the market included: global recession from COVID lockdowns and slowing growth in China and the prolonged war in Ukraine; a persistent rise in inflation (due to ongoing supply disruptions) that makes the Fed turn overly hawkish; corporate earnings growth falling short of justifying elevated valuations; and escalation in global financial, technological, and military conflicts (including economic sanctions, challenges to the dollar’s reserve currency status, deglobalization, cyberwarfare, missile tests, nuclear saber-rattling, etc.). Indeed, all these risks have come to fruition to varying extents, with outsized impact on supply chains, inflation, US and global economies, and corporate earnings. In fact, US support of Ukraine has stymied Russia’s advance to such an extent that Putin has doubled down on his conviction to win at all costs, which is prolonging and worsening the misery. Emboldened by Ukraine’s surprising resilience against Russian firepower, some of our US political leaders are now encouraging further escalation by claiming we are “in it to win it,” targeting total Ukrainian victory over Russia … or at least a significant weakening of Russia’s military capabilities (with Ukraine as the sacrificial lamb). But that is a topic for another day.
In any case, investors don’t like it. According to the latest weekly American Association of Individual Investors survey (as of 5/11/2022), the percentage of stock investors who are bullish is at 24.3%, which is down from 26.9% the prior week but higher than 16.4% the week before that (4/27/2022). Bullish sentiment remains below its historical average of 38.0% for the 25th consecutive week, and “at an unusually low level” (as described by AAII) for 15 of the last 18 weeks. Notably, readings below 20% are historically rare, and in almost every previous instance, stocks rallied hard over the ensuing 6 and 12 months.
Also, the University of Michigan Consumer Sentiment Index preliminary estimate for May dropped to 59.1 (versus 65.2 in April, 59.4 in March, and 82.9 last May 2021). It is the lowest reading since August 2011 and among the lowest on record (since the index launched in 1977). It was notably broad-based across income, age, education, geography, and political affiliation. A recent study identified six times in history where consumer confidence dropped to ultra-low levels (below 65), and in each instance, stocks rallied over the ensuing 12 months with an average gain of 24%. There has been only a couple of tepid attempts at dip-buying since the end-of-March highs, which confirms bearish sentiment.
GDP, earnings, inflation, and Fed policy:
Although the BEA’s first estimate of Q1 GDP growth showed contraction of -1.4%, which badly missed estimates, it was primarily driven by a widening trade deficit, with lower government spending, exports, and inventories, while consumer, business, and residential investment remained strong. So, demand remains strong among consumers and businesses – which will be the target for demand destruction in the Fed’s tightening efforts. And on the corporate earnings front, Q1 reports in general have been pretty good. According to FactSet, the percentage of companies beating estimates has been good, although the magnitude of the beats has been less than normal, which is somewhat disappointing. On the other hand, S&P 500 companies have reported a strong aggregate net profit margin of 12.18%, which remains quite impressive, particularly given rising producer prices.
I think we can all agree that inflation is a direct result of ballooning money supply through both monetary and fiscal policies in reaction to the pandemic lockdowns and the associated supply chain disruptions – and Russian’s invasion of Ukraine (and the economic sanctions that followed) has only worsened it all. Now the Fed is trying to address it through quantitative tightening with higher interest rates and reduction of money supply growth.
However, according to Andrew Lees of MacroStrategy, there has been a rapid decline in the rate of monetary growth, and backward-looking inflation readings are misleading. Thus, interest rates may already be near the elusive neutral rate. He makes a compelling argument. The US Dollar Index (DXY) is at its highest level since 2002, and it is nearing parity with the euro, which has hit 10-year lows. the dollar value of global money supply has been falling. This monetary deflation means that either asset prices must fall to support goods prices, or goods prices must fall to support asset prices … or both assets and goods prices will fall.
Final thoughts:
Although the Fed may well raise rates another 50 bps in June, I stand by my view that it will not raise nearly as much as the market is pricing in, and indeed the Fed may instead be forced to ease. I think interest rates will start to come down as demand destruction sets in, bonds catch a bid, disinflationary structural trends resume, and the Fed decides it must begin buying bonds to ensure financial liquidity, i.e., a sufficient global supply of dollars. Furthermore, with global GDP at about $85 trillion and total global debt estimated at more than $300 trillion, rising interest rates put a tremendous burden on the global economy to service the debt. This puts the Fed between a rock and hard place with its limited tools to fight inflation.
Eric Peters of One River Capital recently offered up some interesting musings, “Monetary policy dominance ended in the pandemic, replaced by fiscal policy dominance…[with] the Fed buying bonds to finance government deficits…. Recent actions have resulted in substantial disinvestment in global energy and commodity production. So supply is not responding to higher prices in the same ways as it has for decades. This creates shortages…. Mean reversion will be replaced by trends, big ones. Violent reversals. Dispersion wins. Volatility. Active management destroys passive. Digital adoption wins big. You must take real risk to make money.”
Friday’s strong stock market rally was encouraging. So, I continue to suggest staying invested in stocks while being prepared for continued volatility. But rather than passively investing in the major cap-weighted indexes, I think investors will find better opportunities among high quality stocks outside of the Big Tech favorites (like FANGMAT) that dominate the cap-weighted S&P 500 and Nasdaq 100. I’m talking about well-positioned stocks with lower valuations and/or higher growth rates, including both value/cyclicals and high-quality, digital, secular-growth names that enjoy high gross margins and pricing power, with many coming from the small-mid (SMID) capitalizations.
In that vein, when Sabrient creates new Baker’s Dozen, Dividend, and Small Cap Growth portfolios, our quantitative growth-at-a-reasonable-price (GARP) model tells us where to find (often “under the radar”) stocks displaying attractive valuations for strong and reliable earnings growth estimates. We employ a similar model for our ETFCast rankings of over 1,000 equity ETFs.
SPY Chart Review:
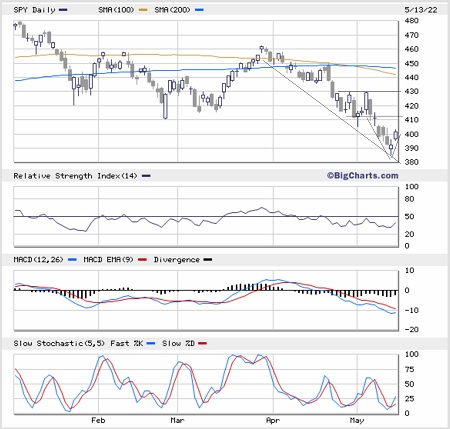
The SPDR S&P 500 Trust (SPY) closed Friday at 401.72. The “W” pattern in March provided a nice rally, but the selloff in April tested the YTD lows, which ultimately failed in May. Now bulls are testing whether Friday provided a V-bottom capitulation, as the SPY tried to hold the newly regained 400 price level. Oscillators RSI and MACD are all pointing upward from oversold territory, but there are lots of support-turned-resistance levels above, starting with an apparent convergence with the 20-day SMA looming at around 412 or so, but there is room to run for at least a solid bounce, if not more (perhaps as high as 420 … if news events permit it). If you pull up a weekly chart, last week provided a bullish hammer candlestick pattern – which is not surprising after six straight down weeks.
Latest Sector Rankings:
Relative sector rankings are based on our proprietary SectorCast model, which builds a composite profile of each of over 1,000 equity ETFs based on bottom-up aggregate scoring of the constituent stocks. The Outlook Score employs a forward-looking, fundamentals-based multifactor algorithm considering forward valuation, historical and projected earnings growth, the dynamics of Wall Street analysts’ consensus earnings estimates and recent revisions (up or down), quality and sustainability of reported earnings, and various return ratios. It helps us predict relative performance over the next 2-6 months.
In addition, SectorCast computes a Bull Score and Bear Score for each ETF based on recent price behavior of the constituent stocks on particularly strong and weak market days. A high Bull score indicates that stocks within the ETF recently have tended toward relative outperformance when the market is strong, while a high Bear score indicates that stocks within the ETF have tended to hold up relatively well (i.e., safe havens) when the market is weak.
Outlook score is forward-looking while Bull and Bear are backward-looking. As a group, these three scores can be helpful for positioning a portfolio for a given set of anticipated market conditions. Of course, each ETF holds a unique portfolio of stocks and position weights, so the sectors represented will score differently depending upon which set of ETFs is used. We use the iShares that represent the ten major U.S. business sectors: Financials (IYF), Technology (IYW), Industrials (IYJ), Healthcare (IYH), Consumer Staples (IYK), Consumer Discretionary (IYC), Energy (IYE), Basic Materials (IYM), Telecommunications (IYZ), and Utilities (IDU). Whereas the Select Sector SPDRs only contain stocks from the S&P 500 large cap index, I prefer the iShares for their larger universe and broader diversity.
Here are some of my observations on this week’s scores:
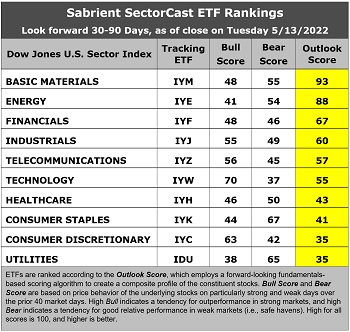
1. The rankings continue to be led by deep cyclicals Basic Materials and Energy with impressive Outlook scores of 93 and 88, respectively, which is largely unchanged from the market’s March highs. You would expect strength in these cyclical sectors given their high earnings leverage within an expansionary economy and rising oil and commodity prices. However, it is notable that their Bull and Bear scores reflect defensive or countertrend behavior, as rising prices tend to hinder economic growth even while benefiting these two sectors. Basic Materials displays strong analyst sentiment (recent positive net revisions to EPS estimates), an ultra-low forward P/E of 9.7x, strong projected EPS growth of 22.4%, an ultra-low forward PEG (forward P/E divided by projected EPS growth rate) of just 0.43, and strong insider sentiment (open market buying). Similarly, Energy also enjoys strong analyst sentiment, the lowest forward P/E of 9.5x, good projected EPS growth of 9.3%, an attractive forward PEG of 1.03, and strong insider sentiment. Rounding out the top six are Financials, Industrials, Telecom, Technology, and Healthcare.
2. At the bottom are Utilities and Consumer Discretionary, sharing Outlook scores of 35. Utilities is a low (but stable) growth sector has been bid up to a forward P/E of 21x on the strength of its solid dividend yield, which is popular as a bond alternative, but its forward PEG is a high 3.0. Consumer Discretionary has the highest projected EPS growth rate of 23%, but it has been hit with a lot of negative revisions to EPS estimates recently.
3. Looking at the Bull scores, Technology has the top score of 70 as stocks within the sector have displayed relative strength on strong market days. Utilities scores the lowest at 38. The top-bottom spread is 32 points, which reflects quite low sector correlations on strong market days. It is desirable in a healthy market to see low correlations reflected in a top-bottom spread of at least 20 points, which indicates that investors have clear preferences in the market segments and stocks they want to hold.
4. Looking at the Bear scores, Consumer Staples scores the highest of 67 followed closely by Utilities at 65, as stocks within these defensive and dividend-paying sectors have been the preferred safe havens on weak market days. Technology displays the lowest score of 37, as investors have fled the sector during market weakness. The top-bottom spread is 30 points, which reflects quite low sector correlations on weak market days. Ideally, certain sectors will hold up relatively well while others are selling off (rather than broad risk-off behavior), so it is desirable in a healthy market to see low correlations reflected in a top-bottom spread of at least 20 points.
5. Basic Materials displays the best all-around combination of Outlook/Bull/Bear scores, while Utilities is the worst. Looking at just the Bull/Bear combination (investor sentiment indicator), Consumer Staples is the best, indicating superior and consistent relative performance (on average) in extreme market conditions whether bullish or bearish, while Financials is the worst.
6. This week’s fundamentals-based Outlook rankings display a bullish bias given that 5 of the top 6 sectors are economically sensitive or cyclical (Energy, Materials, Financials, Industrials, Technology), while the more defensive sectors (Utilities and Staples) are relegated at or near the bottom. However, it is important to note that Energy and Basic Materials have been behaving in a countertrend manner (rising when the rest of the market falls) due to their ability to prosper when oil and commodities prices rise to the detriment of other sectors. Keep in mind, the Outlook Rank does not include timing, momentum, or relative strength factors, but rather reflects the consensus fundamental expectations at a given point in time for individual stocks, aggregated by sector.
ETF Trading Ideas:
Our Sector Rotation model, which appropriately weights Outlook, Bull, and Bear scores in accordance with the overall market’s prevailing trend (bullish, neutral, or defensive), has moved back to a defensive bias last month (once it showed two consecutive daily closes below both the 50-day and 200-day moving averages, following the 50/200 “death cross” in March). This suggests holding Consumer Staples (IYK), Basic Materials (IYM), and Utilities (IDU), in that order. (Note: In this model, we consider the bias to be defensive from a rules-based trend-following standpoint when SPY is above both its 50-day and 200-day simple moving averages.)
If you prefer a neutral bias, the Sector Rotation model suggests holding Basic Materials, Energy, and Financials (IYF), in that order. Or, if you are more aggressively pursuing an oversold bullish stance, the model suggests holding Technology, Consumer Discretionary, and Basic Materials, in that order. So, in all three cases, the model suggests holding Basic Materials.
An assortment of other interesting ETFs that are scoring well in our latest rankings include: First Trust Natural Gas (FCG), First Trust Indxx Global Natural Resources Income (FTRI), Van Eck Vectors Steel (SLX), Valkyrie Bitcoin Miners (WGMI), Invesco DWA Energy Momentum (PXI), Viridi Cleaner Energy Crypto-Mining & Semiconductor (RIGZ), Invesco Dynamic Energy Exploration & Production (PXE), Avantis US Small Cap Value (AVUV), iShares US Oil & Gas Exploration & Production (IEO), AdvisorShares Alpha DNA Equity Sentiment (SENT), SPDR S&P Metals & Mining (XME), SPDR Oil & Gas Exploration & Production (XOP), Alpha Architect US Quantitative Value (QVAL), QRAFT AI-Enhanced US Large Cap Momentum (AMOM), Innovator IBD 50 (FFTY), John Hancock Multifactor Energy (JHME), Innovator Laddered Allocation Power Buffer (BUFF), and iShares US Home Construction (ITB).
As always, I welcome your thoughts on this article! Please email me anytime. Any and all feedback is appreciated! In particular, please tell me what sections you find the most valuable – commentary, chart analysis, SectorCast scores, or ETF trading ideas / sector rotation model.
IMPORTANT NOTE: I post this information periodically as a free look inside some of our institutional research and as a source of some trading ideas for your own further investigation. It is not intended to be traded directly as a rules-based strategy in a real money portfolio. I am simply showing what a sector rotation model might suggest if a given portfolio was due for a rebalance, and I do not update the information on a regular schedule or on technical triggers. There are many ways for a client to trade such a strategy, including monthly or quarterly rebalancing, perhaps with interim adjustments to the bullish/neutral/defensive bias when warranted, but not necessarily on the days that I happen to post this article. The enhanced strategy seeks higher returns by employing individual stocks (or stock options) that are also highly ranked, but this introduces greater risks and volatility. I do not track performance of the ideas mentioned here as a managed portfolio.
Disclosure: At the time of this writing, among the securities mentioned, the author held positions in SQ, NVDA, XOP, SPYD, SPY, QQQ, ARKK, GDX, GBTC.
Disclaimer: Opinions expressed are the author’s alone and do not necessarily reflect the views of Sabrient. This newsletter is published solely for informational purposes and is not to be construed as advice or a recommendation to specific individuals. Individuals should take into account their personal financial circumstances in acting on any opinions, commentary, rankings, or stock selections provided by Sabrient Systems or its wholly owned subsidiary, Gradient Analytics. Sabrient makes no representations that the techniques used in its rankings or analysis will result in or guarantee profits in trading. Trading involves risk, including possible loss of principal and other losses, and past performance is no indication of future results.