Sector Detector: Uncertainties on Fed policy, geopolitics, and earnings cloud 2023 outlook, but trends are promising
 by Scott Martindale
President & CEO, Sabrient Systems LLC
The future direction of both stocks and bonds hinges on the trajectory of corporate earnings and interest rates, both of which are largely at the mercy of inflation, Fed monetary policy, and the state of the economy (e.g., recession). So far, 2023 is off to an impressive start, with both stocks and bonds surging higher on speculation that inflation will continue to subside, the Fed will soon pause rate hikes, the economy will endure at most a mild recession, China reopens, and corporate earnings will hold up…not to mention, stocks have risen in the year following a midterm election in every one of the past 20 cycles. The CBOE Volatility Index (VIX) is at a 52-week low.
Moreover, although inflation and interest rates surged much higher than I predicted at the beginning of 2022, my broad storyline around inflation and Fed policy remains intact: i.e., a softening of its hawkish jawboning, followed by slower rate hikes and some balance sheet runoff (QT), a pause (or neutral pivot) to give the rapid rate hikes a chance to marinate (typically it takes 9-12 months for a rate hike to have its full effect), and then as inflation readings retreat and/or recession sets in, rate cuts commence leading to an extended relief rally and perhaps the start of a new (and lasting) bull market. Investors seem to be trying to get a jump on that rally. Witness the strength in small caps, which tend to outperform during recoveries from bear markets. However, I think it could be a “bull trap” …at least for now.
Although so far consumer spending, corporate earnings, and profitability have held up, I don’t believe we have the climate quite yet for a sustained bull run, which will require an actual Fed pause on rate hikes and more predictable policy (an immediate dovish pivot probably not necessary), better visibility on corporate earnings, and lower market volatility. Until we get greater clarity, I expect more turbulence in the stock market. In my view, the passive, broad-market, mega-cap-dominated indexes that have been so hard for active managers to beat in the past may see further weakness during H1 2023. The S&P 500 might simply gyrate in a trading range, perhaps 3600–4100.
But there is hope for greater clarity as we get closer to H2 2023. If indeed inflation continues to recede, China reopens, the war in Ukraine doesn’t draw in NATO (or turn nuclear), the dollar weakens, and bond yields fall further, then investor interest should broaden beyond value and defensive names to include well-valued growth stocks help to fuel a surge in investor confidence. I believe both stocks and bonds will do well this year, and the classic 60/40 stock/bond allocation model should regain its appeal.
Regardless, even if the major indexes falter, that doesn’t mean all stocks will fall. Indeed, certain sectors (most notably Energy) should continue to thrive, in my view, so long as the global economy doesn’t sink into a deep recession. Quality and value have regained their former luster (and the value factor has greatly outperformed the growth factor over the past year), which means active selection and smart beta strategies that can exploit the performance dispersion among individual stocks seem poised to continue to beat passive indexing in 2023—a climate in which Sabrient’s approach tends to thrive.
For example, our Q4 2021 Baker’s Dozen, which launched on 10/20/21 and terminates on Friday 1/20/23, is outperforming by a wide margin all relevant market benchmarks (including various mid- and small-cap indexes, both cap-weighted and equal-weight) with a gross total return of +9.3% versus -10.2% for the S&P 500 as of 1/13, which implies a +19.5% active return, led by a diverse group encompassing two oil & gas firms, an insurer, a retailer, and a semiconductor equipment company. Later in this post, I show performance for all of Sabrient’s live portfolios—including the Baker’s Dozen, Forward Looking Value, Small Cap Growth, and Dividend (which offers a 4.7% current yield). Each leverages our enhanced model that combines Value, Quality, and Growth factors to provide exposure to both longer-term secular growth trends and shorter-term cyclical growth and value-based opportunities. By the way, the new Q1 2023 Baker’s Dozen launches on 1/20.
Here is a link to a printable version of this post. In this periodic update to start the new year, I provide a comprehensive market commentary, discuss the performance of Sabrient’s live portfolios, offer my technical analysis of the S&P 500 chart, review Sabrient’s latest fundamentals based SectorCast quant rankings of the ten U.S. business sectors, and serve up some actionable ETF trading ideas. To summarize, our SectorCast rankings reflect a modestly bullish bias, the technical picture looks short-term overbought but mid-term neutral, and our sector rotation model remains in a neutral posture. Energy continues to sit atop our sector rankings, given its still ultra-low (single digit) forward P/E and expectations for strong earnings growth, given likely upside pricing pressure on oil due to the end of Strategic Petroleum Reserve releases (and flip to purchases), continued sanctions on Russia, and China’s reopening…and assuming we see only a mild recession and a second half recovery. Read on…
Market commentary:
Last year as we headed into 2022, I said, “I expect greater volatility and perhaps a rather significant market correction.” I also opined that quality would be the primary investor focus in 2022, leading to higher performance dispersion among stocks that would benefit active management, smart beta, and long/short strategies. (“Quality” means strong fundamentals, including consistent earnings growth, strong free cash flow, a solid balance sheet, pricing power, and a wide economic “moat.”) Indeed, Sabrient’s portfolios have almost all outperformed, and our subsidiary Gradient Analytics (a forensic accounting/earnings quality research firm) had a successful year, with quite a number of short ideas that sold off precipitously for its clientele of institutional investors and long/short hedge funds.
But what I didn’t foresee last January, of course, was Russia’s invasion of Ukraine and the attendant impacts on food and energy supplies, transportation, and prices, which propelled and prolonged inflationary pressures—and by extension the Fed’s hawkish approach to monetary policy. With no ability to impact supply chains or the ravages of war, all the Fed could do to fight inflation was suppress demand. And so that’s what it did. Thus, interest rates rose much higher than I predicted, surging well above 4% before hitting a peak. Individual investor bullish sentiment remains depressed at only 24.0% (versus historical average of 37.5%). In fact, 2022 was the first year in the history of the survey (since 1987) that bullish sentiment was below its historical average every week of the year.
In addition, I expected inflation readings to moderate by mid-to-late 2022, given higher base period comps and mending supply chains, which has come to pass. Although inflation surged higher than I predicted at the start of 2022, peaking at a CPI of 9.1% in June, it has been gradually receding ever since, with the latest December reading coming in at 6.5% (and core CPI up +5.7%). The only disappointment in the report was the persistence in the rent component, which has not yet shown up in the data. Still, Federal Reserve Chair Jerome Powell has lamented that persistently low labor participation and falling productivity has led to wage inflation, which has partially offset the Fed’s efforts to induce both demand destruction (“What we hope to achieve is a period of growth below trend”) and a bear market in risk assets (to reduce the “wealth effect”).
The Fed’s relentlessly hawkish tone has made investors react spontaneously to every piece of economic data—bullish when it indicates the economy and inflation are slowing (suggesting an imminent Fed pause followed by a dovish pivot) or bearish when it indicates continued economic strength (suggesting additional rate hikes and contraction of the Fed’s balance sheet). Moreover, the geopolitical landscape—including China’s iron-fisted COVID lockdowns and increasing aggression from Russia (in Ukraine), China (regarding Taiwan), and North Korea (nuclear escalation)—has been destabilizing for supply chains and the global economy.
All of this created elevated stock market volatility all last year (+1 standard deviation above average, according to DataTrek, which historically has only happened during bear markets or periods of crisis), and it clouded the corporate earnings outlook and depressed consumer, business, and investor sentiment. Today, despite impressive market strength and a complacent VIX to start the new year, investors remain highly reactive to the news (especially every utterance from the Fed), and algorithmic trading only exacerbates it all.
The global equity market capitalization shrunk by $15 trillion in 2022, while the global bond market lost $30 trillion in value. The S&P 500 lost $8.2 trillion, closing the year at an aggregate market cap of $32.2 trillion. Looking ahead, the range of S&P 500 projected returns for CY 2023 on Bloomberg is the widest in 14 years. A worst-case scenario could possibly take the S&P 500 back down to the 3300 level of Q4 2020. (Note: Morgan Stanley’s Michael Wilson believes the S&P 500 might fall to 3,000 in his worst-case scenario.) Bonds may well outperform stocks during the first half of the year—and perhaps even throughout the year—as equities rely not only on falling rates (from a discounted cash flow basis) but also on growth in both corporate earnings and the equity risk premium, which would be difficult to achieve if we go into recession with its attendant valuation compression (particularly since the ERP is already quite low).
The Atlanta Fed’s GDPNow model is currently forecasting +4.1% growth in Q4 2022 US real GDP. For 2023, the Conference Board forecasts only +1.95 in Q4, +0.2% GDP growth for CY 2023, followed by +1.7% in 2024. However, it still expects that the US economy will fall into recession soon, with three quarters of negative GDP growth starting in Q1 2023. The World Bank released its semiannual Global Economic Prospects report, which forecasts China’s 2023 GDP growth at an impressive +4.3%, but that’s the only positive growth forecast for any major economy.
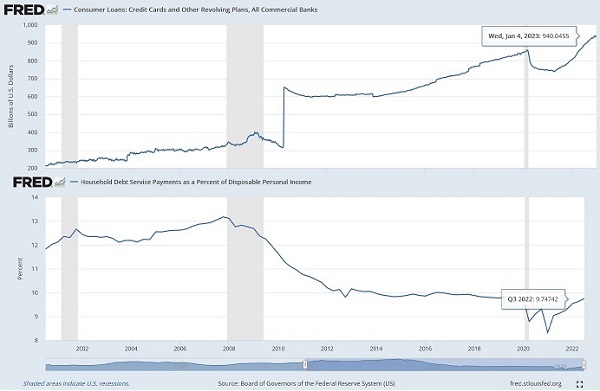
Both the ISM Manufacturing Index and ISM Services Index have entered contraction (i.e., below 50, after 30 consecutive months of expansion), while wage inflation is slowing. Only 2 of the 15 industries surveyed for manufacturing reported expansion in December (Primary Metals and Petroleum & Coal Products). Furthermore, PCE and consumer spending indicators are suggesting a weakening economy. In fact, it appears that oil & fuel sales and defense spending have been the main drivers keeping GDP growth positive. Some market commentators have sounded alarm bells about consumer debt reaching record levels—and fast approaching the $1 trillion mark—alongside the fast-growing “buy now, pay later” option, but the good news is that household debt service payments as a percentage of disposable person income remains in the normal range, as illustrated in the chart below. Moreover, consumer debt payment delinquency rates typically rise dramatically going into a recession, but delinquency levels remain low.
Regarding US corporate earnings, for Q4 2022, the estimated earnings decline for the S&P 500 is about -3.9%, according to FactSet. S&P 500 companies are expected to report aggregate YoY earnings growth for calendar year 2022 of +5.1%, which is below the trailing 10-year average annual rate of +8.5%. Leading sectors are Energy, Industrials, and Real Estate. And the bottom-up consensus earnings expectations are for the S&P 500 to deliver approximately $233 of earnings per share in CY 2023, or roughly 5% growth from expected 2022 amounts.
Notably, after steadily rising for several years and peaking at almost 13% in 2021, corporate profit margins have been eroding due to rising input costs and supply chain disruptions. According to FactSet, S&P 500 margins declined 1% year-over-year during Q3 2022 and are expected to decline for the full calendar year 2022. The narrowing gap between CPI and PPI has been a harbinger of narrowing margins. December PPI will be released on 1/18. Regardless, given that many input prices have been receding and supply chains have been mending (as discussed below), I am optimistic about margins stabilizing.
Inflation and Fed policy:
To review, first the Fed inflated markets with money supply (i.e., asset inflation) while our elected leaders enacted forced lockdowns and massive transfer payments. It then trickled over into CPI inflation due to broken supply chains, labor shortages, and falling productivity caused by those lockdowns. So, rather than normal economic forces creating supply/demand imbalances, consumer demand quickly snapped back to pre-pandemic levels thanks to governmental monetary and fiscal largesse, while supply was constrained by supply chains (which include manufacturing, transportation, logistics, energy, and labor) hobbled or destroyed by forced lockdowns and war.
The Fed has been struggling to let the air back out via a “financial lockdown,” even as our elected leaders are enacting even more spending programs. Thus, the Fed has made it clear (with hawkish jawboning) that it intends to tamp down inflation at any cost (even if it means a recession, rising unemployment, and a weaker stock market), with a target fed funds rate around 5% or so. To that end, Fed chair Powell has been trying to avoid the need for raising rates too far (and then having to quickly cut rates soon after) by mercilessly “talking up” bond yields while implying there would be no protective “Fed put” to support the economy or stock prices.
As I have regularly discussed, while market commentators regularly make scary comparisons with prior inflationary periods, my view has been that artificially disrupted supply chains are a key differentiator today versus previous periods of high inflation. And so, compared to prior inflationary periods in history, there is much more potential on the supply side of the equation to bring supply and demand into better balance and alleviate inflation, rather than relying primarily on Fed policy to depress the demand side (and intentionally induce a recession). The good news is that disrupted supply chains are rapidly mending, and China has announced plans to relax its zero-tolerance COVID restrictions and launch new policy initiatives to support and stimulate its real estate sector. Even better news would be an end to Russia’s war on Ukraine, which would have a significant impact on supply chains.
The New York Fed recently published a report showing that supply chains comprise nearly 40% of inflation. And Fed governors acknowledge that rate hikes can’t fix supply chain challenges, ease oil prices, resolve Russia’s war on Ukraine, or reduce Chinese lockdowns. Nor will a self-induced recession, which would impact workers and small businesses most. So, to close the gaping excess demand gap, aggregate demand simply had to be depressed just enough to buy time for supply chains to gradually mend. The other important thing would be for workers who have stopped looking for work to return to the labor force, which would boost the labor participation rate and staunch further wage inflation.
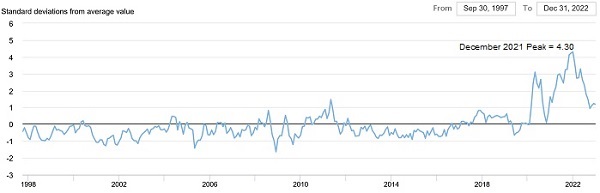
Supply have improved immensely already, with further progress coming. Over the past several months, key prices like oil, commodities, and transportation have fallen precipitously, and wage growth is slowing. The New York Fed’s Global Supply Chain Pressure Index (GSCPI), which measures the number of standard deviations from the historical average value (aka Z-score), fell precipitously as shown in the chart below, from a December 2021 high of +4.30 to the September reading of +0.94, where it now seems to oscillating in place. The current score for December 2022 is +1.18. Note that for most large data sets of any kind, it is rare to see a Z-score fall outside the range of -3 to +3, so the December 2021 high reflected unusually extreme pressures on supply chains, which have rapidly receded.
As the Fed’s QT works its way through the economy, rising real yields depress demand and boost savings, which further serves to reduce inflation. Reduced consumer demand and a Fed-induced recession (assuming it arrives) will challenge corporate earnings. I believe interest rates will continue to pull back but will likely remain elevated (even if hikes are paused or ended) unless we enter a deep recession and/or inflation falls off a cliff. “Elevated” rates (e.g., 4% with 2-2.5% inflation, or 1.5-2.0% real yield) are not a bad thing, as fixed income investors deserve a reasonable return—which they did not enjoy under ZIRP.
Counteracting the Fed’s efforts to tamp down inflation and economic growth is Congress and its profligate spending programs. While the unelected Fed governors are trying reel in the Fed’s massive balance sheet (which has financed congressional spending programs, the federal debt, and the budget deficit), our elected leaders are trying to curry favor with donors and constituents with massive new spending. Besides our need for freshly printed dollars here at home, the Fed also must ensure a sufficient supply of dollars in a global economy that depends upon them—given that 85% of foreign exchange transactions, 60% of foreign exchange reserves, and 50% of cross-border loans and international debt are in US dollars. This limits the Fed’s flexibility to shrink its balance sheet. This is why many commentators opine that the Fed intends to keep tightening “until something breaks.” When the Fed tightens while other central banks are accommodative, it strengthens the dollar excessively and essentially “exports” inflation—which at the extreme can lead to capital flight, destabilization, and economic migration in other countries, particularly emerging markets…not to mention worsen our own border crisis.
So, to keep the dollar from getting any stronger than it already is, the Fed may have no choice but to ease up on its inflation focus, pause on further rate hikes, and start printing more dollars (and perhaps even buy foreign sovereign debt) in order to weaken the US dollar and bolster other major currencies. I believe this is why the Fed has been relying so much on tough talk while avoiding talking about M2 money supply—so that it won’t have to reduce its balance sheet so much.
Nevertheless, M2 money supply has fallen slightly while real interest rates have risen to 10-year highs. Combined with growing recessionary fears, investment capital has increasingly flowed into bonds more recently, pushing down interest rates, while equity valuation multiples have fallen in the face of a hawkish Fed and concerns about war, geopolitical turmoil, recession, and corporate earnings. Forward P/Es for S&P 500 and S&P 600 small caps are now 17.9x and 13.7x (as of 1/13). As the 10-year Treasury yield retreated from its October high of 4.33% to a low near 3.40% in December, the 10-2 yield curve inverted to the greatest degree in 40 years (around -80 bps), which historically is highly predictive of a significant recession. As of 1/13, the 10-2 inversion is -72 bps (3.50-4.22%). The steeper the inversion, the less incentive for banks to lend—they can simply park capital in reserve accounts at the Fed at an attractive, risk-free rate. Notably, the apex of the Treasury curve is the 6-month bill (4.80% as of 1/13).
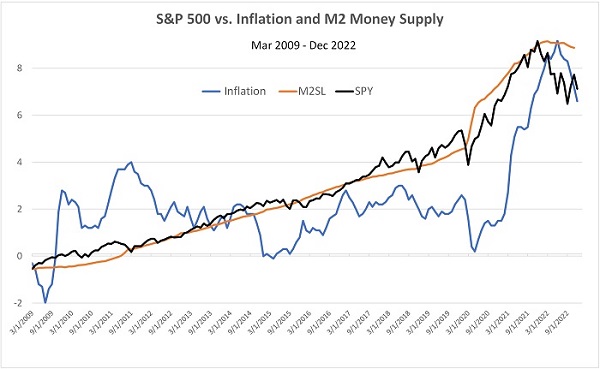
The chart below shows the relationship between the S&P 500, inflation, and M2 money supply since the March 2009 market bottom following the Financial Crisis. You can see the close correlation between rising money supply and rising equity prices (aka asset inflation), while CPI inflation oscillated in a trading range (0-4%). Then, when money supply surged in response to the pandemic lockdowns and stocks quickly raced to catch up, inflation soon followed suit and surged as well. You can see that stocks peaked right around the same time that money supply peaked, and then inflation peaked several months later.
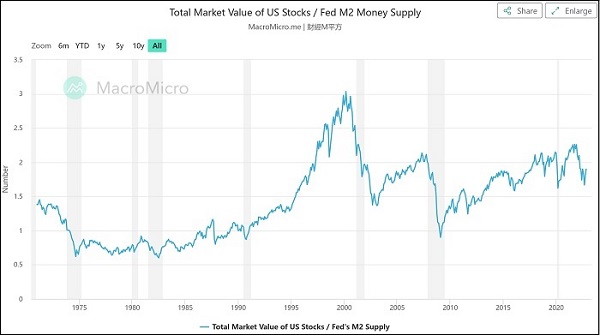
Furthermore, the chart below from MacroMicro shows that the ratio of the total value of US stocks (Wilshire 5000) to M2 money supply sits right about in the middle of the range of the past 20 years (post-Internet bubble). So, if the Fed doesn’t intend to slash M2 but merely reduce its rate of growth, stocks still should be able to rise.
The big news last week of course was the +6.5% YoY inflation print for December. Goldman Sachs economists expect core PCE (the Fed’s preferred gauge of inflation) to decline to about 3% by December 2023 (compared to 5.5% reported by the BEA for November), reflecting weaker commodity prices, improving supply chains, falling shelter inflation, and slowing wage growth. The US dollar is still quite strong, although it has been weakening quickly since peaking in October (when stock and bond prices bottomed), which will support US corporate earnings.
The unemployment rate is quite low at 3.5%, but the labor participation rate also remains stubbornly low, and capacity utilization remains right at the 80% threshold (above which indicates tight supply conditions and inflationary pressures), which is about where it was in 2H 2018. So, we find that inflationary pressures have moved from the Goods segment to the Services segment, which of course is more impacted by labor shortages and wage inflation. Housing rent has proved stubborn even has housing prices have retreated.
The tricky part to the labor shortage is the commensurate lack of affordable housing. No matter what politicians might say about the need to create “good jobs,” there are already plenty of such jobs going unfilled, including those in clean energy that have available funding from the (misleadingly named) Inflation Reduction Act. Rising participation from existing citizens would help, but that likely would require significantly higher wages to lure people back to the workplace, which is inflationary. Bringing in foreign labor and training these new workers might be another option, but that’s where the lack of affordable housing rears its ugly head. Longer term, productivity-enhancing technologies continue to proliferate along with other disinflationary structural trends, which I believe will reverse the troublesome trend in labor productivity and help to contain costs and boost profitability—leading to rising corporate earnings and a non-inflationary rise in real wages, which together would suggest a healthy and sustainable economy and stock market.
Regardless, we all (including the Fed) should now be able to acknowledge that, as One River Asset Management recently wrote, “Heading into the 2020 downturn, monetary policy had lost its effectiveness. Rate cuts and QE were no longer able to stimulate the real economy, even if they could still lift asset prices. But unlike in previous cycles, higher asset prices produced very limited wealth effects, and instead amplified inequality, which itself had become a new kind of economic headwind and a growing political crisis.”
Fed Funds Futures now predict just two more 25-bp rate hikes—one in February and one in March—plus high probably that those rate hikes will be reversed by year end. The next FOMC reveal will come on 2/1.
Equity valuations:
It's no secret that Energy was by far the best performing sector in 2022, with the Energy Select Sector SPDR (XLE) up +64.3%, followed by Utilities Select Sector SPDR (XLU) at +1.4%. Moreover, 4 of the top 5 performing US stocks and 22 of the top 30 were from the legacy Energy sector. [Those top 5 were Warren Buffett fave Occidental (OXY, +119%), Signify Health (SGFY, +101%), Hess (HES, +94%), Texas Pacific Land (TPL, +91%), and Exxon Mobil (XOM, +87%).] The table below compares 2022 total returns for a variety of ETFs representing various sectors, asset classes, styles, and market caps.
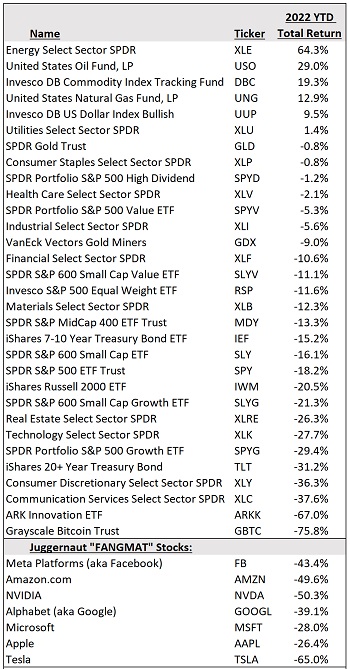
You can see that outside of oil, gas, and commodities, only the US dollar provided a positive return of significance. Notably, of course, the biggest source of distress for individual investors and their advisors was the fact that the traditional 60/40 stocks/bonds portfolio allocation failed so miserably. Even gold did little more than hold its value. Aggressive/speculative growth was severely humbled from its high-P/E perch, as evidenced by the dismal performance of ARK Innovation (ARKK), and crypto was dealt a similar fate. In fact, the entire “FANGMAT” gang of 7 tech-oriented mega-cap darlings fell an average of -43%!
Regarding IPO activity, according to Legacy Research, there were only 71 deals in 2022 raising a mere $7.7 billion last year, which is the lowest IPO activity in more than 30 years. Shockingly, 2022 was the first year in more than 20 years that there wasn’t a single private-equity-backed IPO—likely due to concerns that valuations might have much further to fall.
By the way, for comparison, the soon-to-terminate Q4 2021 Baker’s Dozen (the only Baker’s Dozen portfolio that was live for all of 2022) showed a -3.59% total return during the 12/31/21–12/31/22 timeframe. Over its full life so far (10/20/21–1/13/23), it shows a gross total return of +9.3% versus -10.2% for the S&P 500, which implies a +19.5% active return. This serves as an example of how active selection can outperform when we don’t have a narrow, defensive, meg-cap-dominated market.
Value outperformed Growth by a wide margin (about 15 pps within both large caps and small caps) as investors rotated to companies with solid balance sheets, predictable cash flows, and attractive valuations. According to famed quantitative, value-oriented hedge fund manager Cliff Asness of AQR Capital, the value spread (versus growth) ended 2022 still at an extreme negative divergence despite having made up a lot of ground against growth, which makes him optimistic about “continued normalization in 2023 and beyond.” And if inflation continues its rapid retreat and the Fed pauses rate hikes, growth stocks may get a boost as well.
In October 2022, the 10-year Treasury yield spiked to over 4.3% (its highest since the Financial Crisis) primarily due to ultra-hawkish Fed jawboning. But it seemed unsustainably high given the S&P 500’s dividend yield of only 1.7% and its earnings yield (inverse of 16.5x P/E) of 6.0%—which implied an equity risk premium of only 3.4% (versus a “typical” ERP of 5.0%). So, bonds had become highly attractive relative to stocks, suggesting that either yields had to recede (bond prices rise) or stocks would fall further. But today, with recession on the horizon and investors hungry for safe yield and given that capital markets are forward discounting (expectant of a Fed pivot), it was logical that idle cash would soon flow into bonds, which it has done. So, as the 10-year yield has tumbled back down to 3.5%, stock prices have risen while the P/E multiple on the S&P 500 has increased to 17.9x (implying an earnings yield of 5.6%), which has lifted the equity risk premium to about 3.8%.
Last year as we were heading into 2022, I wrote, “…the elevated multiples in the SPY and Invesco Nasdaq 100 (QQQ) are driven by the popular mega-cap stocks such that bullish conviction at this point should come from all the other (often neglected) opportunities that offer high quality at much more attractive valuations. Indeed, I’ve seen some pundits calling for 2022 to be the ‘dawn of a golden age’ for value, while others say growth stocks historically do quite well during modestly rising rates (and particularly after inflation has receded from a cyclical peak). Net-net, I think this supports our view to hold a balance of both.” As we enter 2023, that view still seems valid, and we continue to suggest a balance between value/cyclicals/dividend payers (including oil & gas, industrials, and commodities) and high-quality secular growth (e.g., Healthcare and selected Technology firms displaying pricing power and a wide economic “moat”). I believe last October may have marked the cyclical bottom in both stocks and bonds—which means holding both stocks and bonds should be profitable over the next 12-18 months.
By the way, whereas stock and bonds historically have been inversely correlated during volatile times, last year they fell in concert to an extent that hasn’t been seen in over 60 years, as bonds failed to serve their traditional role as a safe haven. Allow me to offer a brief comment on the 60/40 stock/bond allocation model, and perhaps assuage fears about its demise. The chart below shows correlation (blue line) of the SPDR S&P 500 Trust (SPY) and iShares 20+ Year Treasury Bond ETF (TLT). Historically, this correlation has been low and usually inverse (i.e., below the black zero line)—until 2022 when stocks and bonds became highly (and undesirably) correlated. Also shown on the chart is the 10-year yield (red line).
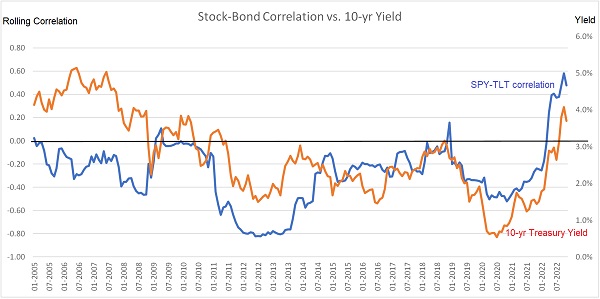
Prior to 2015, the yield sometimes moved with stock-bond correlation and sometimes opposite stock-bond correlation. But starting in 2015, there seems to be a visible correlation between rising (or falling) yields and rising (or falling) stock-bond correlation. Why? Well, historically, the major indexes were dominated by oil companies and large industrial conglomerates. But as money flowed heavily into growth stocks, the market became narrowly focused on mega-cap Tech (giving rise to the “FAANG” acronym). Thus, the stock-bond correlation has been more correlated with bond yield (as denoted by the arrows), likely due to the predominance in the index of growth stocks, whose valuations are highly sensitive to rising interest rates (on a discounted cash flow basis) compared to value stocks and dividend payers.
This suggests that as interest rates fall and capital rotates into value stocks and cyclicals, stock-bond correlations should fall…and the 60/40 model just might regain its luster. I think this is achievable so long as the Fed can refrain from pumping up the money supply well beyond the rate of GDP growth, which tends to induce speculative investing.
Potential risks:
For now, investors are primarily focused on inflation, Fed policy, and corporate earnings. From the Fed’s perspective, they see persistently high inflation while people who have money are still spending, jobs are still being created, unemployment is falling, and wages are still rising, which keeps the Fed hawkish. And historically, a hawkish Fed has led to tighter financial conditions, slower growth in money supply, higher interest rates, slower economic growth, and lower equity multiples.
I discussed earlier many reasons why the Fed should be constrained on raising interest rates much higher or shrinking money supply growth, but there is no telling what it might do. Until there is greater clarity, I expect elevated volatility to persist, particularly in H1 2023. As for additional macro risks to the economy and markets this year, I would summarize them as follows:
1. Catastrophic escalation in Russia’s war on Ukraine (e.g., a tactical nuke)
2. New COVID lockdowns that prolong China’s economic slowdown and stunt supply chains
3. Untamed structural inflation that leads the Fed to rapidly withdraw liquidity and crush the jobs market (policy mistake)
4. Deep recession or “stagflation” and corporate earnings falling far short of expectations
5. Escalation in financial/technological/military confrontation with China (e.g., over Taiwan)
6. Political and economic turmoil, hyperinflation, and mass emigration in emerging markets due to ultra-strong US dollar and deleveraging heavily indebted global economy
On the other hand, a positive risk is the potential for China to placate its huddled masses (who are quite angry from the CCP’s draconian lockdowns) by goosing its economy into major growth mode with accommodative policies. This would be expected to benefit the broader global economy.
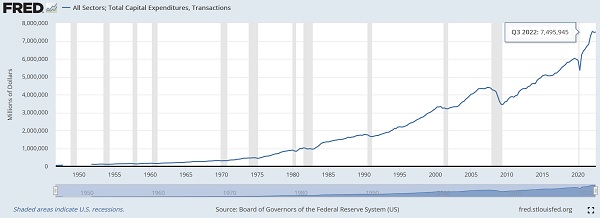
A compelling bearish thesis I have heard is that the long-running bull market was driven by low inflation, ultra-low interest rates (ZIRP), quantitative easing (QE), world peace, and globalization, and so, since those favorable variables have now reversed, valuation multiples (P/E) must ultimately revert to the lower levels of yore. However, I do not believe these variables have permanently reversed. I think inflation and interest rates will continue to recede (albeit not back to the levels under ZIRP and hyper-globalization), while onshoring and other forms of deglobalization will turn out to be simply some “deconcentration” of manufacturing away from China (and Taiwan, for semiconductors), and the disinflationary and productivity-enhancing secular trends will resume—including unstoppable technical innovation/disruption that supports resilient economic growth. Moreover, I expect we will be seeing many of the old supply chains completely remade with “America 3.0” methods and technologies. Notably, capital spending continues to be robust, as shown in the chart below.
Final comments:
To summarize, the direction of equity prices hinges on the trajectory of corporate earnings and interest rates, both of which are largely at the mercy of the trajectory of inflation, Fed monetary policy decisions, and the state of the economy (e.g., recession). I believe inflation and bond yields will continue to recede and supply chains will continue to recover (albeit hindered by Russia’s war), while the Fed induces demand destruction and a mild recession, leading global investors to seek the safety and income of elevated Treasury yields (i.e., rising bond prices). If inflation and nominal yields continue to fall, real yields (nominal minus inflation) should follow, leading to a neutral Fed pivot in H1 2023 to at least allow the tightening enacted thus far some time to take full effect, which typically takes 9-12 months for each action to show its impact. Then we should see improving corporate profitability, rising earnings, and perhaps some multiple expansion on stock valuations (e.g., higher P/Es).
Moreover, I do not believe our political leaders would allow the economy (and especially the working class) to be crushed, no matter how hawkish the Fed’s rhetoric has been. Ultimately, I think the Fed will not only be willing to live with inflation somewhat above its 2% goal, but it may become an intentional tactic within a coordinated global monetary policy (a la the 1985 “Plaza Accord”) that seeks to weaken the dollar and gradually “inflate away” the massive debt loads across the world. For now, with Congress pumping out new spending (euphemistically called “investments”), and with a global economy dependent upon an abundant supply of US dollars, and with an ultra-strong dollar proving to be disastrous for emerging market economies (and exacerbating turmoil, capital flight, and emigration from many of those countries), they will be hard-pressed to shrink money supply much further.
Key market segments for investment (including funds from the massive new $1.7 trillion Omnibus Appropriations bill) include the defense industry of course (with about 55% of the omnibus bill earmarked for it), as well as domestic materials and mining (including rare earth metals that today are mainly sourced from China), liquefied national gas (LNG), MLPs, bulk shipping, alternative energy (e.g., nuclear, solar, wind, hydrogen, biomass), aerospace (planes), cloud data centers, electric vehicles, revival of high-tech manufacturing (especially semiconductors, given that we are highly dependent on Asian sources for these critical components), pharmaceuticals (ditto the dependency on imports), and healthcare/biotech/genomics/life-sciences technologies.
Furthermore, the long-term outlook is bright for blockchain, cryptocurrencies, metaverse, space exploration (including tourism and asteroid mining), 5G, IoT, Big Data, AI/ML, Web 3.0, cloud computing, digitization, video conferencing, augmented/virtual reality (AR/VR), computer vision (CV), gaming, networks, sensors, 3-D printing, robotics, sustainability, cybersecurity, decentralized finance (DeFi), financial technology (Fintech), nanotech, telehealth, precision medicine, computational biology, and biologics—all are all rapidly changing the world as we know it.
In fact, an incredible and long-elusive breakthrough just occurred in nuclear fusion. Scientists at the Energy Department’s Lawrence Livermore National Laboratory (LLNL) in California announced they had created a first-ever fusion reaction (or “ignition”), i.e., more energy was output than was input to create the reaction. After decades of failures, this milestone has given a major boost to the prospect of a world that enjoys 100% clean, abundant energy. As you likely know, nuclear fusion has no emissions, radioactive waste, or risk of disaster that nuclear fission carries. Amazing stuff. Gotta love our scientists and entrepreneurs.
Performance of Sabrient’s portfolios:
In my view, rather than investing in the broad passive indexes, it seems the time is ripe for active strategies that can exploit the performance dispersion among industries and individual stocks. On that note, Sabrient’s new portfolios—including the Baker’s Dozen, Forward Looking Value, Small Cap Growth, and Dividend—leverage our enhanced model-driven selection approach (which combines Quality, Value, and Growth factors) to provide exposure to both the longer-term secular growth trends and the shorter-term cyclical growth and value-based opportunities. You can see in the table below that all 20 of 21 live (or recently terminated) portfolios are outperforming (or staying within 1% of) their benchmarks from inception thru Friday 1/13 (based on gross total returns as shown on the ftportfolios.com website for portfolios with at least one month of history)—many by significant margins.
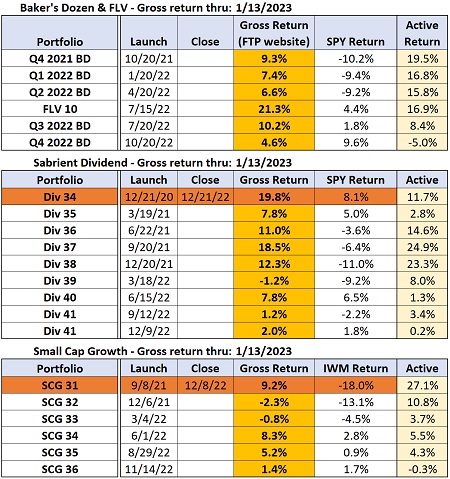
Baker’s Dozen is Sabrient’s flagship portfolio, and it holds concentrated positions in just 13 diversified stocks representing various sectors and market caps. The new Q1 2023 Baker’s Dozen launches on Friday 1/20. In addition, the Sabrient Dividend portfolio is different from most high-yielding dividend products in that it seeks both capital appreciation and reliable income by identifying quality companies selling at an attractive price with a solid growth forecast, a history of raising dividends, a good coverage ratio, and a target yield of 4% or more. The newest Dividend 42 has a current yield of 4.8% as of 1/13. And for those seeking small cap exposure, which many observers think will lead the next bull market, Sabrient Small Cap Growth 36 provides an alpha-seeking alternative to the Russell 2000 ETF.
Sabrient’s new indexes for ETF and TAMP licensing:
Investors are likely to continue their focus on quality and value (rather than the liquidity-fueled speculation of yore). In response, we have created the Sabrient Quality Index Series comprising 5 broad-market and 5 sector-specific, rules-based, strategic beta and thematic indexes for ETF licensing, which we are pitching to various ETF issuers. For those who like to invest through a TAMP or an ETF, you might be interested in learning about Sabrient’s new index strategies. Here are some that we think might be the most timely:
1. Sabrient Armageddon Index was designed to address a growing investor desire for an alternative defensive, low-beta, all-equity portfolio that can minimize losses during economic distress, market dislocation, and tumultuous/volatile conditions (like we have now!) while also offering reasonable upside during normal or bullish market conditions. The rules-based model searches a narrow universe of defensive/all-weather industries like Food/Tobacco, Gold/Mining, Household/Personal, Pharma, Telecom, and Utilities.
2. Sabrient Quality Growth Plus Income Index is one of our 10-index Sabrient Quality Index Series that seems particularly timely given the Fed’s evolving policies and the market income-paying strategies. We think of it as an “all-weather” hybrid product that combines capital appreciation potential with a robust dividend yield.
3. Sabrient Space Exploration & Sustainability Index leverages our founder’s NASA Apollo 11 background). Our reasoning for combining space with sustainability is based upon putting human settlements on space stations, the moon, or other planets, which would require advances in both technologies.
Each has performed quite well during the market turbulence. Other strategies that might be of interest include the Sabrient Insider Sentiment Index, Sabrient Earnings Quality Leaders Index (based on our subsidiary Gradient Analytics’ forensic accounting expertise), Sabrient SMID Quality Growth Index, or Sabrient Legacy Plus Green Energy Index, among others. Please let me know (and tell your favorite TAMP and/or ETF provider as well!) if you would like to learn more about gaining access to any of these themes.
SPY Chart Review:
The SPDR S&P 500 Trust (SPY) closed Friday 1/13 just below 400, where it is up against round-number resistance as well as the 200-day simple moving average. Although Friday brought a bullish engulfing candle, the previous day looking like a bearish “hanging man” candle, and the oscillators RSI, MACD, and especially Slow Stochastic are getting overbought. The Russell 2000 small cap index is even more extended. So, stocks could be in for a pullback after a fast start to the year. My guess is that investors will wait for important FOMC meeting on 2/1 before deciding where to head next.
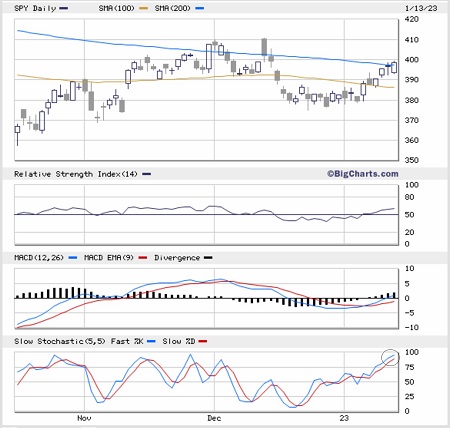
Many chartists are talking about the rare “breakaway momentum indicator” that was just triggered. A long-time market analyst named Walter Deemer apparently observed that when the 10-day NYSE Advance/Decline ratio exceeds 1.97, the market has achieved “breakaway momentum.” The indicator has been triggered 24 times since 1949, and each time stocks were higher over the next 6 to 12 months—usually significantly so. That’s a positive sign.
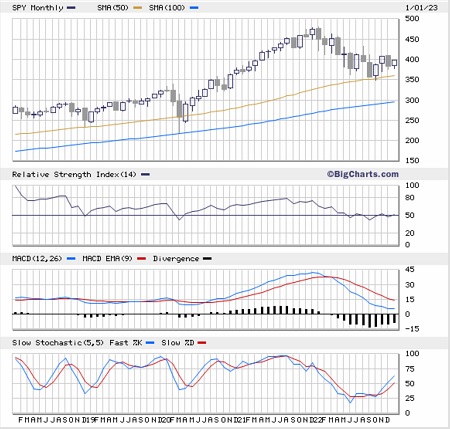
In addition, if you pull up a 10-year monthly chart of SPY, as shown below, you can see the strikingly monotonic uptrend line coming off the pandemic selloff and how ominously stretched it became from its moving averages. Not surprisingly, MACD saw a bearish crossover from extremely overbought last February and price retreated precipitously to retest support at the 50-month moving average where it bounced strongly in October-November. December formed an ominous bearish engulfing candle, but now January is looking stronger and the oscillators RSI, MACD, and Slow Stochastic all look either neutral or bullish. How the January monthly candlestick shapes up will say a lot about H1 2023. A break below the 50-month SMA could take the SPY back down to 330 (or even 300, in a worst-case scenario). More likely is some volatility and consolidation during H1 2023.
Latest Sector Rankings:
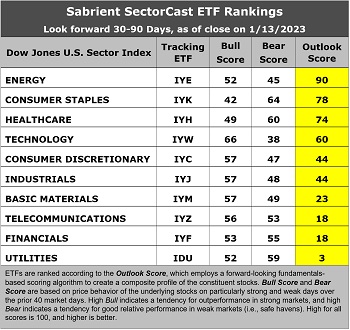
Relative sector rankings are based on our proprietary SectorCast model, which builds a composite profile of each of over 1,000 equity ETFs based on bottom-up aggregate scoring of the constituent stocks. The Outlook Score employs a forward-looking, fundamentals-based multifactor algorithm considering forward valuation, historical and projected earnings growth, the dynamics of Wall Street analysts’ consensus earnings estimates and recent revisions (up or down), quality and sustainability of reported earnings, and various return ratios. It helps us predict relative performance over the next 3-6 months.
In addition, SectorCast computes a Bull Score and Bear Score for each ETF based on recent price behavior of the constituent stocks on particularly strong and weak market days. A high Bull score indicates that stocks within the ETF recently have tended toward relative outperformance when the market is strong, while a high Bear score indicates that stocks within the ETF have tended to hold up relatively well (i.e., safe havens) when the market is weak.
Outlook score is forward-looking while Bull and Bear are backward-looking. As a group, these three scores can be helpful for positioning a portfolio for a given set of anticipated market conditions. Of course, each ETF holds a unique portfolio of stocks and position weights, so the sectors represented will score differently depending upon which set of ETFs is used. We use the iShares that represent the ten major U.S. business sectors: Financials (IYF), Technology (IYW), Industrials (IYJ), Healthcare (IYH), Consumer Staples (IYK), Consumer Discretionary (IYC), Energy (IYE), Basic Materials (IYM), Telecommunications (IYZ), and Utilities (IDU). Whereas the Select Sector SPDRs only contain stocks from the S&P 500 large cap index, I prefer the iShares for their larger universe and broader diversity.
Here are some of my observations on this week’s scores:
1. The rankings are once again led by Energy, with an Outlook score this time of 90. Although the sector has seen the highest amount of net cuts to forward EPS estimates, it tops the factor rankings for forward P/E (the lowest and only single digit at 9.7x) and is among the highest in return ratios, YoY projected EPS growth rate (11.8%), and the lowest forward PEG (forward P/E divided by projected EPS growth rate) of 0.82. Defensive sector Consumer Staples comes in second with the best analyst sentiment (the only sector to see positive net revisions to EPS estimates) and good return ratios. Rounding out the top six are Healthcare, Technology, Consumer Discretionary, and Industrials.
2. At the bottom are Utilities, Financials, and Telecom. Utilities has a low (but stable) projected EPS growth rate of only 7.3%, yet it has been bid up to a high forward P/E of 20.7x (behind only high-growth Technology and Consumer Discretionary sectors) by income-seeking investors for its dividend yield, which makes it popular as a bond alternative. Financials and Telecom both have forward P/Es around 12x, but otherwise score poorly, as the low valuations are offset by long EPS growth rates.
3. Looking at the Bull scores, Technology has by far the top score of 66, as stocks within this sector have displayed relative strength on strong market days (as investor interest has resurged during the current market rally). Consumer Staples scores the lowest at 42. The top-bottom spread is 24 points, which reflects low sector correlations on strong market days. It is desirable in a healthy market to see low correlations reflected in a top-bottom spread of at least 20 points, which indicates that investors have clear preferences in the market segments and stocks they want to hold.
4. Looking at the Bear scores, Consumer Staples scores the highest at 64, followed by Healthcare at 60, as stocks within these sectors have been the preferred safe havens on weak market days. Technology displays the lowest score of 38, as investors have fled the sector during any whiff of market weakness. The top-bottom spread is 26 points, which reflects low sector correlations on weak market days. Ideally, certain sectors will hold up relatively well while others are selling off (rather than broad risk-off behavior), so it is desirable in a healthy market to see low correlations reflected in a top-bottom spread of at least 20 points.
5. Energy displays the best all-around combination of Outlook/Bull/Bear scores, while Utilities is the worst. Looking at just the Bull/Bear combination (investor sentiment indicator), the script flips 180 degrees, with Utilities surprisingly displaying the highest score, indicating superior and consistent relative performance (on average) in extreme market conditions whether bullish or bearish, while Energy is the worst.
6. This week’s fundamentals-based Outlook rankings display a mostly neutral bias given that defensive, economically sensitive, cyclical, and “all weather” are ranked all over the map. The highs scores for economically sensitive Energy and Technology are offset by low scores for Financials and Materials, while Consumer Discretionary and Industrials sit right in the middle. At the same time, the high score for defensive Consumer Staples is offset by the low scores for Utilities and Telecom. Keep in mind, the Outlook Rank does not include timing, momentum, or relative strength factors, but rather reflects the consensus fundamental expectations at a given point in time for individual stocks, aggregated by sector.
By the way, if you have an interest in our quant rankings, we have a new product close to rollout called Sabrient SmartSheets—one for individual stocks and one for ETFs. They can be delivered weekly in Excel format and are helpful for learning how your stocks and ETFs score in our various alpha factors…or for identifying the top-ranked stocks and ETFs for each alpha factor (or for weighted combinations of the factors at your choosing). Shoot me a note to see sample files and learn more.
ETF Trading Ideas:
Our Sector Rotation model, which appropriately weights Outlook, Bull, and Bear scores in accordance with the overall market’s prevailing trend (bullish, neutral, or defensive), retains its neutral posture. This suggests holding Energy (IYE), Consumer Staples (IYK), and Healthcare (IYH), in that order. (Note: In this model, we consider the bias to be neutral from a rules-based trend-following standpoint when SPY is between its 50-day and 200-day simple moving averages.)
If you prefer a defensive bias, the Sector Rotation model suggests holding the same three, but in a different order: Consumer Staples, Healthcare, and Energy. Or, if you are more aggressively pursuing a bullish stance, the model suggests holding Technology (IYW), Energy, and Industrials (IYJ), in that order [although Consumer Discretionary (IYC) is right in there, too]. You can see that Energy is suggested for all 3 scenarios.
An assortment of other interesting ETFs that are scoring well in our latest rankings include: First Trust Natural Gas (FCG), Invesco DWA Technology Momentum (PTF), Innovator IBD Breakout Opportunities (BOUT), Invesco DWA Energy Momentum (PXI), Pacer US Large Cap Cash Cows Growth Leaders (COWG), SPDR S&P Oil & Gas Exploration & Production (XOP), Direxion Daily S&P Oil & Gas Exp & Prod Bull 2X Shares (GUSH), iShares MSCI Agriculture Producers (VEGI), WBI BullBear Quality 3000 (WBIL), Alpha Architect US Quantitative Momentum (QMOM), Putnam BDC Income (PBDC), WBI BullBear Value 3000 (WBIF), Innovator IBD 50 (FFTY), Inspire Fidelis Multi Factor (FDLS), First Trust Energy AlphaDEX (FXN), American Century STOXX US Quality Growth (QGRO), Invesco BLDRS Emerging Markets 50 ADR Index (ADRE), SmartETFs Dividend Builder (DIVS), Invesco S&P SmallCap Energy (PSCE), AdvisorShares Hotel (BEDZ), First Trust Expanded Technology (XPND), iShares MSCI Water Management MultiSector (IWTR), FCF US Quality (TTAC), JPMorgan Sustainable Consumption (CIRC), ETC 6 Meridian Quality Growth (SXQG), Trajan Wealth Income Opportunities (TWIO), and APEX Healthcare (APXH). All score in the top decile (90-100) of Outlook scores.
As always, I welcome your thoughts on this article! Please email me anytime. Any and all feedback is appreciated! In particular, what sections you find the most valuable—commentary, chart analysis, SectorCast scores, or ETF trading ideas / sector rotation model? Also, please let me know of your interest in a Sabrient index for TAMP or ETF investing…or in the new Sabrient SmartSheets to our full rankings of stocks and ETFs!
IMPORTANT NOTE: I post this information periodically as a free look inside some of our institutional research and as a source of some trading ideas for your own further investigation. It is not intended to be traded directly as a rules-based strategy in a real money portfolio. I am simply showing what a sector rotation model might suggest if a given portfolio was due for a rebalance, and I do not update the information on a regular schedule or on technical triggers. There are many ways for a client to trade such a strategy, including monthly or quarterly rebalancing, perhaps with interim adjustments to the bullish/neutral/defensive bias when warranted, but not necessarily on the days that I happen to post this article. The enhanced strategy seeks higher returns by employing individual stocks (or stock options) that are also highly ranked, but this introduces greater risks and volatility. I do not track performance of the ideas mentioned here as a managed portfolio.
Disclosure: At the time of this writing, of the securities mentioned, the author held positions (both longs and shorts) in UUP, UNG, XOP, PSCE, GDX, XLF, TLT, ARKK, and GBTC.
Disclaimer: Opinions expressed are the author’s alone and do not necessarily reflect the views of Sabrient. This newsletter is published solely for informational purposes and is not to be construed as advice or a recommendation to specific individuals. Individuals should take into account their personal financial circumstances in acting on any opinions, commentary, rankings, or stock selections provided by Sabrient Systems or its wholly owned subsidiary, Gradient Analytics. Sabrient makes no representations that the techniques used in its rankings or analysis will result in or guarantee profits in trading. Trading involves risk, including possible loss of principal and other losses, and past performance is no indication of future results.