Sector Detector: Investors revel in a Goldilocks outlook on economy, earnings, and Fed policy
 by Scott Martindale
President & CEO, Sabrient Systems LLC
Stocks are pulling back a bit to start Q2 but have shown remarkable resilience throughout their nearly 6-month (and nearly straight-up) bull run, with the S&P 500 (SPY) finding consistent support at its 20-day simple moving average on several occasions, while the slightly more volatile Nasdaq 100 (QQQ, beta=1.18) has found solid support at the 40-day moving average. Moreover, the Relative Strength Index (RSI) on SPY has reliably bounced off the neutral line (50) on every test. And it all happened again early last week—at least until Thursday afternoon when Minnesota Fed president Neel Kashkari ventured off Fed chairman Jerome Powell’s carefully crafted script to say they may not cut interest rates at all this year if inflation’s decline continues to stall.
Before that moment, Powell had been keeping his governors in line and saying all the right things about imminent rate cuts in the pipeline (albeit making sure not to provide a firm timetable). And the pervasive Goldilocks outlook has lifted stocks to uncomfortably elevated valuations (current forward P/E for SPY of 21.3x and for QQQ of 26.6x) that suggest a need for and expectation of both solid earnings growth in 2024-25 and falling interest rates (as the discount rate on future earnings streams).
Up until Kashkari’s unexpected remarks, it appeared that once again—and in fact every time since last November, when the indexes look extremely overbought and in need of a significant pullback (as typically happens periodically in any given year) a strong bid arrived like the Lone Ranger to save the day and push stocks higher. It has burned bears and kept swing traders who like to “fade” spikes hesitant. Not surprisingly, the CBOE Volatility Index (VIX) has seen only a couple of brief excursions above the 15 line and has been nowhere near the 20 “fear threshold.”
But after his remarks, the market finished Thursday with a huge, high-volume, “bearish engulfing candle,” and the CBOE Volatility Index (VIX) surged 20% intraday (closing at 16.35), and all those previously reliable support levels gave way—until the very next day. On Friday, they quickly recovered those support levels following the apparently strong March jobs report, finishing with a “bullish harami” pattern (that typically leads to some further upside). As you recall from my March post, I have felt a correction is overdue—and the longer it holds off, the more severe the fall. The question now is whether SPY and QQQ are destined for an upside breakout to new highs and a continuation of the bull run…or for a downside breakdown to test lower levels of support. I believe we may get a bit of a bounce here, but more downside is likely before an eventual resumption in the bull run to new highs.
Regardless, the persistent strength in stocks has been impressive, particularly in the face of the Fed's quantitative tightening actions (balance sheet reduction and “higher for longer” rates)—along with the so-called “bond vigilantes” who protest excessive spending by not buying Treasuries and thus further driving up rates—that have created the highest risk-free real (net of inflation) interest rates since the Financial Crisis and reduced its balance sheet by $1.5 trillion from its April 2022 peak to its lowest level since February 2021.
But (surprise!) gold has been performing even better than either SPY or QQQ (as have cryptocurrencies, aka “digital gold”). Gold’s appeal to investors is likely in anticipation of continued buying by central banks around the world as a hedge against things like growing geopolitical turmoil, our government’s increasingly aggressive “weaponization” of the dollar to punish rogue nations, and rising global debt leading to a credit or currency crisis.
To be sure, solid GDP and employment data, a stall in inflation’s decline, rosy earnings growth forecasts for 2024-2025, tight investment-grade and high-yield credit spreads, low volatility in interest rates, a low VIX, and a sudden recovery in manufacturing activity, with the ISM Manufacturing Index having finally eclipsed the 50 threshold (indicating expansion) after 16 straight months below 50 (contraction), all beg the question of why the Fed would see a need to cut rates. As Powell himself said the other day, we have seen an unusual and unforeseen occurrence in which “productive capacity is going up even more than actual output. The economy actually isn't becoming tighter; it's actually becoming a little looser…” Indeed, the “higher for longer” mantra might seem more appropriate, at least on the surface.
Yet despite the rosy outlook and investor confidence/complacency (and Kashkari’s latest comments), the Fed continues to suggest there will be multiple rate cuts this year, as if it knows of something lurking in the shadows. And that something might be a credit crisis stemming from our hyper-financialized/ultra-leveraged economy—and the growing debt burden across government, small business, and consumers being refinanced at today’s high interest rates. We are all aware of the outright depression in commercial real estate today; perhaps there is a contagion lurking. Or perhaps it’s the scary projection for the federal debt/GDP ratio (rising from 97% of GDP last year to 166% by 2054). Or perhaps it is a brewing currency crisis with the Japanese yen, given its historic weakness that may lead the BOJ to hike rates to stem capital outflows. Or perhaps it’s because they follow the real-time “Truflation” estimate, which indicates a year-over-year inflation rate of 1.82% in contrast to the latest headline CPI print of 3.2% and headline PCE of 2.5%.
I discuss all these topics in today’s post, as well as the relative performance of various equity and asset-class ETFs that suggests a nascent market rotation and broadening may be underway, which is a great climate for active managers. Likewise, Michael Wilson of Morgan Stanley asserts that the stock rally since last fall has been driven more by loose financial conditions, extreme liquidity (leverage), and multiple expansion (rather than earnings growth), but now it's time to be a stock picker rather than a passive index investor.
So, if you are looking outside of the cap-weighted passive indexes (and their elevated valuation multiples) for investment opportunities, let me remind you that Sabrient’s actively selected portfolios include the Baker’s Dozen (a concentrated 13-stock portfolio offering the potential for significant outperformance), Small Cap Growth (an alpha-seeking alternative to the Russell 2000 index), and Dividend (a growth plus income strategy paying a 3.74% current yield). The latest Q1 2024 Baker’s Dozen launched on 1/19/24 and remains in primary market until 4/18/24 (and is already well ahead of SPY).
Click here to continue reading my full commentary in which I also discuss Sabrient’s latest fundamentals based SectorCast quantitative rankings of the ten U.S. business sectors (which continue to be led by Technology), current positioning of our sector rotation model (which turned bullish in early November and remains so today), and several top-ranked ETF ideas. Or if you prefer, here is a link to this post in printable PDF format (as some of my readers have requested). Please feel free to share my full post with your friends, colleagues, and clients! You also can sign up for email delivery of this periodic newsletter at Sabrient.com.
By the way, Sabrient founder David Brown has a new book coming out soon through Amazon.com in which he describes his approach to quantitative modeling and stock selection for four distinct investing strategies (Growth, Value, Dividend, and Small Cap). It is concise, informative, and a quick read. David has written a number of books through the years, and in this new one he provides valuable insights for investors by unveiling his secrets to identifying high-potential stocks. Please let me know if you’d like to be an early book reviewer!
Market commentary:
Stocks have hit record high after record high this year in near-monotonic fashion, driven by rising productivity, low unemployment, inflation trending down (albeit stalled for the moment), and expectations of imminent Fed rate cuts—not to mention those massive government spending programs, student debt forgiveness (despite not being authorized by Congress), and a rising budget deficit (around 6.3% of GDP, with interest on the debt surging to 2.4% of GDP). Like 2023, there has been narrow leadership by the mega-caps and with large-cap indexes beating small-mid caps, especially high-quality growth. Michael Wilson of Morgan Stanley observed that it has included companies across all industries and has been company-specific (which he calls, “haves and have-nots”), which is a great environment for active managers. Only four S&P sectors are outperforming YTD: Energy, Communication Services, Financials, and Industrials.
The table below compares the 2024YTD performance of ETFs representing various asset classes and equity styles. No surprise that bitcoin has led the way, given its huge surge. Agriculture, oil, communication services, large-cap growth, gold, financials, and industrials have all outperformed the S&P 500 and Nasdaq 100 so far this year, while technology, consumer discretionary, small caps, bonds, and “bond proxies” (including REITs, utilities, consumer staples, and other high-dividend payers) have trailed—some of them pretty badly.
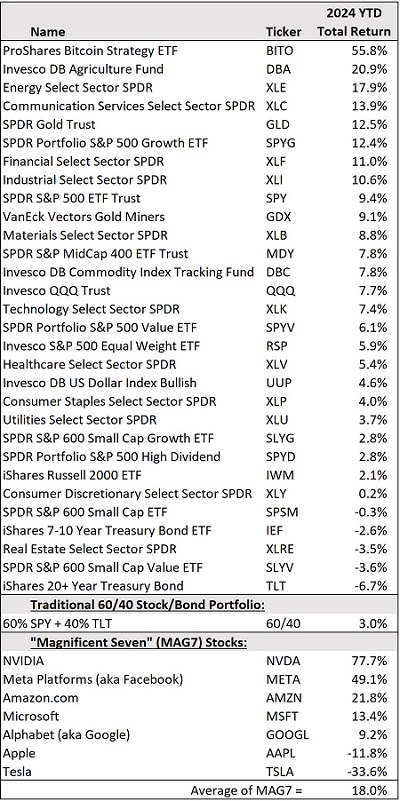
In addition, the broadening we started to see towards the end of last year—as displayed by Invesco S&P 500 Equal Weight (RSP) and iShares Russell 2000 (IWM)—has taken a back seat this year to the mega caps, led by “Magnificent Seven” (MAG7) titans NVIDIA (NVDA), Meta Platforms (META, nee Facebook), and Amazon.com (AMZN). NVDA’s amazing performance has even outdone the incredible surge in bitcoin. But not all the MAG7 are pulling their weight for membership in the prestigious club, particularly Apple (AAPL) and Tesla (TSLA)—although Apple’s huge market cap makes its underperformance more impactful on the cap-weighted index performance (e.g., SPY and QQQ).
Notably, only 39% of the S&P 500 stocks are beating the index this year. According to an analysis by Sentimentrader, the one-year performance of the RSP/SPY price ratio shows that equal-weight RSP has been underperforming cap-weight SPY by nearly an historical extreme since the study began in 1958—and the highest percentage since the Internet bubble. This suggests to them a resumption in last year’s nascent mean reversion and rotation into other (non-mega-cap-Tech) companies and sectors.
As for the US Dollar Index (DXY), it is up about +4.5% this year, even though it tends to move opposite SPY with an inverse correlation (averaging -0.50 and growing more negative over the past six years). In general, this is primarily due to the many multinational companies in the index that earn a high proportion of their sales overseas and then exchange those foreign currencies for dollars (so a weaker dollar means the sales translate into more dollars on the conversion). However, as shown in the chart below (post-pandemic), there have been two brief timeframes during the past four years in which they both moved up together—the last several months of 2021 and this year.
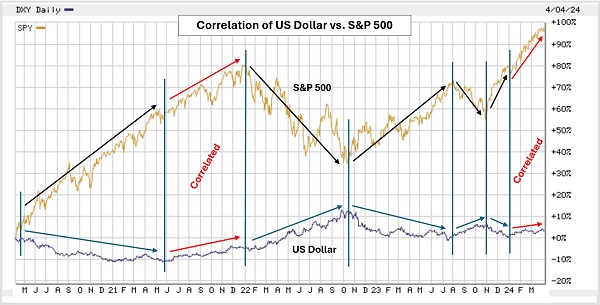
Thus, assuming a resumption of their inverse correlation, any significant strengthening in the dollar from here would likely be detrimental to stock prices, particularly given stocks’ elevated valuations. Forward P/E ratios of 21.3x for SPY and 26.6x for QQQ. However, rather than a broad selloff, it could simply lead to a return to the broadening action we saw toward the end of last year, given that the more attractive forward P/Es for equal-weight and small-mid ETFs, including RSP at 17.5x, Direxion Nasdaq 100 Equal Weighted (QQQE) at 24.3x, IWM at 15.8x, and SPDR S&P 600 Small Cap at 14.4x.
Furthermore, the past couple of years have displayed a marked increase in correlation between stock and bond prices, but 2024 so far has displayed the opposite, with a surge in bond yields concurrent with stock prices driven by ongoing Fed QT but also by the “bond vigilantes” holding out on purchasing Treasuries in protest of profligate government spending (I talk more about spending in my Final Comments section below).
At the same time, many stock investors are fearful that perhaps the Fed won’t cut rates as previously telegraphed due to both surprisingly robust economic reports and a fear of rekindled inflationary pressures from government spending and/or supply chain upsets (from war, terrorism, and other forms of geopolitical turmoil). As such, a rising dollar has become increasingly correlated with rising interest rates (and falling bond prices). Using the calculator on PortfolioVisualizer.com, the 12-month rolling correlation of the dollar with long-term rates has risen from roughly -0.75 (strong inverse correlation) to +0.75 (strong positive correlation) over the past 10 years. So, if the pendulum swings back in a “reversion to the mean” and the former inverse correlation, it may suggest a weakening dollar with rising rates…or a strengthening dollar with falling rates.
Meanwhile, even though defaults on leveraged bank loans have been rising and S&P Global has reduced the credit rating to negative for nine regional banks, credit spreads across the bond quality spectrum have remained at historically low levels. According to DataTrek, this suggests that the typically risk-averse bond market expects stable or rising earnings over the next couple of years, since weakness in high-yield bonds is often considered the “canary in the coal mine” for stocks. Indeed, FactSet recently reported that S&P 500 companies made smaller cuts to forward estimates than normal and now expects them to earn $244 in CY2024 and $276 in CY2025.
Employment and inflation:
The apparently strong March jobs report triggered a relief rally last Friday by beating expectations. 303,000 new jobs were created, buoyed by 71,000 government jobs (23%) plus a bunch of private sector jobs funded by government deficit spending (largely in manufacturing). So, it appears that rather than organic economic growth, the government has been buying many of our jobs and much of our GDP growth. Moreover, most of the new private sector jobs are in healthcare, hospitality, and construction, which are mostly lower-paying and part-time (+7.5% YoY), while the higher-paying full-time jobs in technology and finance sectors have seen net layoffs (-1.3% YoY), which is cause for concern. So, this “great” jobs report might be a bit of a mirage.
The New York Fed’s Global Supply Chain Pressure Index (GSCPI) measures the number of standard deviations from the historical average value (aka Z-score) and generally foreshadows movements in inflation metrics. It has remained calm despite disruptions to shipping due to war in Ukraine and Gaza and Houthi missiles in the Red Sea. GSCPI peaked in Dec 2021 at an all-time high of +4.31 and then rapidly plummeted to a deeply negative May 2023 level of -1.57. Recently, GSCPI has been consolidating but has remained at or below its historical average (zero line) with readings of +0.10 for February, -0.11 for January, -0.15 for December, and +0.13 for November, suggesting that supply chain pressures are now firmly back down to the long-run average—which, as a precursor to producer prices, has kept the PPI low and suggests that CPI should resume its gradual retreat.
The latest year-over-year (YoY) headline CPI, PPI, and PCE for February came in at 3.2%, 0.6%, and 2.5%, respectively. But because the Fed can do little about energy and food prices, the FOMC thinks it’s best to focus on core inflation (excluding food & energy), as do I. Also, I like to compute 3-month rolling annualized since it better reflects the current trend. Core CPI and PCE have fallen dramatically from their highs while 10-year Treasury yield has risen, thus lifting real yields (which is great for savers but bad for borrowers—and we are a highly indebted society).
In December, 3-month annualized headline CPI came in at only +1.79% and Core CPI +3.33%, while the Fed’s preferred metric Core PCE showed a 3-mo annualized average of +2.16%. Since then, inflation readings have ticked up, mainly due to sticky shelter costs (which compose 33% of CPI and 17% of PCE). Although YoY Core PCE was only +2.78% in February, 3-mo annualized Core PCE was +3.48%, Core CPI +4.18%, and headline CPI +3.99%, largely reflecting one-time, first-of-year resets in services prices like insurance premiums and restaurant menus. Regardless, all 3-month average annualized readings seem to be back to chopping within the pre-pandemic range of roughly 0-4% (shown on the chart).
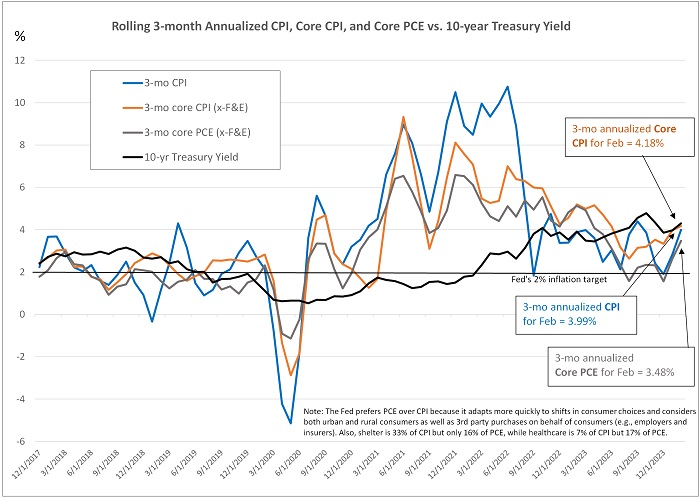
Because supply chain pressures impact product prices (PPI), which in turn impact consumer prices (CPI and PCE), and because PPI and CPI both have a long-run average (over the past 13 years) of around +2.6%, it seems logical and likely to me that PPI and CPI, will eventually converge toward the +2.0% level (or even lower). In fact, if you compute the average of the latest PPI/CPI readings of +0.6% and +3.2%, it equals +1.8%—which seems like a logical target for convergence.
Moreover, an interesting alternative measure of inflation is the Truflation project, which is a blockchain-based financial data service that uses real-time market prices from a variety of sources, rather than the usual metrics that often have long lag times (like shelter costs). According to its website, “Truflation offers a more reliable view of inflation, contrasting with government metrics that have outdated methodologies and limited transparency. With over 10 million data points, it updates daily and has a dynamic methodology that responds to global market conditions.” So, where is it today? As of 4/8/24, Truflation shows a YoY inflation rate of +1.80%, versus the latest headline CPI reading of +3.2%. Perhaps the Fed has been quietly monitoring this metric.
We will see what this week’s CPI and PPI readings show. But I continue to believe disinflationary trends will continue to manifest and that the Fed will soon begin normalizing fed funds rate toward a “neutral rate” of around 3.0% nominal (i.e., 2% target inflation plus 1.0% r-star) versus 5.25–5.50% today. This would be appropriate so that borrowers (including our federal government!) can better handle their debt burdens (and stave off a triggering event for a credit crisis) while fixed income investors also can receive a reasonable real yield (i.e., above the inflation rate) so they don’t have to take on undue risk to achieve meaningful income.
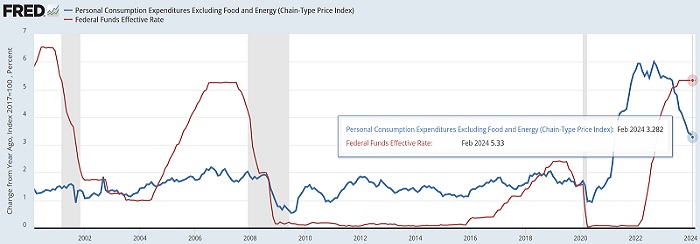
But as it stands today, high real yields have created the “tightest” Fed policy since 2007—as illustrated in the chart below comparing the effective fed funds rate to Core PCE (less food & energy) and reflecting a 2.05% real yield. Again, this has been great for savers but bad for borrowers—and another reason why the Fed has taken on a more dovish tone.
Final comments:
Despite the rosy outlook and investor complacency, the Fed continues to hint at multiple rate cuts this year, as if it knows something troublesome is brewing in the shadows. Perhaps it’s potential fallout from the CRE depression; or a potential currency crisis triggered by the Japanese yen; or the mirage of strong jobs growth; or the growing federal debt and rising debt/GDP ratio, which threatens to begin choking off growth at some point—as 1/3 of the annual budget must now be used to simply pay the interest on debt. Today, the federal debt is $34 trillion, or about 99% of GDP, and the CBO expects the debt/GDP ratio to exceed 116% by 2034, which is even higher than during World War II. And by 2054, it projects 166% debt/GDP.
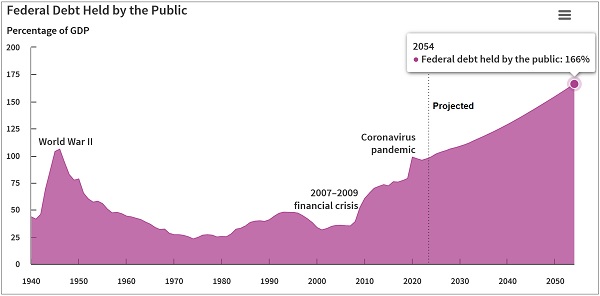
Frighteningly, we now pay over $1 trillion/year (or 1/3 of tax revenue) in interest expense to service $34 trillion of federal debt, and we will have to borrow about 5% of GDP every year for at least the next 10 years to pay today’s bills, passing on the burden to future generations. And that doesn’t even consider all the other unfunded liabilities the government has committed to dole out. According to The Hill, our total unfunded liabilities—comprising the federal debt as well as promised programs like Social Security, Medicare, employee pensions, and veterans’ benefits—is estimated to be around $212 trillion. This is up from $122 trillion in 2019 and growing fast. And that doesn’t include the massive municipal pension liabilities and state budget shortfalls that might eventually need bailouts.
What could save us, i.e., reverse the rising federal debt/GDP ratio? Well, raising tax rates isn’t a good solution. As DataTrek recently observed, “Regardless of individual and corporate tax rates, Federal receipts have averaged 17% of GDP since 1960. Economic growth is the only reliable way to increase government revenues.” In other words, higher tax rates are offset by lower production, while lower tax rates are offset by higher production—which suggests perhaps government should just set an attractive tax rate that stimulates economic growth and get out of the way.
So, simply put, the economy (GDP) must grow faster than the budget (spending), or ideally a combination of both falling spending and rising GDP—led by enhanced productivity.
Regarding spending, RFK, Jr. has opined, “The long-term issue is spending, because inflation and high interest rates are just medicine, and they both are poisonous medicines.” So said Barry Sternlicht, CEO of Starwood Capital, “Congress [needs] to stop spending money like drunken sailors…You have one part of the government with a foot on the brake—the Federal Reserve and Powell—and then you have the other part of the government—the legislature—spending as much money as they can.”
Regarding productivity, it can be boosted by businesses investing in R&D, training, and employee benefits. But of course, this is also where the huge promise of artificial intelligence (AI) and machine learning (ML) comes in. What you see today with the likes of ChatGPT is barely scratching the surface of what is coming just in the next few years, much less 20 years from now. The big opportunity will be when AI adoption accelerates across industries, driving productivity and cost-efficiency. Elon Musk has called AI, “The most disruptive force in history.”
Although we know that the impact of Generative AI/ML on society, commerce, jobs, and GDP through enhanced productivity, innovation, efficiency, and profit margins will be immense, it’s still too early to know exactly how immense it will be and the timing of it all. So, we are at a speculative point in time, much like the dawn of the Internet Age in the early 1990’s. This applies not just to AI/ML, but to the other emerging technologies of the 2020’s like cryptocurrency, blockchain, distributed ledger technologies (DLTs), and quantum computing.
But perhaps the biggest unknown is not so much politics and the restrictions placed on AI applications, but on how the enormous incremental power requirements (mostly for data centers) will be fulfilled given our already tenuous situation today (re: brownouts and rolling blackouts during peak power usage times around the country). This will require high-efficiency/high-“transformity” energy sources to power it all, which might initially entail small, localized, natural gas generators, as well as small modular nuclear reactors (SMRs) that employ advanced nuclear fission technology. But eventually there should be a major acceleration in the development of safe, clean, zero-waste, perpetual-energy, nuclear fusion reactors.
Blockchain, too, will become an integral part of this transition in energy distribution from a centralized grid run by a handful of utility companies to a decentralized grid owned by individuals. This is just one of many applications, including digital transactions, contracts, data storage, and record keeping in the financial markets, real estate, and even politics (such as eliminating voting fraud).
So, given where we stand today on the cusp of such disruptive innovation, is it any wonder that cryptocurrencies are seeing rapid capital inflows? Although it is partly due to the bitcoin “halving” events, the many growing use cases, and enhanced investor access through new ETFs (which enables broad institutional adoption), I might also point to its use as a store of value in the face of unfettered government “money printing” to fund deficit spending.
As fiat currencies become devalued, hard assets are viewed as safe havens. This has led not just to the surge in gold, silver, and real estate prices, but also cryptocurrencies, led by bitcoin and ether as well as many other emerging “altcoins.” And as high-speed and low-latency 5G cellular communications continues to expand, the complex “mining” transactions are better able to occur faster and in real time. This enables cryptocurrencies to expand their real-world applications, adding to their value.
Lastly, while they are still free to download, I invite you to examine our new product Sabrient Scorecards (previously called SmartSheets until we discovered a trademark conflict)—one for individual stocks and one for ETFs, we have expanded the content to include Top 30 lists for each of a variety of our potent quantitative scores. Notably, we have further enhancements in the pipeline to help investors and advisors with stock search, fundamental screening, idea generation, risk monitoring, and confirmation. These sheets are posted weekly in Excel format and show how your stocks and ETFs score in our various alpha factors…or for identifying the top-ranked stocks and ETFs for each alpha factor (or for weighted combinations of the factors). Please check them out and share your feedback with me!
Latest Sector Rankings:
Relative sector rankings are based on our proprietary SectorCast model, which builds a composite profile of each of over 1,000 equity ETFs based on bottom-up aggregate scoring of the constituent stocks. The Outlook Score is a Growth at a Reasonable Price (GARP) model that employs a forward-looking, fundamentals-based multifactor algorithm considering forward valuation, historical and projected earnings growth, the dynamics of Wall Street analysts’ consensus earnings estimates and recent revisions (up or down), quality and sustainability of reported earnings, and various return ratios. It helps us predict relative performance over the next 3-6 months.
In addition, SectorCast computes a Bull Score and Bear Score for each ETF based on recent price behavior of the constituent stocks on particularly strong and weak market days. A high Bull score indicates that stocks within the ETF recently have tended toward relative outperformance when the market is strong, while a high Bear score indicates that stocks within the ETF have tended to hold up relatively well (i.e., safe havens) when the market is weak. Outlook score is forward-looking while Bull and Bear are backward-looking.
As a group, these three scores can be helpful for positioning a portfolio for a given set of anticipated market conditions. Of course, each ETF holds a unique portfolio of stocks and position weights, so the sectors represented will score differently depending upon which set of ETFs is used. We use the iShares that represent the ten major U.S. business sectors: Financials (IYF), Technology (IYW), Industrials (IYJ), Healthcare (IYH), Consumer Staples (IYK), Consumer Discretionary (IYC), Energy (IYE), Basic Materials (IYM), Telecommunications (IYZ), and Utilities (IDU). Whereas the Select Sector SPDRs only contain stocks from the S&P 500 large cap index, I prefer the iShares for their larger universe and broader diversity.
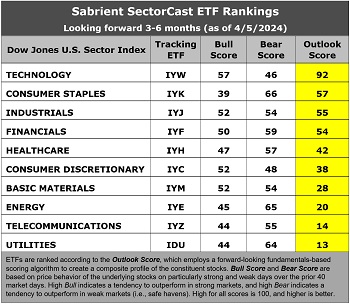
The latest fundamentals-based Outlook rankings continue to display a bullish bias given the predominance of economically sensitive and “deep cyclical” sectors at the top. Despite a high forward P/E of 28.2x, Technology (IYW) remains by far the top ranked sector with a robust Outlook score of 92, given its strong EPS growth estimates (17.7%), its relatively modest forward PEG (forward P/E to EPS growth ratio) of 1.59, consistently positive earnings revisions from the Wall Street analyst community, the best return ratios, and the best insider sentiment (open market buying).
Then, there’s a big drop-off to the next three who are bunched together: Consumer Staples (IYK) with an Outlook score of 57, Industrials (IYJ) at 55, and Financials (IYF) at 54. Healthcare rounds out the top 5 with a score of 42. Notably, Financials enjoys the best analyst sentiment (positive EPS revisions), one of the lowest forward P/Es (14.0x), and the lowest forward PEG (1.46).
Another positive is that other “deep cyclical” sectors—Energy (IYE) and Basic Materials (IYM)—have pulled up from the bottom two as oil and some commodity prices (e.g., lumber, copper, gold, silver) have firmed (and others are expected to do so this year), and they have been replaced there by defensive sectors Telecom (IYZ) and Utilities (IDU).
Keep in mind, the Outlook Rank does not include timing, momentum, or relative strength factors, but rather reflects the consensus fundamental expectations at a given point in time for individual stocks, aggregated by sector.
ETF Trading Ideas:
Our rules-based Sector Rotation model, which appropriately weights Outlook, Bull, and Bear scores in accordance with the overall market’s prevailing trend (bullish, neutral, or defensive), maintains its bullish bias as the market rally rages on. It has been bullish since early November. The model suggests holding Technology (IYW), Industrials (IYJ), and Financials (IYF), in that order. (Note: In this model, we consider the bias to be bullish from a rules-based trend-following standpoint when SPY is above both its 50-day and 200-day simple moving averages, but neutral if it is between those SMAs while searching for direction, and defensive if below both SMAs.)
If you prefer a neutral bias, the Sector Rotation model suggests holding Technology, Consumer Staples (IYK), and Industrials. Or, if you prefer to take a defensive stance on the market, the model suggests holding Consumer Staples, Energy (IYE), and (surprise!) Financials, in that order—although Utilities (IDU) is a close fourth.
An assortment of other interesting ETFs that are scoring well in our latest rankings include: Invesco Building & Construction (PKB), KraneShares CSI China Internet (KWEB), Innovator IBD 50 (FFTY), Inspire Fidelis Multi Factor (FDLS), First Trust Dow Jone International Internet (FDNI), iShares Factors US Growth Style (STLG), Donoghue Forlines Innovation (DFNV), Invesco Dorsey Wright Technology Momentum (PTF), Fidelity Disruptive Communications (FDCF), AdvisorShares Gerber Kawasaki (GK), VanEck BDC Income (BIZD), Invesco Dorsey Wright Consumer Cyclicals Momentum (PEZ), EMQQ Emerging Markets Internet & eCommerce (EMQQ), ERShares Entrepreneurs (ENTR), TrueShares Technology, AI & Deep Learning (LRNZ), WealthTrust DBS Long Term Growth (WLTG), AdvisorShares Hotel (BEDZ), Invesco Alerian Galaxy Crypto Economy (SATO), Invesco S&P MidCap Quality (XMHQ), iShares Expanded Tech Sector (IGM), PGIM Jennison Better Future (PJBF), ProShares Global Listed Private Equity (PEX), SPDR S&P Insurance (KIE), and Defiance Hotel, Airline, and Cruise (CRUZ). All score in the top decile (90-100) of Outlook scores.
As always, I welcome your thoughts on this article! Please email me anytime. Any and all feedback is appreciated! In particular, please tell me what sections you find the most valuable—commentary, SectorCast scores, or ETF trading ideas / sector rotation model. Also, please let me know of your interest in:
1. a Sabrient index for ETF investing (we offer a 10-index Quality Index Series)
2. the new Sabrient Scorecards with our full rankings of stocks and ETFs
3. having me speak at your event (topics range from the economy and stocks, the energy sector, China’s tough economic situation, to career success secrets for young professionals)
IMPORTANT NOTE: I post this information periodically as a free look inside some of our institutional research and as a source of some trading ideas for your own further investigation. It is not intended to be traded directly as a rules-based strategy in a real money portfolio. I am simply showing what a sector rotation model might suggest if a given portfolio was due for a rebalance, and I do not update the information on a regular schedule or on technical triggers. There are many ways for a client to trade such a strategy, including monthly or quarterly rebalancing, perhaps with interim adjustments to the bullish/neutral/defensive bias when warranted, but not necessarily on the days that I happen to post this article. The enhanced strategy seeks higher returns by employing individual stocks (or stock options) that are also highly ranked, but this introduces greater risks and volatility. I do not track performance of the ideas mentioned here as a managed portfolio.
Disclosure: At the time of this writing, of the securities mentioned, the author held short positions in SPY, QQQ, and IWM, and long positions in NVDA, TLT, gold, silver, oil, and various cryptocurrencies.
Disclaimer: Opinions expressed are the author’s alone and do not necessarily reflect the views of Sabrient. This newsletter is published solely for informational purposes and is not to be construed as advice or a recommendation to specific individuals. Individuals should take into account their personal financial circumstances in acting on any opinions, commentary, rankings, or stock selections provided by Sabrient Systems. Sabrient makes no representations that the techniques used in its rankings or analysis will result in or guarantee profits in trading. Trading involves risk, including possible loss of principal and other losses, and past performance is no indication of future results.