 by Scott Martindale
President & CEO, Sabrient Systems LLC
Overview:
The year began with impressive strength and resilience in risk assets despite all the uncertainties around tariffs, trade wars, hot wars, slowing GDP growth, inflation, stagflation, AI impact and capex, and myriad other concerns. The US was considered the rock in a recessionary world, attracting massive foreign capital flight (according to Nasdaq, total foreign holdings of US equities as of June 2024 was $17 trillion—almost double versus 2019). But once the dam broke, stocks, crypto, and the US dollar started melting down in a “waterfall decline” culminating in a “flash crash” on Monday with the CBOE Volatility Index (VIX) nearly hitting 30 before closing at 27.86. As the adage goes, “Stocks take the stairs up and the elevator down.” But I believe this is a valuation-driven correction, as stocks had become “priced for perfection,” and the rapid meltdown ultimately will give way to a gradual melt-up, driven by rising global liquidity, a weaker US dollar, reduced wasteful government spending, lower tax and interest rates, less regulatory red tape, and the “animal spirits” of a rejuvenated private sector and housing market.
Prop desks and algorithmic trading systems hit sell stops to exacerbate the selloff, with many flipping from long to short exposure, and markets imploded as average investors quickly swung from extreme greed to extreme fear. According to Real Investment Advice, “The last time the market was this oversold and 3 standard deviations below the [50-day moving average] was in August of last year during the 10% correction as the Yen Carry Trade erupted.” The AAII weekly sentiment survey hit a bearish extreme of 60% on 2/26, after surging from 40% just one week earlier when the S&P 500 was at an all-time high. However, it’s important to note that stocks have historically recovered quite impressively over the 12 months following such extreme bearish readings.
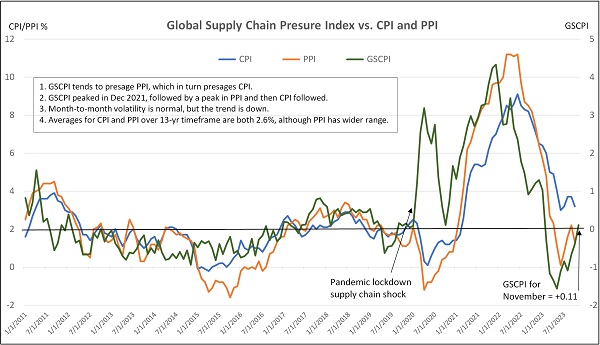
The rising bond term premium in Q4 suggested that investors were becoming increasingly anxious about rising deficits and inflation, which also pushed gold higher. Meanwhile, the Fed has maintained tight monetary policy—and high real interest rates—given the uptick in inflation and apparently solid employment reports. However, I have consistently argued that the real-time inflation trend (without the lag in key components) has been falling and that massive government spending and hiring masked underlying issues with growth and employment in the private sector. So, this is not due to anything the new administration has done. As Renaissance Macro economist Neil Dutta recently opined, "[President Trump] inherited an economy with deep imbalances and a frozen housing and labor market."
In fact, John Burns Research & Consulting has observed that 3.8 million employees work directly for the government, but an additional 7.5 million workers indirectly receive some or all of their wages from the government—which totals 11.3 million workers or roughly 8% of the total US workforce (134 million) and accounts for much of the jobs growth. This is why I continue to advocate for both smaller government and another 100 bps in Fed rate cuts to achieve a neutral fed funds rate around 3.5% and stimulate private sector growth. As a result, I would expect a 10-year yield to stabilize around 4.0-4.5%, which would justify a forward P/E multiple for the S&P 500 around 20x (i.e., an earnings yield of 5%).
From their highs this year, “the S&P 500 and crypto have erased a combined -$5.5 trillion of market cap,” according to The Kobeissi Letter. The highflyers have led the carnage, most notably semiconductor stocks. Meta Platforms (META) is the only MAG-7 stock still positive YTD, while defensive sectors (like staples, telecom, and utilities), gold and silver miners, low/minimum volatility, value, high dividend payers, REITs, and long-duration bonds are among the best performers. The fact that bonds have caught a bid and credit spreads remain tight are positive signs that investors do not fear recession (or economic collapse). But investors continue to be shy about the amount and duration of tariffs, the aggressive DOGE actions, timing of fiscal policy implementation (tax cuts and deregulation), and Fed monetary policy (a Fed put?), and the collective impact on jobs, inflation, GDP growth, and risk asset prices as they retreat from historically high valuations.
To be sure, the Big Tech darlings had become overvalued, which is why the equal-weight versions of the S&P 500 and Nasdaq 100 have held up significantly better during the selloff. But keep in mind, the first year of a 4-year presidential term is typically the most volatile during the transition to new policies—and Trump 2.0 (“wrecking-ball”) policies are bringing quite a change from the norm. As Treasury Secretary Scott Bessent said, “The economy has become hooked [on government spending], and there is going to be a detox period.”
So, knowing that he must show significant progress before the 2026 midterms, Trump is “ripping off the band-aid” to fully reveal the infected wound and wasting no time in addressing it with what he and his team strongly believes are healing policies that will restructure our nation for long-term prosperity, public safety, and national security. This is why his popularity among younger voters is holding firm. Although not nearly as extreme, it is like what Javier Milei has done to resurrect Argentina. I expect the political, economic, and market fallout will take its course during H1 2025 before giving way to a rapid building process during H2.
Investors have been increasingly scared away from risk assets at least partly due to the constant carping from both the mainstream media (MSM) and social media (usually misleadingly) about a “growth scare” (as the Atlanta Fed’s GDPNow forecast for Q1 plummeted to a recessionary -2.4% annualized growth rate), an “inflation scare” (due to tariffs, chickens, and migrant deportations), an “AI scare” (as China may be usurping our dominance with cheaper models, a “trade war scare” (as we alienate our international allies and trading partners), and various other scares that escape me at the moment (perhaps a “Hollywood exodus scare,” as celebs move out of country?). This diversified fearmongering has finally come to roost leading to the rapid unwinding of crowded long trades.
But no matter what you think of the longstanding system of global trade and whether the US was being taken advantage of, there is no doubting that the fiscal path we were on was unsustainable, with a bloated and intractable bureaucracy, wasteful boondoggles, entrenched interests, and funding of corruption, graft, fraud, racketeering, cronyism, kickbacks, and obfuscation both at home and around the world. Until now, no president has been willing or able to adequately address it, including Trump 1.0. But the new Trump 2.0 administration came in well prepared (and with a voter majority mandate) to tackle it head on. I have come to appreciate the method to our president’s apparent madness, as I discuss in my full post.
So, is this selloff likely to become a buyable dip rather than the start of a bear market? I would say yes. Although there might be some further volatility into the 4/2 tariff implementation date and perhaps the 4/15 Tax Day, I expect higher prices ahead. Why? First, from a short-term technical standpoint, the S&P 500, Nasdaq 100, and Dow Jones Industrials have diverged well below their 20-day moving averages, and they seem to have found support around their critical 300-day moving averages. Second, from a longer-term standpoint, despite all this chaos and turmoil from an administration emboldened to reverse and repair decades of neglect (and a continual “kicking the can down the road” for future generations to suffer the consequences), I remain optimistic that after some short-term pain during this transition period—including upticks in inflation, debt, and market volatility and a downtick in economic growth—the private sector will be equipped and unleashed to drive robust economic growth through productive, high-ROI investments and hiring.
In addition, as DataTrek Research recently observed, stocks have only fallen more than 10% in a given year in just 12 of the past 97 years, and each was driven either by a new hot war, recession (generally related to an oil price shock), or a Fed policy mistake—none of which are likely. So, don’t be too bearish. And as for a long entry point, the VIX can provide some guidance. It closed above 27 this week, which DataTrek considers to be a “capitulation” signal to consider getting back into stocks. And don’t forget all the cash sitting in money market funds earning those juicy risk-free rates. As money market rates recede, some of that cash may finally find its way into stocks at these more favorable valuations. Indeed, the rising price of gold may be signaling a global dovish pivot and massive liquidity support, as I discuss in my full post.
Yes, liquidity is key to keeping us out of a recession and a bear market in risk assets. Lower interest rates and a weaker US dollar are long-term economic tailwinds, while debt reduction is a short-term headwind until a rejuvenated (and turbocharged) private sector makes up for the lower deficit spending.
I expect the S&P 500 to rise above 6500 before year-end with a modest double-digit gain. Could it take longer for the expected fiscal stimulus (lower tax and interest rates, less red tape, and smaller government) to serve alongside the incredible promise of AI (on productivity, efficiency, and speed of product development) to boost the GDP such that the 6500 mark isn’t achieved until next year? Sure. But I think ultimately an economy driven by organic private sector growth is stronger and more reliable and sustainable than one driven by government (deficit) spending bills. As Elon Musk opined, “A more accurate measure of GDP would exclude government spending… Otherwise, you can scale GDP artificially high by spending money on things that don’t make people’s lives better.”
In the view of Treasury Secretary Scott Bessent, we have “a generational opportunity to unleash a new economic golden age that will create more jobs, wealth and prosperity for all Americans.” Indeed, if the fed funds rate begins to come down toward my 3.5% target, today’s slightly elevated valuations can be justified given solid corporate earnings growth, a high ratio of corporate profits to GDP, and the promise of continued margin growth across all industries due to the promise of rising productivity, efficiency, and product development speed from Generative AI, Large Language Models (LLMs), and Big Data. AI investment is not slowing down but simply shifting from a singular “builder” focus to a broader focus on AI applications. This is where productivity enhancement will shift into gear. And don’t forget energy, as affordable power is the lifeblood of an economy. Costs must stay low, and Trump 2.0 is prioritizing energy independence and lower energy costs.
Because this market correction was led by the bull market-leading MAG-7 stocks and all things AI related, investors now have a second chance to get positions in some of those mega-cap titans at more attractive prices. Notably, some of these names have seen their valuations retreat such that they are once again scoring well in Sabrient’s growth models (as found in our next-gen Sabrient Scorecards subscription product)—including names like Amazon (AMZN), NVIDIA (NVDA), Salesforce (CRM), Arista Networks (ANET), Fortinet (FTNT), Palo Alto Networks (PANW), Palantir (PLTR), Microsoft (MSFT), and Taiwan Semiconductor (TSM). Our models focus on high quality and fundamental strength, with a history of consistent, reliable, and accelerating sales and earnings growth, positive revisions to Wall Street analysts’ consensus forward estimates, rising profit margins and free cash flow, solid earnings quality, and low debt burden. These are factors Sabrient employs in selecting our portfolios and in our SectorCast ETF ranking model. And notably, our Earnings Quality Rank (EQR) is a key factor in each of these models, and it is also licensed to the actively managed, absolute-return-oriented First Trust Long-Short ETF (FTLS).
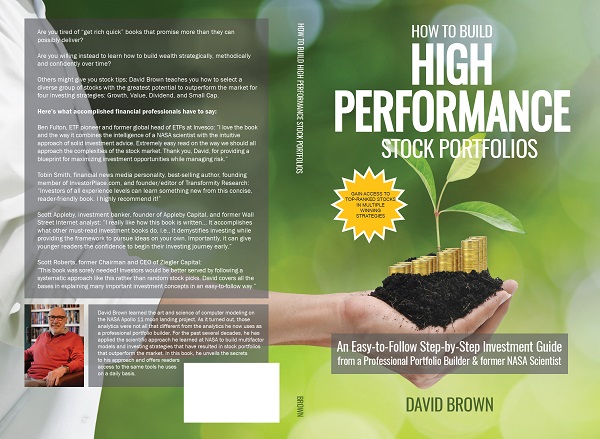
Sabrient founder David Brown describes these (and other) factors and his portfolio construction process in his new book, How to Build High Performance Stock Portfolios, which is available on Amazon for investors of all experience levels. David describes his path from NASA engineer on the Apollo 11 moon landing project to creating quant models for ranking stocks and building stock portfolios in four distinct investing styles—growth, value, dividend, or small cap growth. You can learn more about David's book, as well as the companion subscription product (Sabrient Scorecards) that does most of the stock evaluation work for you, by visiting: https://HighPerformanceStockPortfolios.com.
As you might expect from former engineers, Sabrient employs the scientific method and hypothesis-testing to build quantitative models that make sense. We have become best known for our “Baker’s Dozen” portfolio of 13 diverse growth-at-a-reasonable-price (GARP) stocks, which is packaged and distributed quarterly to the financial advisor community as a unit investment trust through First Trust Portfolios, along with three other offshoot strategies based on value, dividend, and small cap investing.
Click
HERE to continue reading my full post (and to sign up for email delivery). I examine in greater detail the “growth scare,” inflation, tariffs, and DOGE shock, equity valuations, and what lies ahead. I also discuss Sabrient’s latest fundamental-based SectorCast quantitative rankings of the ten U.S. business sectors, current positioning of our sector rotation model, and several top-ranked ETF ideas. Also, here is a
link to this post in printable PDF format.
 by Scott Martindale
 by Scott Martindale