Sector Detector: Vaccines and massive stimulus fuel 2021 optimism; plus Baker’s Dozen long-term performance update
 by Scott Martindale
President & CEO, Sabrient Systems LLC
First off, I am pleased to announce that Sabrient’s Q1 2021 Baker’s Dozen portfolio launched on January 20th! I am particularly excited because, whereas last year we were hopeful based on our testing that our enhanced portfolio selection process would provide better “all-weather” performance, this year we have seen solid evidence (over quite a range of market conditions!) that a better balance between secular and cyclical growth companies and across market caps has indeed provided significantly improved performance relative to the benchmark. Our secular-growth company selections have been notably strong, particularly during the periods of narrow Tech-driven leadership, and then later the cyclical, value, and smaller cap names carried the load as both investor optimism and market breadth expanded. I discuss the Baker’s Dozen model portfolio long-term performance history in greater detail in today’s post.
As a reminder, you can go to http://bakersdozen.sabrient.com/bakers-dozen-marketing-materials to find our “talking points” sheet that describes each of the 13 stocks in the new portfolio as well as my latest Baker’s Dozen presentation slide deck and commentary on the terminating portfolios (December 2019 and Q1 2020).
No doubt, 2020 was a challenging and often terrifying year. But it wasn’t all bad, especially for those who both stayed healthy and enjoyed the upper leg of the “K-shaped” recovery (in which some market segments like ecommerce/WFH thrived while other segments like travel/leisure were in a depression). In my case, although I dealt with a mild case of COVID-19 last June, I was able to spend way more time with my adult daughters than I previously thought would ever happen again, as they came to live with me and my wife for much of the year while working remotely. There’s always a silver lining.
With President Biden now officially in office, stock investors have not backed off the gas pedal at all. And why would they when they see virtually unlimited global liquidity, including massive pro-cyclical fiscal and monetary stimulus that is likely to expand even further given Democrat control of the legislative triumvirate (President, House, and Senate) plus a dovish Fed Chair and Treasury nominee? In addition, investors see low interest rates, low inflation, effective vaccines and therapeutics being rolled out globally, pent-up consumer demand for travel and entertainment, huge cash balances on the sidelines (including $5 trillion in money market funds), imminent calming of international trade tensions, an expectation of big government spending programs, enhanced stimulus checks, a postponement in any new taxes or regulations (until the economy is on stronger footing), improving economic reports and corporate earnings outlooks, strong corporate balance sheets, and of course, an unflagging entrepreneurial spirit bringing the innovation, disruption, and productivity gains of rapidly advancing technologies.
Indeed, I continue to believe we are entering an expansionary economic phase that could run for at least the next few years, and investors should be positioned for both cyclical and secular growth. (Guggenheim CIO Scott Minerd said it might be a “golden age of prosperity.”) Moreover, I expect fundamental active selection, strategic beta ETFs, and equal weighting will outperform the cap-weighted passive indexes that have been so hard to beat over the past few years. If things play out as expected, this should be favorable for Sabrient’s enhanced growth-at-a-reasonable-price (aka GARP) approach, which combines value, growth, and quality factors. Although the large-cap, secular-growth stocks are not going away, their prices have already been bid up quite a bit, so the rotation into and outperformance of quality, value, cyclical-growth, and small-mid caps over pure growth, momentum, and minimum volatility factors since mid-May is likely to continue this year, as will a desire for high-quality dividend payers, in my view.
We also believe Healthcare will continue to be a leading sector in 2021 and beyond, given the rapid advancements in biomedical technology, diagnostics, genomics, precision medicine, medical devices, robotic surgery, and pharmaceutical development, much of which are enabled by 5G, AI, and 3D printing, not to mention expanding access, including affordable health plans and telehealth.
In this periodic update, I provide a comprehensive market commentary, offer my technical analysis of the S&P 500 chart, review Sabrient’s latest fundamentals-based SectorCast quant rankings of the ten US business sectors, and serve up some actionable ETF trading ideas. To summarize, our outlook is bullish (although not without some bouts of volatility), the sector rankings reflect a moderately bullish bias, the longer-term technical picture remains strong (although it is near-term extended such that a pullback is likely), and our sector rotation model retains its bullish posture. Read on….
Commentary:
With investors flush with cash, most asset classes finished 2020 strong, with the S&P 500 (SPY) +18.3%, the Tech-heavy Nasdaq 100 (QQQ) +48.6%, Russell 2000 small caps (IWM) +20.0%, S&P 400 mid caps (MDY) +13.5%, 20+ Year Treasuries (TLT) +18.1%, Emerging Markets (EEM) +17.0%, gold (GLD) +24.8%, and bitcoin up a whopping +303.0% (and still climbing!). Moreover, oil has been holding above $50, and copper (the bellwether industrial metal) remains in a solid uptrend. It was notable that the end-of-year surge in small caps allowed the Russell 2000 to outperform the S&P 500 for the first time since 2016. Hedge funds overall returned +11.6% in 2020, which is the best in 10 years, according to the HFRI Fund Weighted Composite Index (a global equal-weighted index of over 1,400 single-manager funds).
You surely noticed that bitcoin was the best-performing asset class of 2020 by a country mile, closing the year at $29,000 and then continuing to spike during the first week of the year before topping out at nearly $42,000. Since then, traders have been taking profits and repositioning for the next leg up, while long-term investors are using the pullback as a buying opportunity. Cryptocurrencies (including Bitcoin, Ethereum, and numerous altcoins) have enjoyed rapid capital inflows for a variety of reasons, including profligate government “money printing” (to fund deficit spending and stimulus programs), institutional adoption, the proven security of blockchain technology, and the emergence of 5G connectivity (to speed up transactions). Many investors now see Bitcoin as superior to gold (or even Treasuries, given ultra-low yields) as either a store of value or protection against inflation or recession. So, rather than rising merely on retail investor speculation (like they did in 2017, before crashing back down), this time there seems to be real purpose behind the bullishness. Total crypto market cap now exceeds $1 trillion.
One might think that Democrat control of the legislative triumvirate: President, House, and Senate, would send stocks plummeting due to fears of higher taxes and regulations, but according to DataTrek, US stocks historically have averaged +14% annual return since 1948 when Democrats control Congress and the White House. Furthermore, I think the likelihood of sweeping changes in tax rates and regulation and accelerated “Big Government” spending are lessened given razor-thin majorities and the presence of several moderate Democrats. Even now, there is doubt about the viability of Biden’s $1.9 trillion stimulus package (as an extension to the $900B package that was just enacted), with state and local government and pension funding (aka bailouts) likely to be a major sticking point.
Nevertheless, given the apparent growing acceptance of once-unthinkable Modern Monetary Theory (MMT) and the willingness of central banks (including our own) to support the economy with unlimited liquidity, investors evidently expect the trend to continue for much of that liquidity to find its way into both financial assets and hard assets alike, including stocks, gold, and cryptocurrencies. Is all this “fake money” pouring into the financial system healthy in the long term? No, and I have proffered ideas in the past as to how the developed economies might someday need to coordinate a way to retire much of that debt from central bank balance sheets (and perhaps restore something akin to the old gold standard). But for the near term, as long as the spigot stays open, it is stimulative for both the economy and risk assets.
Federal Reserve data shows that M2 money supply grew by 25% in 2020, which is the largest growth rate in history, while M2 money velocity is at all-time lows. Although the massive liquidity and spike in M2 money supply growth would suggest an imminent rise in inflation, it has proven quite hard to overcome the powerful disinflationary dynamics from the aging demographics throughout the developed world, slowing population growth, expanding globalization of manufacturing and trade, and the innovation, disruption, and productivity gains of rapidly advancing technologies. Moreover, both businesses and consumers have been more inclined to keep their money in the bank or investments rather than spend. So, with all that liquidity (often employing leverage) competing for a relatively small number of investment choices, asset prices keep rising in expectation of continued expansion in money supply – which could continue for years.
As a result, valuations are historically high by most metrics. But keep in mind, “Big Tech” companies dominate the major cap-weighted indexes much more than they ever have before, and they are veritable profit machines with powerful competitive positions, unprecedented global reach, wide moats, strong customer loyalty, low capital intensity, and immense growth opportunities.
Furthermore, as aggressive, cash-flush investors seek new sources of “hockey stick” returns, initial public offerings (IPOs) are surging. Last year was a record year for IPOs in the US as a total of 552 companies became listed (versus 242 in 2019), raising a total of $174 billion, which is 43% more than the previous record set in 2007. The surge in IPO activity during the second half of 2020 was fueled by Special Purpose Acquisition Companies (SPACs), which accounted for half of all IPOs in 2020. These so-called “blank check” companies are created for the express purpose of effecting a reverse merger, capital stock exchange, asset acquisition, stock purchase, reorganization, or similar business combination with one or more businesses.
Also, crowdfunding is rapidly emerging as an alternative form of investing, given that the SEC recently increased the limit on how much startups can raise per year using Regulation Crowdfund to $5 million versus the previous $1 million. This has enabled many startups to avoid the VC/PE route, while also helping to “democratize” the world of startup investing – for both the startup and the individual investor.
On the other hand, many observers worry that complacency, speculation, and FOMO (fear of missing out) have become widespread, leading to “malinvestment” and unjustified valuations in many IPOs, SPACs, Tech companies, cryptocurrencies, etc., and perhaps a proliferation of so-called “zombie companies,” whose survival relies upon low interest rates, a friendly debt market, and robust economic recovery (so they can make enough money to service their debt). As debt begets more debt, it can lead to the dreaded “liquidity trap,” which also tends to worsen the wealth gap. Unfortunately, there’s no free lunch in this financial experiment. By the way, Sabrient subsidiary Gradient Analytics, a forensic accounting research and consulting firm, specializes in the critical examination of financial statements for identifying short sale candidates and those “zombie companies.”
Valuations:
Let’s talk more about current valuations. As of 1/22/21, the S&P 500 forward P/E sits at 21.8x, while the Russell 2000 small cap index is 20.0x, the S&P 600 small cap index is 19.1x, the S&P 400 mid cap index is 20.3x, and the Tech-heavy Nasdaq 100 is 30.5x. Notably, the Russell 2000 companies in aggregate get more than three-quarters of their revenue from the domestic economy. The index’s largest sector is Healthcare (at 21% weighting), and overall, it is more weighted to the cyclical Financial and Industrial sectors, which typically thrive in expansionary economic cycles.
The S&P 500 just recently added the “story stock” Tesla (TSLA), which rose 10x from its pandemic selloff low, and incredibly, it sports a market cap over $800 million and a forward P/E over 200x. It is now worth far more than the other leading carmakers combined [e.g., it is 10x the market cap of General Motors (GM) and 4x Toyota Motor (TM)] despite accounting for less than 1% of global auto sales], and Elon Musk has become the richest person in the world. Of course, Tesla bulls would argue that the firm is “more than just a car company,” but still….
Warren Buffet’s favorite indicator – the ratio of total US stock market valuation (about $41 trillion for the Wilshire 5000) to GDP (about $21 trillion) – has reached roughly 195% (versus a long-term average of about 75%), which is well above the levels seen even during the dot-com bubble. Yale professor Robert Shiller's 10-year cyclically adjusted trailing P/E (aka CAPE ratio) - stands now exceeds 34x, which is one of the highest readings ever. However, as I have discussed before, this ignores today’s ultra-low interest rates (and discount rate in DCF analysis) and radically different index composition, with high-growth, high-margin, low-capital intensity, low-cyclicality Tech companies that now dominate the major market indexes today, as opposed to the mega Industrial and Energy firms that dominated in days of yore.
On the other hand, Crossborder Capital observed that the ratio between the sum of all equity holdings worldwide and the pool of global liquidity stands at only 0.5x, which is close to the long-term average, as compared to 0.85 during the 2000 Tech Bubble and 0.7x during the 2008 GFC. So, they argue, overall valuations can be justified as long as liquidity isn’t removed from the system.
While stocks can enjoy eye-popping multiple expansion during a pre-recovery speculative phase, in anticipation of massive corporate capital spending and government-sponsored programs, I think they are more likely to see multiple contraction this year as investors look for results in the form of actual spending and rising earnings amid broad economic recovery. And with interest rates likely to rise somewhat, the discount rate will be a bit higher. As DataTrek has opined, corporate earnings must be the driver, and thus, earnings leverage from technology-led productivity growth will be critical across all sectors and industries. They wrote, “If the 2010s was the decade where we saw Technology build a set of useful tools, then the 2020s should be when those get put to use.”
GDP, debt, interest rates, and earnings:
Regrettably, the federal budget deficit was $3.1 trillion in fiscal year 2020 (more than 3x the 2019 deficit) or about 15% of GDP, which is the highest since 1945 (the end of WWII), as the Fed’s “printing press” kept cranking out dollars at breakneck speed to replace actual organic growth and free market trade. And some predict it could hit 20% of GDP later this year. The economic rebound has been quite strong, leading many to believe that the spending was necessary to prevent economic collapse. Following record-breaking US GDP growth of +33.4% (annualized) in Q3 2020, the Atlanta Fed’s NowCast forecast for Q4 GDP growth indicates a solid +7.5% annualized (although the consensus of economists is only +4.5%). For full-year 2021, the Fed expects GDP to hit +4.2% and unemployment to fall to near +5.0%. The BEA’s advance Q4 GDP numbers come out on January 28.
US federal debt now essentially totals 100% of our $21 trillion GDP. But as I often point out, taking a single metric in isolation can be misleading. More important than this onerous statistic is the cost of servicing the debt, which for now is more easily manageable than it was in many prior periods. During the past fiscal year, net interest on the US federal debt was 1.6% of GDP, which is actually lower than the 1.7% in 2019. Moreover, it was right around 3.0% throughout the 1980-1999 period. Even Fed chairman Powell has said, “US debt is not on a sustainable path, but the debt is totally sustainable.”
Of course, it all depends on interest rates remaining near historic lows. The 30-year Treasury yield closed Friday 1/22/21 at 1.85%, while the 10-year T-note is at 1.09%, the 2-year T-note 0.125%, and the 3-month T-bill 0.079%. So, the 3-month/10-year spread has steepened to +101 bps and the 2-10 spread is +96 bps. A rising 10-year Treasury yield implies increasing confidence in economic recovery. Overseas, many countries are still issuing debt with a negative nominal yield. Moreover, most government debt today (including in the US) trades at a negative real yield (after accounting for inflation). Goldman Sachs forecasts the Federal Reserve will not raise interest rates again until 2025 and that the U.S. dollar could shed 6% of its value this year as it continues in a “structural downtrend.”
The next official FOMC announcement will come on January 27. The Fed balance sheet finished 2020 at $7.4 trillion or about 35% of GDP. In its December meeting, the Fed elaborated on its $120 billion/month bond buying program by saying it would “continue to increase its holdings of Treasury securities by at least $80 billion per month and of agency mortgage-backed securities by at least $40 billion per month until substantial further progress has been made toward the Committee’s maximum employment and price stability goal,” including keeping inflation above 2% for a sustained period.
With respect to Corporate America, it is encouraging that aggregate corporate debt to total market cap is quite low at 33% (versus 68% in 2009, at the depths of the Financial Crisis). And if they want to reduce debt, companies today can either tap into their high cash balances or issue stock to cash-flush investors.
In addition, although Wall Street’s quarterly earnings estimates are most frequently revised downward heading into an earnings season, revisions this time around for Q4 have moved steadily higher, which is quite encouraging. And according to FactSet, a record high number of companies issued positive guidance heading into this earnings season. According to Jefferies, this represents a significant and unusual tailwind for stocks. Indeed, earnings reports so far have been quite encouraging, particularly from the banking industry. For instance, Goldman Sachs easily beat analyst consensus earnings and revenue on strong performance from trading and investment banking. EPS came in at $12.08 versus the estimate of $7.47, on revenue that rose 18% YOY to $11.74 billion ($1.75 billion higher than consensus estimates).
Indeed, FactSet reported last Friday that more S&P 500 companies are beating EPS estimates for the fourth quarter than average – and beating by a wider margin than average. In aggregate, companies are reporting earnings that are 22.4% above the estimates, which is also above the 5-year average of 6.3%. Moreover, they say that, “if earnings continue to surpass estimates at current levels, it is likely the index will report year-over-year earnings growth for the quarter for the first time since Q4 2019.”
Bloomberg’s consensus S&P 500 earnings growth rate estimates for 2021 and 2022 are +22.2% and +16.9%, respectively. So, if the S&P 500 aggregate EPS in 2021 ends up closer to $185/share, Friday’s 3,841 price level indicates a forward P/E of 20.7x, which seems reasonable in a “TINA” (There is No Alternative) climate characterized by an expansionary economic cycle, low interest rates, modest inflation, abundant liquidity, healthy banks, strong corporate balance sheets with high cash balances, rising earnings, resumptions in buybacks, and stable (or even rising) dividends.
Value/Growth divergence update:
If we look back over the past 2.5 years since mid-2018, apparent market strength has been somewhat deceiving in that the growth-oriented, cap-weighted indexes have been in a strong bull market thanks primarily to a handful of mega-cap Technology names, while most of the rest of the broader market essentially has been in a downtrend, making it difficult for valuation-oriented portfolios or equal-weight indexes to keep up. To illustrate, below is a 5-year chart (starting 7/1/15) comparing the S&P 500 LargeCap Pure Growth ETF (RPG) and the S&P 600 SmallCap Pure Value ETF (RZV). This chart illustrates the stark market bifurcation and relative performance gaps between large vs. small, growth vs. value, and secular-growth vs. cyclical-growth. (Note: Highly cyclical and value-oriented sectors would include Financials, Industrials, Materials, and Energy.)
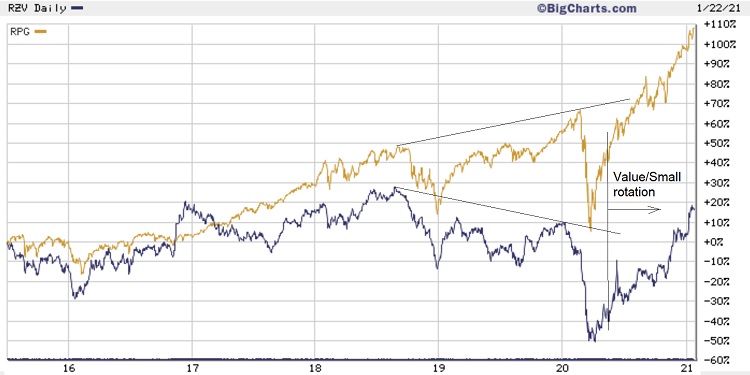
You can see that after the 2016 election, market breadth and the value factor got a strong but short-lived boost during the “Trump Bump,” and then in mid-2018 (essentially on 6/11/18) the trade war with China escalated, ultimately launching a stark and historic market bifurcation due more to uncertainty rather than a significant cut to earnings expectations. And the bifurcation only got worse this year due to COVID-19, lockdowns, civil unrest, and a tumultuous election. I have highlighted this dynamic on the chart with the fan lines tracing the uptrend in RPG versus the downtrend in RZV since late-August 2018. The major market-cap-weighted indexes continued to hit new highs, primarily on the backs of the five largest FAAAM stocks – Facebook (FB), Apple (AAPL), Amazon.com (AMZN), Alphabet (GOOGL), and Microsoft (MSFT) – while a large swath of the market has been quite weak. As a result, many value-oriented portfolios underperformed, as did many broad-market equal-weighted indexes. However, since mid-May 2020, there has been improving market breadth and a rotation into value, cyclicals, and smaller caps (as RZV has greatly outperformed RPG), which is a bullish sign of a healthy market.
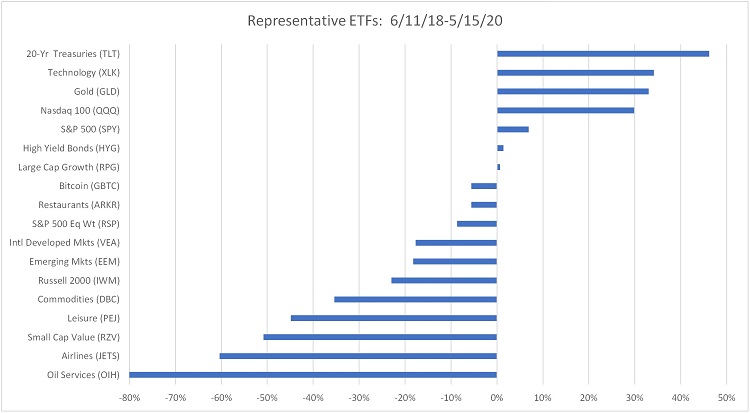
The next two graphics illustrate the relative performance of various ETFs representing various market segments ranging among Bitcoin, bonds, Tech stocks, oil & gas, travel & leisure, gold, commodities, international developed and emerging markets, large cap, small cap, value, and growth. The first chart shows relative performance during the 6/11/18-5/15/20 period of maximum market bifurcation and narrow leadership from Treasuries (TLT), gold (GLD), and cap-weighted Tech-dominated indexes.
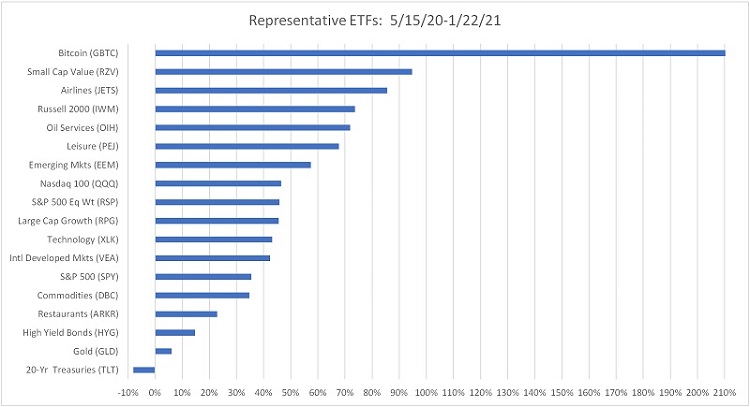
In stark contrast, the second chart below illustrates the dramatic risk-on market rotation that has occurred since 5/15/20, in which the only negative performer in this group is TLT, with leadership from Bitcoin (GBTC), small-cap value, travel & leisure, and oil & gas, and emerging markets. This rotation seems to have a two-fold purpose: 1) anticipation of recovery in the economy and the most neglected market segments, and 2) preparation for dollar debasement and rising inflation due to unlimited liquidity/stimulus.
Indeed, institutional buyers are back, and they are buying the higher-quality stocks (not just the high-flying momentum stocks). The 5-year TIPS breakeven inflation is once again on the rise, recently eclipsing the 2.0% level (compared to 0.16% at the depths of the pandemic selloff). Likewise, a rising 10-year Treasury yield (now around 1.09%) implies increasing confidence in economic recovery and rotation from bonds to stocks (pushing Treasury yields higher). Furthermore, as credit markets continue to improve and credit spreads fall with the economic recovery, smaller companies should enjoy better business and credit conditions, facilitating a continued recovery in Industrials, Energy, and small caps, which typically have greater earnings leverage than large-cap Technology. I continue to believe that a new expansionary economic phase is about to launch.
Baker’s Dozen model performance update:
Of course, Sabrient’s flagship product since 2009 has been our Baker’s Dozen portfolio, which since January 2020 is now published on a quarterly basis. Sabrient founder and chief market strategist David Brown continues to lead the broad Sabrient team (which includes our wholly owned subsidiary Gradient Analytics, a forensic accounting research firm that primarily serves the long/short hedge fund community) in selecting each portfolio.
Let’s take a look at the long-term performance of a Model Portfolio that has been rebalanced every January with the newest stock list (equal weighted) since we started publishing the Baker’s Dozen in 2009. The chart below shows the tremendous outperformance over the SPDR S&P 500 Trust (SPY) over the past 12 years despite five major drawdowns, as shown – including of course the scary 37% peak-to-trough drawdown last March at the COVID-19 pandemic selloff low. Moreover, the aforementioned market rotation into quality, value, cyclical-growth, and small-mid caps since mid-May, which many believe is likely to persist, has been quite favorable for Sabrient’s GARP portfolios.
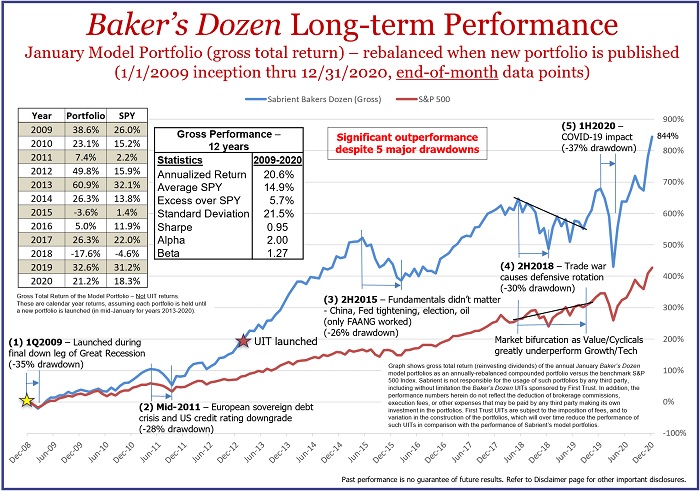
Although I supported President Trump’s goals in confronting China and its unapologetic flouting of WTO trade rules and IP, there is little doubt that while good for the US dollar (as a global safe haven), the trade war with China severely impacted corporate visibility, supply chains, investor psyche, and indeed most value- and cyclicals-oriented portfolios like Sabrient’s. Investors today appear to be counting on the Biden Administration “normalizing” relations with China to some extent, perhaps by reducing or removing tariffs and other trade barriers.
Regardless, these “new normal” economic conditions and investor preferences suggested to us that we should enhance our legacy GARP model to make it more “all-weather.” Of course, we have enhanced it periodically in the past, including the addition of our proprietary Earnings Quality Rank (EQR) in 2013 as an alpha factor. In the latest case, we developed and added a new Growth Quality Rank (GQR) that favors companies with consistent and reliable earnings growth, thus allowing secular-growth stocks to score competitively in the rankings with cyclical growth – even though their forward valuations are often higher than our GARP model previously preferred. As a result, our newer Baker’s Dozen portfolios launched since December 2019 reflect a better balance between secular growth and cyclical/value stocks and across large/mid/small caps, while also displaying better relative performance versus the benchmark.
Below is a chart focusing solely on the final portfolio in the earlier 12-year chart, i.e., the Q1 2020 Baker’s Dozen model portfolio that launched on 1/17/2020. You can see that it has shown much less volatility relative to the benchmark. Also, its solid relative performance has been driven mainly by the Technology and Communications Services names in the portfolio, i.e., SolarEdge Technologies (SEDG), Autodesk (ADSK), Adobe (ADBE), Charter Communications (CHTR), and Ciena (CIEN). However, during the initial recovery rally off the pandemic selloff lows, and then more recently since the start of November, the market’s risk-on rotation into the value, cyclical, and smaller caps performance allowed for leadership from Valero Energy (VLO), Marriott Vacations (VAC), Alaska Air (ALK), and Winnebago (WGO). You can see that it has also nicely outperformed the equal weight versions of the S&P 500 (RSP), S&P 400 MidCap (EWMC), and S&P 600 SmallCap (EWSC).
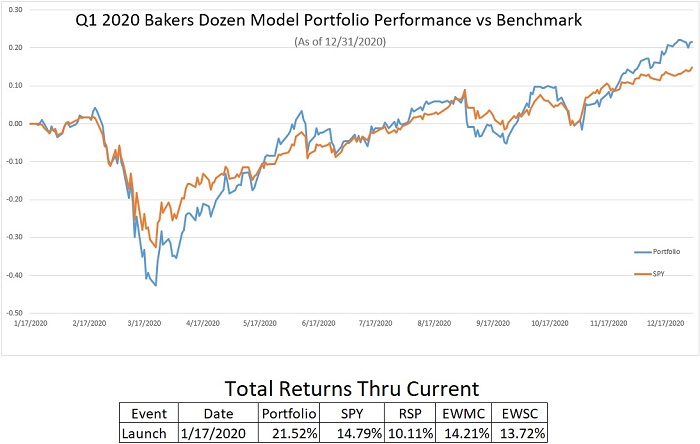
The process enhancements were introduced in December 2019, and our GARP portfolios since then have shown improved performance relative to their benchmarks, with many of them outperforming (some quite substantially). Thus, we believe our current portfolios – including the new Q1 2021 Baker’s Dozen that was just released last week – are positioned for both: (a) narrow leadership with an investor focus on secular growth, and (b) greater market breadth and rotation into value/cyclicals. Going forward, we still recommend exposure to both the unstoppable secular growth trends and the value factor, cyclical sectors, and smaller caps that typically thrive during an expansionary economic phase.
As an example, for the new Q1 2021 Baker’s Dozen that just launched last week, David Brown and his analyst team selected 3 large caps, 5 mid caps, and 5 small caps; 4 growth stocks versus 9 value stocks, and 6 secular-growth Tech and Healthcare names to balance the 7 cyclical-growth stocks from Consumer, Industrial, and Materials sectors. There is even a gold miner in the group, given its strong earnings forecast based on the bull case for gold. Because of our model enhancements, several Technology names became eligible for consideration, and yet the portfolio also remains well-positioned for a continued market broadening and rotation into value, cyclicals, and small caps. In fact, Sabrient’s Small Cap Growth portfolio, which also incorporates the new GQR scoring, has been surging over the past few months.
Again, you can visit http://bakersdozen.sabrient.com/bakers-dozen-marketing-materials to find our “talking points” sheet that describes each selection.
Final comments:
Last year at this time, I wrote, “It remains pretty clear that there is no imminent recession in sight … Typically, a recession would be triggered by a Black Swan geopolitical event, a hawkish Fed tightening cycle to pump the brakes on an overheated economy and fight inflation, or a massive spike in oil prices.” Well, we indeed got the Black Swan event manifested by the deadly COVID-19 pandemic, which created one of the worst (albeit brief) recessions in recent history.
Despite the fast recovery and optimism, market bears are lurking all around us, including GMO’s Jeremy Grantham who says, “The long, long bull market since 2009 has finally matured into a fully-fledged epic bubble … Featuring extreme overvaluation, explosive price increases, frenzied issuance, and hysterically speculative investor behavior, I believe this event will be recorded as one of the great bubbles of financial history.” If he is right, the big question of course is where to put your savings, especially if risk assets remain highly correlated. Recall that pretty much everything tanked simultaneously during the COVID selloff.
For me, the key is to remain bullish and invested in equities but refrain from chasing the big momentum stocks that prospered from the changes in our work and leisure activities caused by the pandemic. That means being exposed to both the secular growth trends and the beaten-down cyclicals that should prosper during an expansionary economic phase. But I also believe in allocating to hard assets like gold, silver, gold miners, and Bitcoin/altcoins, which are in their own bull markets, largely uncorrelated with equities.
Moreover, I expect fundamental active selection, strategic beta ETFs, and equal weighting will outperform the passive cap-weighted indexes, and we may see a revival in long/short as well. This should be favorable for Sabrient’s enhanced GARP approach, which combines value, growth, and quality factors while providing for a more “all-weather” portfolio with balance between secular growth and cyclical/value stocks and across market caps.
I wish you a healthy and prosperous 2021.
SPY Chart Review:
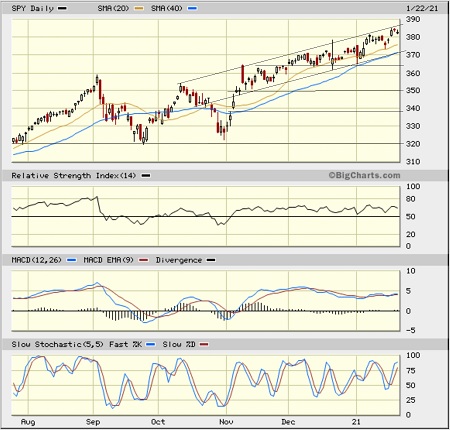
The SPDR S&P500 Trust (SPY) closed out Friday at 382.88 as it continues its nearly 3-month rotation into the value, small caps, and cyclical sectors with improving market breadth. Notably, the iShares Russell 2000 small caps (IWM) and iShares MSCI Emerging Markets (EEM) have been particularly strong, which bodes well for the broad market. Both IWM and EEM got the breakouts I anticipated in my last post in mid-December. However, although the long-term technical picture remains strong, SPY, IWM, and EEM all appear to be extended such that a near-term pullback is likely going into earnings season. Oscillators RSI, MACD, and Slow Stochastics are all turning down from overbought territory with bearish divergences (lower highs versus higher highs in price), while price has once again hit strong resistance at the top of a 3-month bullish rising channel. Technical support levels can be found at the rising 20-day simple moving average (SMA) around 376, convergence of the bottom of the rising channel with the 50-day SMA currently at 370, previous minor support at 366, the 100-day SMA near 355, previous minor support at 350, a bullish gap at 339, the rising 200-day SMA near 333, and longer-term support at 320.
Latest Sector Rankings:
Relative sector rankings are based on our proprietary SectorCast model, which builds a composite profile of each of over 900 equity ETFs based on bottom-up aggregate scoring of the constituent stocks. The Outlook Score employs a forward-looking, fundamentals-based multifactor algorithm considering forward valuation, historical and projected earnings growth, the dynamics of Wall Street analysts’ consensus earnings estimates and recent revisions (up or down), quality and sustainability of reported earnings, and various return ratios. It helps us predict relative performance over the next 2-6 months.
In addition, SectorCast computes a Bull Score and Bear Score for each ETF based on recent price behavior of the constituent stocks on particularly strong and weak market days. A high Bull score indicates that stocks within the ETF recently have tended toward relative outperformance when the market is strong, while a high Bear score indicates that stocks within the ETF have tended to hold up relatively well (i.e., safe havens) when the market is weak.
Outlook score is forward-looking while Bull and Bear are backward-looking. As a group, these three scores can be helpful for positioning a portfolio for a given set of anticipated market conditions. Of course, each ETF holds a unique portfolio of stocks and position weights, so the sectors represented will score differently depending upon which set of ETFs is used. We use the iShares that represent the ten major U.S. business sectors: Financial (IYF), Technology (IYW), Industrial (IYJ), Healthcare (IYH), Consumer Goods (IYK), Consumer Services (IYC), Energy (IYE), Basic Materials (IYM), Telecommunications (IYZ), and Utilities (IDU). Whereas the Select Sector SPDRs only contain stocks from the S&P 500 large cap index, I prefer the iShares for their larger universe and broader diversity.
Here are some of my observations on this week’s scores:
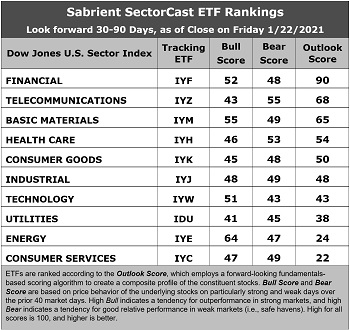
1. Financial remains in the top spot with a robust Outlook score of 90. The sector displays the best sell-side analyst sentiment (positive net revisions to EPS estimates), good return ratios, a reasonable forward P/E of 17.5x, an attractive forward PEG (forward P/E divided by projected EPS growth rate) of 1.81, and the best insider sentiment (open market buying). Telecom remains in the second spot with an Outlook score of 68, given its low forward P/E of 13.4x and solid return ratios. Rounding out the top five are Basic Materials, Healthcare, and Consumer Goods (Staples/Noncyclical), which are also the only ones scoring above 50. Notably, earnings estimates continue to be revised upwards across all sectors.
2. The bottom two sectors are Consumer Services (Discretionary/Cyclical) with an Outlook score of 22, despite having the highest projected EPS growth rate of 15.7%, and Energy at 24, despite being tied for the best revisions to EPS estimates. Energy has long been the cellar-dweller given its poor near-term growth prospects and high forward P/E and PEG ratios. Industrial and Materials have fallen primarily due to their strong price performance during the sustained value/cyclicals rotation. Notably, high-flying Technology sits in the seventh spot due to its high forward P/E of 30.0x and minimal analyst upward revisions.
3. Looking at the Bull scores, Energy displays the top score of 64, followed by Basic Materials at 55, as stocks within these sectors have displayed relative strength on strong market days. Utilities scores the lowest at 41. The top-bottom spread of 23 points reflects low sector correlations on strong market days. It is desirable in a healthy market to see low correlations reflected in a top-bottom spread of at least 20 points, which indicates that investors have clear preferences in the market segments and stocks they want to hold.
4. Looking at the Bear scores, defensive sector Telecom scores the highest at 55, followed by Healthcare at 53, as stocks within these sectors have been the preferred safe havens lately on weak market days. Technology displays the lowest score of 43, as investors have fled during recent market weakness. The top-bottom spread is only 12 points, which reflects high sector correlations on weak market days. Ideally, certain sectors will hold up relatively well while others are selling off (rather than broad risk-off behavior), so it is desirable in a healthy market to see low correlations reflected in a top-bottom spread of at least 20 points.
5. Financial displays the best all-around combination of Outlook/Bull/Bear scores, while Consumer Services (Discretionary/Cyclical) is the worst. Looking at just the Bull/Bear combination, Energy is by far the best, followed by Basic Materials, indicating superior relative performance (on average) in extreme market conditions (whether bullish or bearish). Both represent economically sensitive value/cyclicals market segments. Utilities scores the worst.
6. This week’s fundamentals-based Outlook rankings retain a moderately bullish bias, given that cyclical sector Financial and Basic Materials are at or near the top while defensive sector Utilities is in the lower tier. The near-term earnings outlook in our fundamentals-based model continues to gain visibility. Keep in mind, the Outlook Rank does not include timing, momentum, or relative strength factors, but rather reflects the consensus fundamental expectations at a given point in time for individual stocks, aggregated by sector.
ETF Trading Ideas:
Our Sector Rotation model, which appropriately weights Outlook, Bull, and Bear scores in accordance with the overall market’s prevailing trend (bullish, neutral, or defensive), continues to display a bullish bias and suggests holding Energy (IYE), Financial (IYF), and Basic Materials (IYM), in that order. (Note: In this model, we consider the bias to be bullish from a rules-based trend-following standpoint when SPY is above both its 50-day and 200-day simple moving averages.)
If you prefer a neutral bias, the Sector Rotation model suggests holding Financial, Telecom, and Basic Materials, in that order. On the other hand, if you are more comfortable with a defensive stance on the market, the model suggests holding Telecom, Healthcare, and Financial, in that order.
An assortment of other interesting ETFs that are scoring well in our latest rankings include First Trust Financials AlphaDEX (FXO), iShares US Regional Banks (IAT), Invesco KBW Bank (KBWB), iShares US Broker-Dealers & Securities Exchanges (IAI), Invesco S&P 500 Equal Weight Financials (RYF), First Trust Morningstar Dividend Leaders (FDL), Invesco S&P SmallCap Value with Momentum (XSVM), iShares Focused Value Factor (FOVL), iShares US Home Construction (ITB), Invesco Dynamic Pharmaceuticals (PJP), iShares US Small Cap Value Factor (SVAL), First Trust Dorsey Wright Momentum & Value (DVLU), LeaderShares AlphaFactor Tactical Focused (LSAT), and Affinity World Leaders Equity (WLDR).
As always, I welcome your thoughts on this article! Please email me anytime. Any and all feedback is appreciated!
IMPORTANT NOTE: I post this information periodically as a free look inside some of our institutional research and as a source of some trading ideas for your own further investigation. It is not intended to be traded directly as a rules-based strategy in a real money portfolio. I am simply showing what a sector rotation model might suggest if a given portfolio was due for a rebalance, and I do not update the information on a regular schedule or on technical triggers. There are many ways for a client to trade such a strategy, including monthly or quarterly rebalancing, perhaps with interim adjustments to the bullish/neutral/defensive bias when warranted, but not necessarily on the days that I happen to post this article. The enhanced strategy seeks higher returns by employing individual stocks (or stock options) that are also highly ranked, but this introduces greater risks and volatility. I do not track performance of the ideas mentioned here as a managed portfolio.
Disclosure: At the time of this writing, among the securities mentioned, the author held long positions in QQQ, EEM, gold, Bitcoin, and Ether, and short positions in SPY.
Disclaimer: This newsletter is published solely for informational purposes and is not to be construed as advice or a recommendation to specific individuals. Individuals should take into account their personal financial circumstances in acting on any opinions, commentary, rankings, or stock selections provided by Sabrient Systems or its wholly owned subsidiary, Gradient Analytics. Sabrient makes no representations that the techniques used in its rankings or analysis will result in or guarantee profits in trading. Trading involves risk, including possible loss of principal and other losses, and past performance is no indication of future results.
