 by Scott Martindale
President & CEO, Sabrient Systems LLC
Overview:
Strong US stock market performance has been driven, in my view, by the combination of: 1) a dovish Fed, money supply growth and global capital flight to the US (“shadow liquidity”), 2) expectations of lower energy costs and falling inflation, 3) AI exuberance and capex and the promise of massive productivity gains, and 4) growing optimism about technologies like nuclear energy, blockchain, quantum computing, robotics, autonomous vehicles, and genomics. But after two consecutive years of 20%+ gains in the S&P 500 for the first time since 1998 (and even greater gains for the Tech-dominated Nasdaq 100)—greatly outperforming all prominent forecasts—investors are looking ahead to a year that arguably brings even greater uncertainty and a wider range of expected outcomes, ranging from a recession and bear market to a continued bull run within a Roaring ‘20s-redux decade.
Will Trump 2.0 business-friendly fiscal policies (e.g., tax cuts, deregulation) and DOGE cost-cutting impact the economy, inflation, federal budget deficit, and corporate profits negatively for a period of time before kicking in later? What about sluggish economic growth abroad and the disastrous impacts of the ultra-strong dollar, particularly among key trading partners like Canada, Mexico, Europe, China, and Japan? And will the massive corporate capex (which is expected to accelerate under the new administration’s policies) start to show commensurate returns in the form of rising productivity and profitability, leading to rising GDP growth (in true supply-side style) without the crutch of government deficit spending (which accounted for about 30% of growth over the last 4 quarters)…and ultimately to rising tax receipts to quickly offset any initial rise in the deficit?
The bull case sees an economy and stock market driven by business-friendly fiscal policies under Trump 2.0 including deregulation, lower corporate tax rate, and restoration of civil liberties and constitutional freedoms should also be stimulative and might fuel disinflation (as opposed to the inflation that many critics expect). Trump’s energy policies are also likely to be disinflationary. Capital flight into the US (most of which stays outside our banking system and therefore is not captured by M2), huge corporate capex, less deficit spending (and politburo-style “malinvestment” and mandates), and strong productivity growth, and rising velocity of money that offsets any tightening in money supply growth.
According to Capital Group, a mid-cycle economy typically displays rising corporate profits, accelerating credit demand, modest inflationary pressures, and a move toward neutral monetary policy—all of which occurred during 2024. And besides expectations of a highly aggressive 15% earnings growth in the S&P 500 over the next couple of years, Silicon Valley VC Shervin Pishevar recently opined, “I think there’s going to be a renaissance of innovation in America…It’s going to be exciting to see… AI is going to accelerate so fast we’re going to reach AGI [Artificial General Intelligence, or human-like thinking] within the next 2-3 years. I think there will be ‘Manhattan Projects’ for AI, quantum computing, biotech.” So, it all sounds quite good.
However, my observation is that GDP and jobs growth have been highly reliant on huge government deficit spending bills, which is not so good. The Atlanta Fed’s GDPNow model forecasts Q4 GDP to come in at just 2.7%, which is sluggish growth considering the huge amount of government money and corporate capex being spent. Rising bond yields and strengthening US dollar means less liquidity and tighter financial conditions, which are negatives for risk assets. The incoming administration—free this time of the unknowing appointment of deep-state obstructionists like in his first term—is suggesting a new tack characterized by smaller government and the unleashing of animal spirits in the private sector, with the goal of achieving GDP growth north of 4%.
So, for 2025, I expect strong fiscal and monetary policy support for economic growth (albeit with some pains and stumbles along the way as government spending is reined in) as well as moderating inflation as shelter costs recede, military conflicts are resolved (war is inflationary), and deflationary impulses arrive from struggling economies in China and Europe. I also expect stocks and bonds will both attain modest gains by year end (albeit with elevated volatility along the way). In this transitional year in which a more politically seasoned Donald Trump’s policies and leadership have gained broader support domestically across demographics (and indeed across the world), how it all gets off the ground and how quickly it generates traction this year will have profound implications for the rest of his term and beyond. Heck, even a growing contingent in ultra-blue California have become willing to give his approach a chance—further red-pilled by the disastrous LA wildfires (more on this below).
To me, the biggest question marks for our economy and stocks in 2025 (other than a Black Swan event) are: 1) the net impacts of Trump’s cost cutting efforts (on federal deficit spending and boondoggles) balanced with his pro-business policies and a supportive Fed, and 2) the impacts of economic growth struggles abroad. China is dealing with deflation (PPI has declined for 26 months in a row), a real estate crisis, weak retail sales, and surging excess savings among a shrinking population. Since the Global Financial Crisis, China’s marginal returns on capital have plunged from around 14% to barely 5% (on par with the US). As for the Eurozone, its share of world GDP has fallen from a high of 26.4% in 1992 to just 14.8% in 202, as its obsession with renewable electricity (rather than fossil fuels and nuclear) costing 5x the price of conventionally produced electricity—and driving low returns on capital and thus capital flight. As MacroStrategy Partners UK has opined, “With all of GDP [essentially] an energy conversion, our future depends on either extending fossil fuel production further or developing nuclear.”
Indeed, the US remains the beacon of hope for global investors. However, at the moment, surging bond yields, weak market internals, and a strengthening dollar suggest investors have grown cautious. All the major stock and bond indexes fell below their 50-day simple moving averages (although they are trying to regain them today, 1/15). Inflation hedges gold and bitcoin have risen back above theirs, but all these asset classes have lost both their momentum in concert with sluggish global liquidity growth since October (as pointed out by economist and liquidity guru Michael Howell of CrossBorder Capital). Of course, rising real yields tend to reduce the appeal of gold, and nominal yields have been rising much faster than the modest (and likely temporary) uptick in inflation.
Indeed, the latest PPI and CPI readings this week show stabilization, which the markets cheered (across all asset classes). As I write, the 10-year Treasury yield has fallen below 4.70% and the 20-year dropped below the important 5% handle. Hopefully, this will stem the rise in 30-year mortgage rates, which are above 7.0%, creating a big impediment to the critical housing market. The delinquency rate on commercial office MBS jumped to a record 11% in December, which is the highest since the Global Financial Crisis. Consumer credit card defaults jumped to a 14-year high as average cc interest rates hit a record high, now in excess of 23%. And then we have our federal government needing to roll over at least $16 trillion (of our $36.2 trillion debt) during the next four years.
Although Michael Howell thinks the 10-year Treasury yield could continue to rise to perhaps 5.5%, which would be a huge definite negative for risk assets, my view is that bond prices will soon find support (and stabilize yields), which would help stocks stabilize as well. After all, US Treasury yields are attractive in that they are among the highest among developed markets, and the two largest economies are diverging, with China’s yields collapsing (10-year below 1.7%) as US yields surged. Indeed, debt deflation and sluggish economic conditions in China are at risk of creating a deflationary spiral. Also, the traditional 60/40 stock/bond portfolio rebalancing is taking place, which shifts capital from equities to bonds.
If I am right and the bottom in 20-year Treasury price (i.e., peak yield) is nigh (as it retests its low from April 2024), we likely would see the dollar decline, gold rally, and bond yields fall, which would be a tailwind for growth stocks. Ultimately, I expect the terminal fed funds rate will be around 3.50% (from today’s 4.25-4.50%), although it might not get there until 2026, and I think the 10-year will gradually settle back to around 4.25%.
Assuming AI and blockchain capital spending and productivity gains are already largely priced into the lofty Big Tech valuations, perhaps this is the year that the market finally broadens in earnest such that opportunities can be found among small caps, bonds and dividend paying stocks, value, and cyclical sectors like Financials, Industrials, and Transports (and perhaps segments of Energy, like natural gas production, liquefication, and transport), However, the Basic Materials sector, particularly industrial commodities (like copper), may struggle with weak Chinese demand, and because many commodities are priced in dollars, a strong dollar reduces purchasing power among all our trading partners, which further hinders demand. As such, Materials continues to rank at the bottom of Sabrient’s SectorCast rankings.
I go into all of this (and more, including my outlook for 2025) in my full post below. Overall, my suggestion to investors remains this. Don’t chase the highflyers and instead focus on high-quality businesses at reasonable prices, hold inflation and dollar hedges like gold and bitcoin, expect elevated volatility given the uncertainty of the new administration’s policies and impact, and be prepared to exploit any market pullbacks by accumulating those high-quality stocks in anticipation of gains by year end and beyond, fueled by massive capex in blockchain and AI applications, infrastructure, and energy, leading to rising productivity, increased productive capacity (“duplicative excess capacity,” in the words of Treasury Secretary nominee Scott Bessent, would be disinflationary), and economic expansion.
When I say, “high-quality company,” I mean one that is fundamentally strong by displaying a history of consistent, reliable, and accelerating sales and earnings growth, positive revisions to Wall Street analysts’ consensus forward estimates, rising profit margins and free cash flow, solid earnings quality, and low debt burden. These are the factors Sabrient employs in selecting our portfolios. We also use many of those factors in our SectorCast ETF ranking model. And notably, our Earnings Quality Rank (EQR) is a key factor in each of these models, and it is also licensed to the actively managed, absolute-return-oriented First Trust Long-Short ETF (FTLS).
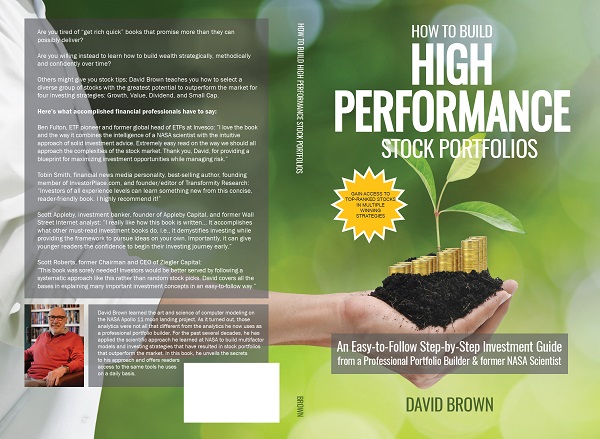
Sabrient founder David Brown describes these (and other) factors and his portfolio construction process in his new book, How to Build High Performance Stock Portfolios, which is available on Amazon for investors of all experience levels. David describes his path from NASA engineer on the Apollo 11 moon landing project to creating quant models for ranking stocks and building stock portfolios in 4 distinct investing styles—growth, value, dividend, or small cap growth. To learn more about David's book and the companion subscription product we offer that does most of the stock evaluation work for you, visit: https://DavidBrownInvestingBook.com
As a reminder, our research team at Sabrient leverages a process-driven, quantitative methodology to build predictive multifactor models, data sets, stock and ETF rankings, rules-based equity indexes, and thematic stock portfolios. As you might expect from former engineers, we use the scientific method and hypothesis-testing to build models that make sense—and we do that for growth, value, dividend, and small cap strategies. We have become best known for our “Baker’s Dozen” growth portfolio of 13 diverse picks, which is packaged and distributed quarterly to the financial advisor community as a unit investment trust, along with 3 other offshoot strategies for value, dividend, and small cap investing.
In fact, the Q1 2025 Baker’s Dozen will launch this Friday 1/17, followed by Small Cap Growth on 1/22 and then Dividend on 2/11.
Lastly, let me make a brief comment on the LA wildfires. It seems every wildfire in SoCal has always ended when “we got lucky,” as the fire chiefs and local meteorologists would say, due to the winds tapering off and/or rains arriving just in time. I certainly saw this firsthand a few times during my 20 years raising a family in Santa Barbara. And I always wondered, what will happen when this “luck” doesn’t materialize the next time? Of course, even if one believes that reversing climate change is humanly possible, the lengthy timetable to decarbonization (while countries like China and India continue to increase carbon emissions by burning coal at record amounts to generate 60% and 70% of their electricity, respectively) means that proper preparation today for disasters is essential. And yet California’s leadership was doing the opposite, prioritizing specious social justice agendas while degrading readiness for the “perfect storm” of wildfire conditions…when luck fails to arrive. My deepest sympathies, thoughts, and prayers go out to all those impacted by this preventable tragedy.
Click HERE to continue reading my full commentary online or to sign up for email delivery of this monthly market letter. Also, here is a link to this post in printable PDF format. I invite you to share it as appropriate (to the extent your compliance allows).
 by Scott Martindale
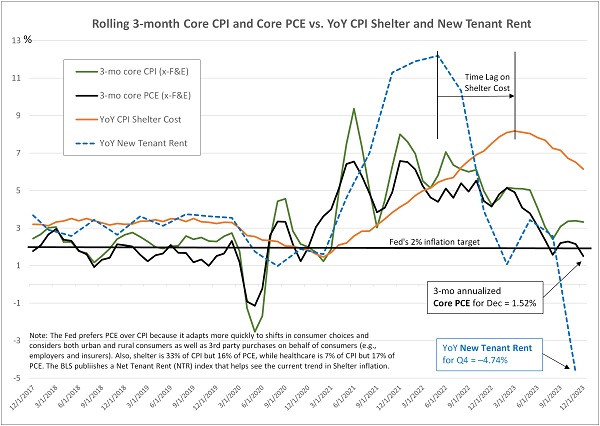
 by Scott Martindale