 by Scott Martindale
President & CEO, Sabrient Systems LLC
Last week, the much-anticipated inflation readings for May—and the associated reaction from the Fed on planned rate cuts—was pretty much a non-event. The good news is core inflation continues to gradually fall. The bad news is it isn’t falling fast enough for the Fed. Headline CPI and PPI are pretty much stagnant over the past 12 months. This led the Fed to be mealy-mouthed about rate cuts. One might ask, why does it matter so much what the Fed does when the economy is doing fine, we have avoided recession, wages are growing, jobs are plentiful, unemployment is low, and asset prices are rising?
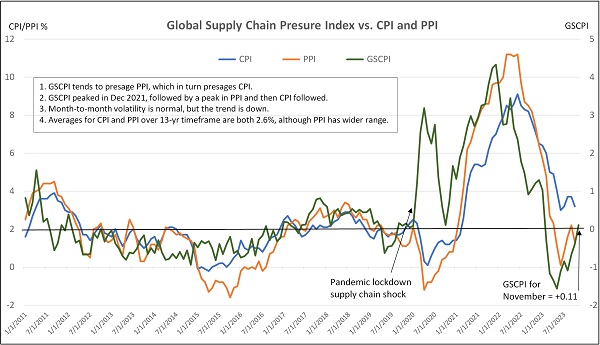
But the reality is there is a slow underlying deterioration happening from the lag effects of monetary tightening that is becoming increasingly apparent, including a lack of organic jobs and GDP growth (which is instead largely driven by government deficit spending) and a housing market (important for creating a “wealth effect” in our society) that is weakening (with growing inventory and slowing sales) given high mortgage rates that make for reluctant sellers and stretched buyers (notably, the 10-year yield and mortgage rates have pulled back of late just from rate cut talk). Moreover, real-time shelter inflation (e.g., rent) has been flat despite what the long-lagged CPI metrics indicate, and the real-time, blockchain-based Truflation reading has been hovering around 2.2% YoY, which happens to match the April and May PPI readings—all of which are very close to the Fed’s 2.0% inflation target.
Of course, stock market valuations are reliant upon expectations about economic growth, corporate earnings, and interest rates; and interest rates in turn are dependent on inflation readings. Although some observers saw promising trends in some components of May CPI and PPI, Fed chair Jay Powell played it down with the term “modest further progress,” and the “dot plot” on future rate cuts suggests only one or perhaps two rate cuts later this year.
Nevertheless, I continue to believe the Fed actually wants to cut rates sooner than later, and likely will do so during Q3—especially now that central banks in the EU, Canada, Sweden, Switzerland, Brazil, Chile, and Mexico have all cut rates. Moreover, Japan is struggling to support the yen with a positive interest rate—but it needs to keep rates low to prevent hurting its highly leveraged economy, so it needs the US to cut rates instead. The popular yen “carry trade” (short the yen, buy the dollar and US Treasuries) has been particularly difficult for the BoJ. All told, without commensurate cuts here in the US, it makes the dollar even stronger and thus harder on our trading partners to support their currencies and on emerging markets that tend to carry dollar-denominated debt. I talk more about this and other difficulties outside of the (often misleading) headline economic numbers in today’s post—including the “tapped out” consumer and the impact of unfettered (wartime-esque) federal spending on GDP, jobs, and inflation.
As for stocks, so far, the market’s “Roaring 20’s” next-century redux has proven quite resilient despite harsh obstacles like global pandemic, multiple wars, a surge in inflation, extreme political polarization and societal discord, unpredictable Fed policy, rising crime and mass immigration, not to mention doors flying off commercial aircraft (and now counterfeit titanium from China!). But investors have sought safety in a different way from the past, particularly given that stubborn inflation has hurt real returns. Rather than traditional defensive plays like non-cyclicals, international diversification, and fixed income, investors instead have turned to cash-flush, secular-growth, Big Tech. Supporting the bullishness is the CBOE Volatility Index (VIX), which is back down around the 12 handle and is approaching levels not seen since 2017 during the “Trump Bump.” And given their steady performance coupled with the low market volatility, it has also encouraged risk-taking in speculative companies that may ride coattails of the Big Tech titans.
But most of all, of course, driving the rally (other than massive government deficit spending) has been the promise, rapid development, and implementation of Gen AI—as well as the new trends of “on-premises AI” for the workplace that avoids disruptions due to connectivity, latency, and cybersecurity, and AI personal computers that can perform the complex tasks of an analyst or assistant. The Technology sector has gone nearly vertical with AI giddiness, and it continues to stand alone atop Sabrient’s SectorCast rankings. And AI poster child NVIDIA (NVDA), despite being up 166% YTD, continues to score well in our Growth at Reasonable Price (GARP) model (95/100), and reasonably well in our Value model (79/100).
Nevertheless, I continue to believe there is more of a market correction in store this summer—even if for no other reason than mean reversion and the adage that nothing goes up in a straight line. Certainly, the technicals have become extremely overbought, especially on the monthly charts—which show a lot of potential downside if momentum gets a head of steam and the algo traders turn bearish. On the other hand, the giddy anticipation of rate cuts along with the massive stores of cash in money market funds as potential fuel may well keep a solid bid under stocks. Either way, longer term I expect higher prices by year end and into 2025 as high valuations are largely justified by incredible corporate earnings growth, a high ratio of corporate profits to GDP, and the promise of continued profit growth due to tremendous improvements in productivity, efficiency, and the pace of product development across the entire economy from Gen AI. In addition, central banks around the world are starting to cut rates and inject liquidity, which some expect to add as much as $2 trillion into the global economy—and into stocks and bonds.
On another note, it is striking that roughly half the world’s population goes to the polls to vote on their political leadership this year, and increasingly, people around the world have been seeking a different direction, expressing dissatisfaction with the status quo of their countries including issues like crime, mass immigration (often with a lack of assimilation), sticky inflation, stagnant economic growth, and a growing wealth gap—all of which have worsened in the aftermath of the pandemic lockdowns and acquiescence to social justice demands of the Far Left. Ever since the Brexit and Trump victories in 2016, there has been a growing undercurrent of populism, nationalism, capitalism, and frustration with perceived corruption, dishonesty, and focus on global over local priorities. Not so long ago, we saw a complete change in direction in El Salvador (Bukele) and Argentina (Milei) with impressive results (e.g., reducing rampant crime and runaway inflation), at least so far. Most recently, there were surprises in elections in India, Mexico, and across Europe. Although we are seeing plenty of turmoil of our own in the US, global upheaval and uncertainty always diverts capital to the relative safety of the US, including US stocks, bonds, and the dollar.
I expect US large caps to remain an attractive destination for global investment capital. But while Tech gets all the (well deserved) attention for its disruptive innovation and exponential earnings growth, there are many companies that can capitalize on the productivity-enhancing innovation to drive their own growth, or those that are just well positioned as “boring” but high-quality, cash-generating machines that enjoy strong institutional buying, strong technicals, and strong fundamentals in stable, growing business segments—like insurers and reinsurers for example.
So, I believe both US stocks and bonds will do well this year (and next) but should be hedged with gold, crypto, and TIPS against a loss in purchasing power (for all currencies, not just the dollar). Furthermore, I believe all investors should maintain exposure to the Big Tech titans with their huge cash stores and wide moats, as well as perhaps a few of the speculative names (as “lottery tickets”) having the potential to profit wildly as suppliers or “coat-tailers” to the titans, much of their equity exposure should be in fundamentally solid names with a history of and continued expectations for consistent and reliable sales and earnings growth, rising profit margins and cash flow, sound earnings quality, and low debt.
Indeed, Sabrient has long employed such factors in our GARP model for selecting our growth-oriented Baker’s Dozen portfolio, along with other factors for other portfolios like our Forward Looking Value portfolio, which relies upon our Strategic Valuation Rank (SVR), our Dividend portfolio, which is a growth & income strategy that relies on our proprietary Dividend Rank (DIV), and our Small Cap Growth portfolio, an alpha-seeking alternative to the Russell 2000. Notably, our Earnings Quality Rank (EQR) is not only a key factor we use internally for each of these portfolios, but it is also licensed to the actively managed First Trust Long-Short ETF (FTLS) as an initial screen.
Each of these alpha factors and how they are used within Sabrient’s Growth, Value, Dividend income, and Small Cap investing strategies is discussed in detail in David Brown’s new book, How to Build High Performance Stock Portfolios, which will be published imminently. (I will send out a notification soon!)
In today’s post, I talk more about inflation, the Fed, and the extreme divergences in relative performance and valuations. I also discuss Sabrient’s latest fundamentals based SectorCast quantitative rankings of the ten U.S. business sectors (which, no surprise, continue to be led by Technology), current positioning of our sector rotation model, and several top-ranked ETF ideas. And don’t skip my Final Comments section, in which I have something to say about BRICS’ desire to create a parallel financial system outside of US dollar dominance, and the destructiveness of our politically polarized society and out-of-control deficit spending.
Click here to continue reading my full commentary. Or if you prefer, here is a link to this post in printable PDF format (as some of my readers have requested). Please feel free to share my full post with your friends, colleagues, and clients. You also can sign up for email delivery of this periodic newsletter at Sabrient.com.
 by Scott Martindale
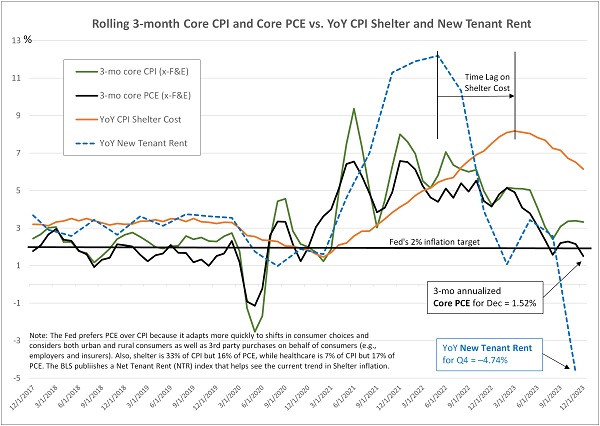
 by Scott Martindale