Sector Detector: Stocks face a crossroads in balancing valuations, earnings, inflation, interest rates, and China
 by Scott Martindale
President & CEO, Sabrient Systems LLC
Stocks and bonds both sold off in August before finishing the month with a flourish, as signs that the jobs market is weakening suggest an end to Fed rate hikes is nigh. The summer correction in equities was entirely expected after the market’s extraordinary display of strength for the first seven months of the year in the face of a relentlessly hawkish Federal Reserve, even as CPI and PPI have fallen precipitously. State Street’s Institutional Investor Risk Appetite Indicator moved dramatically from bearish in May to highly bullish at the end of July, and technical conditions were overbought. And although the depth of the correction took the bulls by surprise, it was quite orderly with the CBOE Volatility Index (VIX) staying tame (i.e., never even approaching the 20 handle). In fact, a 5% pullback in the S&P 500 is not unusual given the robust 20% YTD return it had attained in those seven months. Weakness in bonds, gold, and commodity prices also reversed.
Moreover, IG, BBB, and HY bond spreads have barely moved during this market pullback despite rising real rates, which signals that the correction in stocks is more about valuations in the face of the sudden spike in interest rates (and fears of “higher for longer”) rather than the health of the economy, earnings, or fundamentals. Certainly, the US economy looks much stronger than any of our trading partners (which Fed chair Powell seems none too happy about), with the Atlanta Fed’s GDPNow model estimating a robust 5.6% growth for Q3 (as of 8/31) and the dollar surging in a flight to safety [in fact, the US Dollar Index Fund (UUP) recently hit a 2023 high].
However, keep in mind that the US is not an island unto itself but part of a complex global economy and thus not immune to contagion, so the GDP growth rate will likely come down. Moreover, Powell said in his Jackson Hole speech that the Fed’s job is “complicated by uncertainty about the duration of the lags with which monetary tightening affects economic activity and especially inflation.”
Investors have generally retained their enthusiasm about stocks despite elevated valuations, rising real interest rates (creating a long-lost viable alternative to stocks—and a poor climate for gold), a miniscule equity risk premium, and a Fed seemingly hell-bent on inducing recession in order to crush sticky core inflation. Perhaps stock investors have been emboldened by the unstoppable secular force of artificial intelligence (AI) and its immediate benefits to productivity and profitability (not just “hope”)—as evidenced by Nvidia’s (NVDA) incredible earnings release last week.
I have discussed in recent posts about how the Bull case seems to outweigh the (highly credible) Bear case. However, the key tenets of the Bull case—and avoidance of recession—include a stable China. Since 2015, I have been talking about a key risk to the global economy being the so-called “China Miracle” gradually being exposed as a House of Cards, and perhaps never before has it seemed so close to implosion, as it tests the limits of debt-fueled growth—and a creeping desperation coupled with an inability (or unwillingness) to pivot sharply from its longstanding policies makes it even more dangerous. I talk more about this in today’s post.
Yet despite all the significant challenges and uncertainties, I still believe stocks are in a normal/predictable summer consolidation—particularly after this year’s surprisingly strong market performance through July—with more upside to come. My only caveat has been that the 2-year Treasury yield needs to remain below 5%—a critical “line in the sand,” so to speak. Although I (and many others) often cite the 10-year yield because of its link to mortgage rates, I think the 2-year is important because it reflects a broad expectation of inflation and the duration of the Fed’s “higher for longer” policy. Notably, during this latest spike in rates, the 2-year again eclipsed that critical 5-handle for the third time this year and challenged the 7/5 intraday high of 5.12%, before pulling back sharply to close the month below 4.9%.
If the 2-year reverses again and surges to new highs, I think it threatens a greater impact on our economy (as well as our trading partners’) as businesses, consumers, and governments manage their maturing lower-rate debt—and ultimately impacts the housing market and risk assets, like stocks. But instead, I see it as just another short-term rate spike like we saw in March and July, as investors sort out the issues described in my full post below. Indeed, August finished with a big fall in rates in concert with a big jump in stocks, gold, crypto, and other risk assets across the board, as cracks in the jobs and housing markets are showing up, leading to a growing belief that the Fed is finished with its rate hikes—as I think they should be, particularly given the resumption of disinflationary secular trends and a deflationary impulse from China.
Some economists believe that extreme stock valuations and the ultra-low equity risk premium are pricing in both rising earnings and falling rates—an unlikely duo, in their view, on the belief that a strong economy is inherently inflationary while a weakening economy suggests lower earnings—and thus, recession is inevitable. But I disagree. For one, respected economist Ed Yardeni has observed that we have already been in the midst of a “rolling recession” across segments of the economy that is now turning into a “rolling expansion.” And regarding elevated valuations in the major indexes, my observation is that they are primarily driven by a handful of mega-cap Tech names. Minus those, valuations across the broader market are much more reasonable, as I discuss in today’s post.
Indeed, rather than passive positions in the broad market indexes, investors may be better served by strategies that seek to exploit improving market breadth and the performance dispersion among individual stocks. Sabrient’s portfolios include Baker’s Dozen, Forward Looking Value, Small Cap Growth, and Dividend, each of which provides exposure to market segments and individual companies that our models suggest may outperform. Let me know how I can better serve your needs, including speaking at your events (whether by video or in person).
As stocks and other risk assets finish what was once destined to be a dismal month with a show of renewed bullish conviction, allow me to step through in greater detail some of the key variables that will impact the market through year-end and beyond, including the economy, valuations, inflation, Fed policy, the dollar, and China…and why I remain bullish. I also review Sabrient’s latest fundamentals based SectorCast quant rankings of the ten U.S. business sectors (topped by Technology and Energy) and serve up some actionable ETF trading ideas.
Click here to continue reading my full commentary … or if you prefer, here is a link to my full post in printable PDF format (as some of my readers have requested).
Market commentary:
From a technical standpoint, the stock market was indeed getting overheated mid-summer, with the S&P 500 (SPY) up about +20% and the Nasdaq 100 (QQQ) +45% YTD through 7/31—even the left-for-dead “meme” stocks were getting attention again, with the Roundhill MEME ETF (MEME) +70%. But as you might expect, August was quite harsh on MEME, as it fell as much as -25%.
At the depths of the August selloff, the S&P 500 put/call ratio spiked to around 1.0 (the “panic zone”) while the McClellan Oscillator sunk to an extreme level—both historically indicative of a market bottom (at least for the short term). At one point, according to Bespoke Investment Group, "The percentage of S&P 500 stocks above their 50-DMAs has dipped all the way down to 35%, while net new 52-week lows are expanding. This month we've already seen negative daily breadth on 11 of 13 trading days, which is another sign that the selling is getting near extreme levels...."
However, the normal August weakness in stocks seemed to have been worsened not just by both those overbought technical conditions but also with the sudden and rapid weakness in bond markets and the resultant rise in real interest rates (as nominal rates spiked while inflation remained stable). Admittedly, the surge in yields took me by surprise, particularly given the steep drop in inflation and restored supply chains. Catalysts for the selloff in bonds (and the commensurate rise in both nominal and real yields) include:
- “Higher for longer” expectation for interest rates due to persistently hawkish Fed language (e.g., July FOMC minutes suggesting “significant upside risks to inflation, which could require further tightening of monetary policy”)
- Fed QT (quantitative tightening), as it allows maturing bonds to roll off the balance sheet—and not replace them (which reduces demand for Treasuries)
- The so-called “bond vigilantes” protesting the massive bond auctions this month (by selling their holdings or boycotting the auction), out of disdain for our federal government’s fiscal profligacy and expanding deficit during a time of positive GDP growth
- Lower demand from foreign buyers of US Treasuries like China and Saudi Arabia, who have shrunk holdings to multi-year lows
- The escalating “dollar revolt” by the BRICS+ countries who are pushing for an alternative reserve currency (and perhaps a gold standard)
- The worsening economic situation in China’s economy and its descent into deflation, which threatens a slowdown of the global economy (despite the short-term benefit of reducing inflation in the rest of the world)
In aggregate, these catalysts created a climate of increasing supply of bonds in the face of falling demand. But since 8/21, both stocks and bonds have rebounded nicely. We’ll see if the underlying bid persists.

Inflation and Fed policy:
One would think the economy would be hard-pressed to avoid recession given the steep yield curve inversion, the rapidity of Fed rate hikes, the balance sheet roll-off/M2 contraction, and 16 months in a row of falling Conference Board LEI—which is the longest streak since 2007-8 and now down -10.2% from its December 2021 record high. But instead, the economy has held up. Famed economist Ed Yardeni thinks we have been in the midst of a “rolling recession” across segments of the economy that is now turning into a “rolling expansion.” And although we got some labor reports this week that showed weakening in the jobs market with slower wage inflation, rising labor participation, and unemployment ticking up to 3.8% for August, unemployment is still quite low. In Fed Chairman Powell’s words, “We’ve seen so far the beginnings of disinflation without any real costs in the labor market…that’s a really good thing.”
Nevertheless, as I have written about frequently in the past, that is, the Fed will be constrained in raising rates by the unintended impacts outside of its focus on US inflation and unemployment—particularly as real rates rise. These include the critical banking sector and housing market, as well as emerging markets and our primary international trading partners. But it’s not the height of interest rates that matters as much as how long they stay high.
The average 30-year mortgage rate has surpassed 7.5% for the first time since 2000, and the National Association of Realtors (NAR) reported that existing-home sales were down -16.6% year over year. For the moment, it may seem that mortgage rates and their impact on the all-important housing market (for consumer “wealth effect”) seem to be the only part of the economy significantly impacted by rising rates, as businesses and consumers remain surprisingly resilient. But the lag effects—once they arrive in earnest—may be onerous. As Powell said in his Jackson Hole speech, the Fed’s job is “complicated by uncertainty about the duration of the lags with which monetary tightening affects economic activity and especially inflation.”
For example, the banking system has been struggling with the inverted yield curve, particularly regional banks as depositors find much higher rates in money market funds. According to the St. Louis Fed, Powell & Co. may have to pause efforts to shrink the balance sheet to ensure the banking system remains stable. So far, the decline in M2 money supply over the past year has been offset by a sharp rise in the velocity of money stock, but that might not be enough on its own to accommodate demand. Indeed, M2 has started to creep back up, and our federal government’s profligacy and expanding deficit (which is unnecessary given strength in the economy), including spending earmarked for manufacturing facilities (e.g., semiconductors) as part of the mislabeled Inflation Reduction Act, is set to increase during Q4 and must be financed by expanding debt issuance of another $2.9 trillion in Treasury bonds this year and $2.4 trillion next year.
In addition, interest payments on a massive federal debt load are eating up a growing percentage of the federal budget. I have written in the past about higher debt-to-GDP ratios not being an issue because of the historically low debt carrying costs, but of course that no longer applies given the rapid rise in interest rates.
Furthermore, despite the competitive intentions of BRICS nations, the world remains hungry for dollars in a hyper-financialized global economy, given that 85% of foreign exchange transactions, 60% of foreign exchange reserves, and 50% of cross-border loans and international debt are in US dollars. This limits the Fed’s flexibility to shrink (or even flatten) the money supply. And as for interest rates, the reality is that a rising dollar is painful to other currencies by exacerbating inflationary pressures for our trading partners and any country with dollar-denominated debt service while its revenues come in local currencies. It has been estimated that 60% of lower-income countries have entered some level of “debt distress.”
What would force the Fed’s hand to pause, in my view, would be the combination of a falling housing market, irate bond vigilantes, and overseas sovereign debt crises stemming from an ultra-strong dollar (which creates widespread dumping of US Treasuries by our trading partners so they can bolster their own currencies and debt—for example, the Japanese yen has fallen more than 20% versus the dollar this year).
Although Fed chair Powell has insisted that he won’t be ready to cut rates anytime soon unless inflation falls closer to the 2% goal, the job market stumbles badly, and/or the economy falls into recession, at least for now, his latest comments at Jackson Hole seem to have adequately straddled the line between hawkish and neutral/dovish to placate investors. Nevertheless, I believe the Fed has already gone well beyond the neutral rate and needs to stop raising interest rates now—and likely will be in a position to start cutting rates in early 2024, if not sooner. At the moment, CME Group fed funds futures are still pricing in roughly 30% chance of another 25-bp rate hike by year end.
Sure, there are some indications that inflation might tick up a bit in the short-term, such as from higher gasoline prices, the drought-induced bottleneck through the Panama Canal and Mississippi River, Ukraine grain blockades, etc. But, as I have been pounding the table on for some time, inflation is falling fast as supply chains mend and the global secular disinflationary trends resume, e.g., aging demographics, slowing population growth, accelerating disruptive/transformational/productivity-enhancing innovation and automation, and, yes, globalization of supply chains—albeit with some “onshoring” and “friend-shoring” of manufacturing to reduce dependency on adversarial countries. Indeed, PPI has crashed, and China’s slowdown has created a deflationary impulse.
Looking ahead, although refining margins are quite high, it appears inflation in core components like housing rents and new vehicles is fading. By Q4 2024, JPMorgan chief global strategist David Kelly expects both headline and core PCE to approach the Fed’s 2% target.
That would be a welcome development given that the Fed wants monetary conditions to remain tight until either inflation comes back down to target levels, unemployment rises to unacceptable levels, or “something breaks” in the financial system. So far, while inflation is still above the Fed’s target and unemployment remains stubbornly low, some things have indeed started to “break” in our highly leveraged economy, to wit:
- Banking failures or struggles at Silvergate, Silicon Valley, Signature Bank, First Republic, Credit Suisse, and Deutsche Bank, and S&P and Moody’s downgrading of US banks due to declining deposits
- Housing market slowdown due to low inventory and affordability
- Commercial real estate foreclosures, such as Columbia Property Trust’s default on floating-rate loans and Brookfield Asset Management’s default on its Los Angeles properties
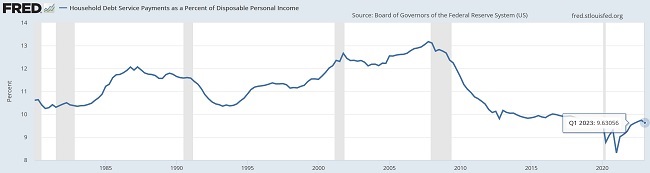
However, although consumer credit card debt has hit a record (now over $1 trillion), household debt is over $17 trillion, and delinquencies are rising among US consumers, it should be noted that debt service payments as a percentage of personal income has ticked down and remains well below the long-term average, as shown in the chart below (albeit only updated through Q1).
Once the economy fully reflects the impacts of the rapid rise in interest rates, the steeply inverted yield curve, a normalized global supply chain, reduced bank lending, the Fed’s balance sheet roll-off/M2 contraction (albeit partially offset by a reversal in the secular decline in velocity of money supply), a weakening labor market, reduced consumer spending, the strong US dollar, and resumption of the many disinflationary secular trends—including the impact of China’s deflation on the global economy, it might allow the Fed to pronounce its war on inflation done, leading to a policy pivot that would be expected to spark a market rally across risk assets.
BRICS revolt against the dollar:
As for the BRICS nations organizing a revolt against the supremacy and reserve currency status of the all-mighty dollar (which admittedly the US often weaponizes via sanctions to keep rogue nations in line), they have been stockpiling gold to support their currencies with real assets (and gold is always priced in dollars) and to potentially provide a gold standard for an alternative reserve currency. In addition, the organization is bolstering its clout by expanding from its five-nation core (Brazil, Russia, India, China, South Africa) to include (starting on 1/1/2024) six new members: Saudi Arabia, Argentina, Egypt, Ethiopia, Iran, and UAE.
Almost all of this new group of 11 (except for UAE) reside in the bottom half of the Heritage Foundation 2023 Index of Economic Freedom, which ranks 176 countries, and four of them (China, Egypt, Ethiopia, and Iran) are in the lowest “Repressed” category, while Egypt may be on the brink of bankruptcy. And now we learn that Russia is seeking a trade alliance with North Korea (the lowest-ranked country in the Heritage Foundation Index)—for weapons of course (what else could they get from NK?). So, this is a sketchy crew to be associated with—and a big reason why I’m not particularly worried about the dollar being dethroned anytime soon.
Moreover, replacing the dollar is a tall task given the high debts these nations (indeed, all nations) carry, often denominated in US dollars. But the dollar tends to rise as a global safe haven whenever there is global turmoil afoot. As Brent Johnson of Santiago Capital said, “The world can’t dedollarize without deleveraging, but it can’t deleverage without deflation. The system can’t survive deflation because it is debt-based, so it must ‘grow or die.’ When a debt-based system deflates, the underlying collateral (i.e., the USD) rises. So, the world can’t dedollarize without USD rising.”
Equity valuations and “TINA”:
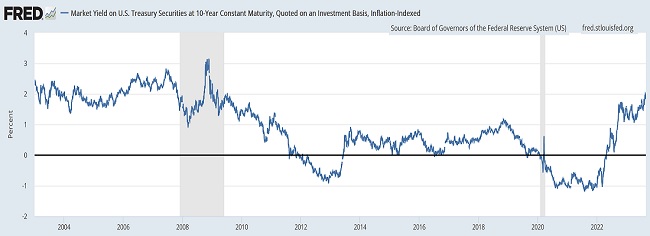
If we focus on the major cap-weighted S&P 500 and Nasdaq 100, history tells us that low or negative real interest rates are economically stimulative and tend to induce higher stock valuations, particularly during TINA (“There is no alternative”) time periods when real interest rates are too low to appeal to investors (and expected to remain so). Conversely, high real rates tend to restrict economic activity and inhibit corporate profits and stock prices. But today, the 10-year real yield recently bumped up against the 2.0% threshold, as shown in the chart below, hitting its highest level since 2009 before pulling back a bit to 1.83%. Although great for fixed income investors, it is bad for stock valuations and for a highly financialized economy (i.e., debt service).
Today, of course, TINA (to stocks) is no longer a thing given the rapid rise in interest rates, making bonds attractive. Just 3 years ago, we were still in a ZIRP Fed policy in which the highest yielding Treasury was 1.3% (on the 30-year), while the dividend yield on the S&P 500 was around 1.8%, i.e., 50 bps higher than the highest yielding Treasury. But today’s dividend yield of 1.4% is 270 bps lower than the lowest yielding Treasury of 4.1% (on the 10-year), while the highest yielding 6-month T-Bill of 5.5% is over 400 bps higher. Needless to say, there is indeed a strong alternative to stocks today. The only hesitation for investors has been whether yields would continue to rise (lowering the value of a bond). So, with the steeply inverted yield curve putting the juiciest yields at the short end of the curve, and with much less duration risk at the short end, holding cash in money market funds or high-yielding deposit accounts has been a popular choice.
However, as David Kelly, chief global strategist at JP Morgan, cautions, even given elevated stock valuations, “…long-term investors should resist the urge to hide out in cash…looking at every rate hiking cycle over the past 40 years, at the point of peak CD yields, there have always been better returns available elsewhere over the following 12 months.” So, the question becomes, are we nearing the peak in deposit yields now?
Bespoke Investment Group observed that, in analyzing trailing-12-month P/E, although the S&P 500 is pricey at over 22x, it is top-end loaded, led by the popular “Magnificent Seven” mega caps. They point out that while the 10 largest companies in the index have a median trailing P/E around 27x (3.7% TTM earnings yield), the median multiple of the other 493 companies (the index current holds 503 stocks) is only around 17x (5.9% TTM earnings yield). So, that’s quite a significant difference.
However, those large names also enjoy strong earnings growth, which many analysts say justify their premium valuations. So, if we look at forward-12-month P/E, the S&P 500 (SPY) displays a forward P/E of 19.2, which is still elevated given current interest rates (from a discounted cash flow standpoint). But the Equal-weight S&P 500 (RSP) is only 15.5x, S&P 400 MidCap (MDY) is 14.6x, S&P 600 Small Cap (SPSM) is 13.9x, and Russell 2000 SmallCap (IWM) is 14.5x.
So, looking at the market Equity Risk Premium (ERP), one way to calculate it is to add earnings yield plus dividend yield (expected equity return) and compare it to the “risk-free” 10-yr Treasury yield. Generally, 5% or more is considered an attractive ERP. Based on the current forward P/E of the cap-weighted S&P 500 (19.2x), its earnings yield is 5.2% plus a dividend yield of 1.4%, which equals 6.6%, and subtracting the 10-yr yield of 4.1% implies an ERP of 2.5%. However, to mitigate the size impact of the Magnificent Seven, if we instead use the forward earnings yield of equal-weight RSP of 6.5% plus its average dividend yield of 1.6%, it equals 8.1% and implies an ERP of 4.0%—which is much more appealing. And using SPSM, it computes 4.6% for the small cap risk premium. Perhaps stock valuations in general—outside of the Big Tech juggernauts—may not be so bad after all.
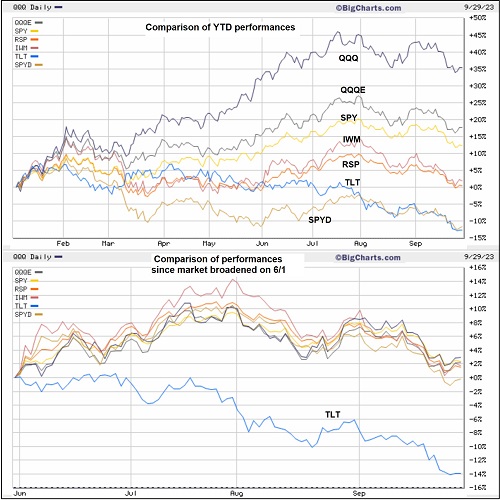
The chart below shows YTD performances of various segments of the equities market, as well as the improving market breadth since June 1. It compares the cap-weighted QQQ and SPY versus equal-weighted RSP, small cap IWM, S&P 500 High Dividend (SPYD), and the iShares 20+ Year Treasury (TLT). It illustrates how the stock market displayed an extreme investor preference for the mega-cap Tech juggernauts (which counterintuitively serve as a defensive play due to their market dominance and “wide moats”) until 7/31, but over the past 3 months has rotated into much better breadth across all segments, including smaller caps and high dividend payers. Also, you can see that SPYD and TLT are badly trailing YTD, but since 6/1 SPYD has kept up with the other equity indexes while TLT continued to sell off—until surging with the others over the past two weeks.
Of course, one of the higher valuation companies is semiconductor juggernaut Nvidia (NVDA), which just released an impressive earnings report—some call it the most stunning that anyone has ever seen from a major company. Why? Because generative AI/ML, accelerated quantum computing, and intelligent software have become the key disruptive/transformational technology of the 2020s, creating better performing products, improving productivity, improving efficiencies, and reducing costs, while driving a huge demand surge for data centers, cloud networking, and enterprise software systems, and NVDA products are the gold standard for all semiconductors critical to these technologies, not to mention gaming, graphics, metaverse, autonomous vehicles, robotics, crypto mining. It seems the only risk to the company’s growth trajectory is US government restrictions on chip sales to China, which represents nearly 25% of its data center business.
This is not pie-in-the-sky stuff like we saw during the Internet bubble. These are current, real-world applications in a major secular growth transition of the global economy, and NVDA is at the center of it all. And because the power requirement for these technologies is so great while our physical power grids are so outdated, it is also lifting technology development in onsite power generation solutions, superconductivity, and alternative energy. By the way, NVDA is a holding in Sabrient’s latest Q3 2023 Baker’s Dozen portfolio.
The key for corporate earnings growth (not spurred by inflation and pricing power) is a return to rising productivity, which is disinflationary—and wages, capital returns, and government tax receipts can all benefit from it. As we have learned from the AI frenzy and Nvidia’s (NVDA) stellar earnings report/outlook last week, a return to rising productivity may be at hand. Certainly, there has been a huge spike in capex on the construction of manufacturing facilities, robotics, automation, and AI.
China’s troubles:
Many of today’s concerns about China also arose in 2014, including slowing growth, deflation, overvalued property market, high debt levels, and currency devaluation, and then again in 2018 when President Trump launched his trade war. But fears didn’t seem quite this gloomy as the CCP always seemed to be able to stimulate/manipulate a resurgence. But with total debt as a percentage of GDP now exceeding 300% (up from under 200% in 2012), perhaps there are simply no more ghost towns to be built (to prop up employment and boost GDP) or neighboring countries to subjugate through debt (with the Belt & Road Initiative). Moreover, the true amount of debt is hard to know since much of it comes from off-balance sheet financing vehicles (aka “shadow banking”) which is approaching $9 trillion, and economic research firm Rhodium Group has estimated that roughly 80% of such financing firms do not have sufficient cash reserves to meet short-term debt obligations.”
The WSJ published a remarkable article last week entitled, “China’s 40-Year Boom Is Over…The economic model that took the country from poverty to great-power status seems broken, and everywhere are signs of distress.” Quoting from the article, “What ails China?... There are plenty of answers, from demographics to geopolitics to trade. But the key problem might boil down to household finances and, just as important, everyday citizens’ deeply shaken confidence that their lives will keep improving following China’s [pandemic] emergency... What is really new and notable about the current slowdown is a combination of exceptionally weak consumer prices, consumption, services-sector investment and property investment. All of this points firmly at households."
Specifically, this means a willingness for consumers to take risks, primarily by investing in properties, which has been the main investment for consumers for many years—sort of like their piggy bank—providing a key source of capital for the economic boom. But no longer. Instead, consumers are deleveraging and paying down debt. It’s hard to blame them. Recall the debt payment default by Evergrande a couple of years ago? Well, the company has filed for bankruptcy protection in the US, and now another developer Country Garden failed to meet a scheduled debt payment after reporting a record loss for the first half of 2023.
China is facing an overwhelming problem with its demographics trend. After enforcing a one-child policy from 1980 until 2016 to limit growth in a population that was hard to feed, it now is suffering the inevitable fallout, including a declining population, a culture conditioned to eschew large families, and an aging population. Soon the economy will have fewer than three working age citizens for every retiree. To make matters worse, the youth unemployment rate has doubled in the past four years to 20% in the 16-24 age group (today, updates for this number have been suspended). And of course, there is very little immigration like we have here. Already, the CCP is employing debt to support its retirees.
It is much like what Japan experienced. Decades of overbuilding in Japan in the 1980-90s led to a bursting of its own real estate bubble, leading to years of deflation and slow growth. Now China is feeling the same heat, along with a similarly shrinking labor force and declining productivity. So, it seems a pivot from big, expensive infrastructure projects to greater consumer spending on goods and services domestically is in order, much like Japan and the West. Today, household consumption makes up only about 38% of GDP (compared with nearly 70% in the US). But instead, the CCP is focused on growing its manufacturing capabilities in high-tech, like semiconductors and electric vehicles. But another recent WSJ article discussed the “collapsing electric-vehicle bubble” and observed that scrapyards around China are filled with EVs based on outdated technology, as supply far outstrips demand due to governmental policies rather than free market dynamics.
Its deflation and slowing economy have led to desperate measures, including cutting rates and boosting exports by dumping discounted consumer goods on the global market, whose prices are driven even lower by the weakening yuan. Beijing could choose to further stimulate the economy with lower interest rates and spending, but that risks further weakening its currency—and a weaker yuan encourages capital flight, which further weakens the yuan in a death spiral. Indeed, while US Treasury yields have surged to their highest levels since the Financial Crisis, the yuan is approaching its lowest level versus the dollar since 2007. Furthermore, falling domestic demand, excess manufacturing capacity, and slow sales of homes and land have depressed demand for (and prices of) commodities. All of this is likely to persist and even accelerate going forward, serving to suppress global inflationary pressures.
So, that’s a good thing, right? Yes, for the moment, its deflation impulse on the world economy helps to lower producer prices here at home and mitigate our inflationary pressures. But China had grown so big that it was forced to try reducing its reliance on exports as a mercantilist system (i.e., it is running out of customers to sell to), including building infrastructure (paid through debt) in poor countries that can’t afford to repay the debt. But more recently, it has tried to boost its domestic consumption as well. But as Chinese consumers tighten the belt, both domestic consumption and imports fall, which hits both domestic production and the many trading partners who have enjoyed tapping into the Chinese consumer market. Moreover, falling domestic consumption means more dumping of goods on the global market. So, although it might not be so apparent to our everyday lives today, the reason China’s health is important is that it is the second largest economy in the world—and had been rapidly approaching the US as the largest—so it’s distress will eventually permeate into the broader global economy.
Many have long believed that the China Miracle—i.e., rapid economic growth under a “neo-mercantilist” system that lifted its people from abject poverty into the manufacturing center of the world, enhanced by its acceptance into the WTO—would ultimately lead to its beating out the US in global technological, economic, and military hegemony, including the yuan replacing the US dollar as the world’s reserve currency (and the petrodollar becoming the “petroyuan”). But it is clear to me that our free economic system is far superior to encouraging long-run innovation, transformation, and advancement, not to mention individual inspiration, industriousness, and confidence.
Nevertheless, despite the overall solid (“Goldilocks”) picture for the US, struggles in China can’t be ignored given that it is the second largest economy in the world. I began talking about China’s “house of cards” economy and building “Minsky Moment” (i.e., economic collapse as the culmination of a period of reckless speculative activity) back in 2015, and I have named it as one of the key risks to my bullish thesis for the US. Please excuse the series of five cliches in the next sentence: Although it has been able to continually kick the can down the road by pulling a rabbit out of its hat so its economy could keep on trucking, the writing has been on the wall all along, and its unsustainable practices may be finally coming to roost. Some might say the US isn’t much better with our own reliance on debt and Ponzi-esque stock market, but the differences are significant enough—particularly the US dollar’s role as the word’s reserve currency (aka safe haven, accounting for 59% of global forex reserves).
Meanwhile, India is booming. But that’s another story.
In Summary:
Overall, I expect inflation will resume its decline, even with positive GDP growth, particularly given stagnant money supply growth, mended supply chains (encompassing manufacturing, transport, logistics, energy, and labor), stabilizing home prices and rents, slower consumer spending on goods, slowing wage inflation, and a deflationary impulse from China. This eventually will give the Fed license to cut rates—perhaps in early 2024 (or possibly sooner)—both to head off crises in banking and housing and to mitigate growing strains on businesses, consumers, and our heavily leveraged trading partners of an ultra-strong dollar and high interest rates when rolling maturing debt.
I think both equities and bonds are buyable today. Of course, Bill Ackman of Pershing Square Capital would disagree on bonds as he is short 30-yr Treasuries. His many reasons include structural changes to the global economy that will induce long-term inflation like deglobalization, high defense spending, the green energy transition, growing entitlements, and massive issuances of new bonds to pay for it all. Nevertheless, elevated valuations in the major cap-weighted indexes would suggest that investors expect either an imminent fall in yields (and rising bond prices) and/or a surge in earnings (stemming from strong economic growth). Otherwise, valuations would tend to contract, and stock prices would be expected to retreat.
However, as I illustrated above, if you look beyond the mega cap names (which trade in a category of their own), the average stock still displays a reasonable valuation, especially if earnings remain strong while real yields fall—and some stocks may be downright bargains. On that note, Sabrient’s Small Cap Growth Portfolio offers an alpha-seeking alternative to a passive position in the Russell 2000 or S&P 600 indexes for gaining small cap exposure.
Latest Sector Rankings:
Relative sector rankings are based on our proprietary SectorCast model, which builds a composite profile of each of over 1,000 equity ETFs based on bottom-up aggregate scoring of the constituent stocks. The Outlook Score is a Growth at a Reasonable Price (GARP) model that employs a forward-looking, fundamentals-based multifactor algorithm considering forward valuation, historical and projected earnings growth, the dynamics of Wall Street analysts’ consensus earnings estimates and recent revisions (up or down), quality and sustainability of reported earnings, and various return ratios. It helps us predict relative performance over the next 3-6 months.
In addition, SectorCast computes a Bull Score and Bear Score for each ETF based on recent price behavior of the constituent stocks on particularly strong and weak market days. A high Bull score indicates that stocks within the ETF recently have tended toward relative outperformance when the market is strong, while a high Bear score indicates that stocks within the ETF have tended to hold up relatively well (i.e., safe havens) when the market is weak. Outlook score is forward-looking while Bull and Bear are backward-looking.
As a group, these three scores can be helpful for positioning a portfolio for a given set of anticipated market conditions. Of course, each ETF holds a unique portfolio of stocks and position weights, so the sectors represented will score differently depending upon which set of ETFs is used. We use the iShares that represent the ten major U.S. business sectors: Financials (IYF), Technology (IYW), Industrials (IYJ), Healthcare (IYH), Consumer Staples (IYK), Consumer Discretionary (IYC), Energy (IYE), Basic Materials (IYM), Telecommunications (IYZ), and Utilities (IDU). Whereas the Select Sector SPDRs only contain stocks from the S&P 500 large cap index, I prefer the iShares for their larger universe and broader diversity.
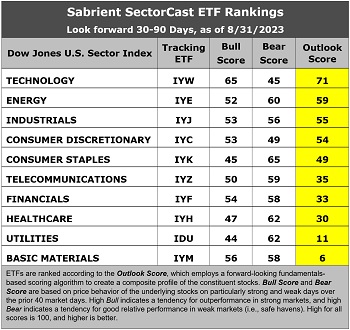
The latest fundamentals-based Outlook rankings display a solidly bullish bias given the dominance of economically sensitive and cyclical sectors at the top. Technology (IYW) takes the top spot with an Outlook Score of 71, followed by the rising Energy sector (IYE) at 59, Industrials (IYJ) at 55, and Consumer Discretionary (IYC) at 54, which are all either cyclical or high-growth secular sectors.
These four display the highest EPS growth forecasts, topped by IYC at 18.4% and IYW at 15.4%. Stocks composing IYW, IYJ, and IYE have received the largest upward revisions to EPS estimates among sell-side analysts, and IYE also boasts one of the lowest forward P/Es at 12.1x and the lowest forward PEG (forward P/E divided by projected EPS growth rate) at 1.15.
Defensive sector Utilities and beleaguered Basic Materials (IYM) are in the bottom two. In fact, analysts have slashed EPS growth forecasts for stocks within IYM by -23.8%, which actually bodes well for lower producer prices in the other sectors. Keep in mind, the Outlook Rank does not include timing, momentum, or relative strength factors, but rather reflects the consensus fundamental expectations at a given point in time for individual stocks, aggregated by sector.
As a reminder, if you have an interest in our quant rankings, we have a new product called Sabrient SmartSheets—one for individual stocks and one for ETFs. They are posted weekly in Excel format and show how your stocks and ETFs score in our various alpha factors…or for identifying the top-ranked stocks and ETFs for each alpha factor (or for weighted combinations of the factors).

ETF Trading Ideas:
Our rules-based Sector Rotation model, which appropriately weights Outlook, Bull, and Bear scores in accordance with the overall market’s prevailing trend (bullish, neutral, or defensive), has just reverted back to a bullish bias since SPY rose back above its 50-day simple moving average this week, after having fallen into a neutral posture during the August turmoil. It suggests holding Technology (IYW), Industrials (IYJ), and Consumer Discretionary (IYC), in that order. Energy just missed the cut. (Note: In this model, we consider the bias to be bullish from a rules-based trend-following standpoint when SPY is above both its 50-day and 200-day simple moving averages.)
If you prefer a neutral bias, the Sector Rotation model suggests holding Technology, Energy (IYE), and Industrials, in that order. Or, if you prefer to maintain a defensive stance, the model suggests holding Consumer Staples (IYK), Energy, and Healthcare (IYH), in that order.
An assortment of other interesting ETFs that are scoring well in our latest rankings include: AdvisorShares Vice (VICE), Alger 35 (ATFV), AdvisorShares Alpha DNA Equity Sentiment (SENT), Global X MSCI Argentina (ARGT), WBI BullBear Quality 3000 (WBIL), QRAFT AI-Enhanced US Large Cap Momentum (AMOM), WisdomTree Growth Leaders (PLAT), Putnam Focused Large Cap Growth (PGRO), VanEck BDC Income ((BIZD), Invesco Building & Construction (PKB), ProShares Nasdaq-100 Dorsey Wright Momentum (QQQA), First Trust Expanded Technology (XPND), PGIM Jennison Focused Growth (PJFG), Defiance Hotel, Airline, and Cruise (CRUZ), Fidelity Disruptive Technology (FDTX), Capital Group Global Growth Equity (CGGO), Motley Fool 100 Index (TMFC), Inspire Fidelis Multi Factor (FDLS), First Trust Multi-Manager Large Growth (MMLG), T. Rowe Price Blue Chip Growth (TCHP), and Alpha Dog ETF (RUFF). All score in the top decile (90-100) of Outlook scores.
As always, I welcome your thoughts on this article! Please email me anytime. Any and all feedback is appreciated! In particular, tell me what sections you find the most valuable—commentary, chart analysis, SectorCast scores, or ETF trading ideas / sector rotation model. Also, please let me know of your interest in a Sabrient index for TAMP or ETF investing…or in the new Sabrient SmartSheets to our full rankings of stocks and ETFs…or in having me speak at your event.
IMPORTANT NOTE: I post this information periodically as a free look inside some of our institutional research and as a source of some trading ideas for your own further investigation. It is not intended to be traded directly as a rules-based strategy in a real money portfolio. I am simply showing what a sector rotation model might suggest if a given portfolio was due for a rebalance, and I do not update the information on a regular schedule or on technical triggers. There are many ways for a client to trade such a strategy, including monthly or quarterly rebalancing, perhaps with interim adjustments to the bullish/neutral/defensive bias when warranted, but not necessarily on the days that I happen to post this article. The enhanced strategy seeks higher returns by employing individual stocks (or stock options) that are also highly ranked, but this introduces greater risks and volatility. I do not track performance of the ideas mentioned here as a managed portfolio.
Disclosure: At the time of this writing, of the securities mentioned, the author held positions in QQQ, TLT, IWM, and NVDA.
Disclaimer: Opinions expressed are the author’s alone and do not necessarily reflect the views of Sabrient. This newsletter is published solely for informational purposes and is not to be construed as advice or a recommendation to specific individuals. Individuals should take into account their personal financial circumstances in acting on any opinions, commentary, rankings, or stock selections provided by Sabrient Systems or its wholly owned subsidiary, Gradient Analytics. Sabrient makes no representations that the techniques used in its rankings or analysis will result in or guarantee profits in trading. Trading involves risk, including possible loss of principal and other losses, and past performance is no indication of future results.