
Scott Martindale


  by Scott Martindale
  CEO, Sabrient Systems LLC
 

Quick note 1: Sabrient’s quarterly Dividend 58 portfolio launched today 11/2 with a diverse mix of 41 stocks across sectors and market caps. It employs a Growth & Income strategy with bond-like yield (current yield upon launch of 3.33%) while seeking capital appreciation from high-quality companies. Also, our Q3 2026 Baker’s Dozen portfolio (13 top growth picks) launched on 10/20. Our Q3 2025 Baker’s Dozen just terminated on 10/20 with a gross total return of +33% vs. +24% for SPY. And our quarterly Small Cap Growth 52 portfolio launched on 9/15, with a mix of 44 small-cap stocks. It followed the launch of Sabrient’s annual Forward Looking Value 14 portfolio on 8/26, having a diverse mix of 31 stocks. Last year’s FLV 13 terminates on 11/17 and is currently up +42% vs. +21% for S&P 500 Value (SPYV) and +19 for S&P 500 (SPY) as of 10/30.

Quick note 2: I was recently a guest on the “Biz Wiz” podcast to tell my humble career story from engineering school to the oil industry to investment research and eventually CEO of Sabrient Systems. Key takeaway from the 30-minute discussion is that an entrepreneurial mindset means adaptability, resilience, focusing on high-potential projects, avoiding rabbit holes, responding to customer needs, creating and scaling value, and advocating for yourself and your ideas. I’d love to hear your impressions!

Overview:

Well, in case you thought you largely missed out on the AI trade, the market has given you another entry point. Sure, the sharp Technology selloff was amplified by technical selling, profit-taking, stop-loss orders, and leveraged algo traders temporarily switching to shorts. But I suspect investor anxiety about the approaching midterm elections also played a role. A potential “blue wave” raises the prospect of renewed efforts to roll back the OBBBA's tax reforms, deregulation, and shrinkage of government, along with greater regulatory scrutiny and possible restrictions on AI development and the construction of datacenters, natural gas pipelines, and nuclear facilities.

Such policies could impede the massive infrastructure buildout underpinning the investment boom, which has become a major driver of corporate capex, earnings growth, and broader economic activity. Combined with growing investor scrutiny of hyperscaler spending and ROI, the prospect of stiff political obstacles to this transformative secular technology and economic cycle may be adding another layer of uncertainty to a market already concerned about whether the massive “all-in” capital spending on the various acronyms AI/SI/ASI/RSI will generate adequate returns to justify it all. Some commentators estimate that it will take $1 trillion in revenue run-rate by end of 2028 to justify the capital commitments, which leaves little room for a slowdown.

Nevertheless, assuming the October selloff was driven more by technicals and macro worries rather than earnings growth, and assuming the president’s veto power can stave off the wolves if the blue wave happens, optimistic investors now enjoy much better equity valuations, not just on the broad market but on many of the technology leaders and cutting-edge innovators. Moreover, the rapid surge in risk-free rates—that have been squeezing valuations by raising both corporate borrowing costs and the discount rate applied to future cash flows—seems to have weathered a “blowoff top” and cycle peak, as I suggested was underway in my 10/6 post. Regardless, most of the leading corporations seem to be tolerating higher interest rates pretty well.

As a reminder, corporate revenue tends to track nominal GDP growth. So, with real US GDP coming in at 3.4% annualized pace for Q3 2026 and the Atlanta Fed GDPNow model estimating Q4 at 3.7% (as of 11/2), it means nominal GDP growth (including the GDP deflator for Q3 of 2.2%) is 5.6-5.9%, supporting strong revenue growth, which is well above today’s 4.9% 10-year yield. This suggests that economic output and tax revenues are expanding faster than long-term borrowing costs, making debt easier to service while keeping financial conditions stimulative.

I hear the argument that rates are merely normalizing back to pre-GFC/ZIRP levels and that this 0.7% growth-to-yield spread in a highly resilient economy will keep upward pressure on interest rates. But this isn’t your father’s economy, and it certainly doesn’t mean today’s economy can readily absorb a “mean reversion” in interest rates. Today’s hyper-financialized, post-GFC/ZIRP global economy had become so accustomed to assuming lots of debt because rates were so low, which means that rising rates could cripple the many vulnerable debt-addicted businesses, governments (including our own massive federal debt), and a housing market (which is critical for a healthy consumer) stubbornly priced for low mortgage rates and low inventory. And most of this debt is either floating-rate or must keep rolling over through refinance.

In addition, 30-year mortgage rates (reaching as high as 7.4% recently) certainly have been even higher in the past. But home prices today are largely based on that lower baseline of post-GFC easing and ultra-low rates. And given recent strengthening of the US dollar, some emerging market economies with dollar-denominated debt may be forced into default.

In other words, outside of the largest corporations with fortress balance sheets, today’s highly indebted global financial system simply can’t handle the current level of interest rates.

Economist and liquidity expert Michael Howell of CrossBorder Capital sees cracks in the veneer of economic strength. He says that while capital markets were traditionally intended to raise new capital for real-world investments, infrastructure, and projects, today the reality is that 70-80% of all global financial transactions are simply rolling over existing debt, effectively turning the global financial system into a massive "refinancing machine."

Furthermore, I do not buy the “persistently elevated inflation” narrative. I believe underlying core inflation is stable and structural disinflationary trends are poised to take control once the energy/supply shocks are resolved. Indeed, I continue to assert that Fed rate hikes are a policy mistake for our bifurcated K-shaped economy (although it is notable that M2 money supply continues to grow at the same decent clip since 2024). We have soaring corporate profits and stock prices juxtaposed with stagnant labor and housing markets, negative real wage growth, a falling personal saving rate, and surging bond credit spreads.

In my comprehensive commentary below, I discuss:

 1. The booming IPO market
 2. Earnings and valuations
 3. Stock valuations and bond yields
 4. Jitters over the AI trade
 5. Surging credit spreads
 6. GDP, industrial production, and productivity
 7. Inflation and the K-shaped economy
 8. What should the Fed take from this?
 9. China’s economy is a growing problem for the world
10. My Final Comments section on the oath of office, crisis in France, and AI fearmongering
11. Sabrient’s sector rankings, positioning of our sector rotation model, and some top-ranked ETF ideas

The combination of high bond yields, surging credit spreads, geopolitical risks, elevated oil prices, ongoing supply shocks, election uncertainty, and jitters about both AI safety and when significant ROI will arrive for the massive AI capex are conspiring to hurt investor confidence and drive down valuation multiples more than recent S&P price action reflects, as overall earnings and guidance continue to march higher. Indeed, a market correction has been underway for months, even though the broad cap-weighted market indexes hasn’t reflected it. While a relatively small group of large stocks kept the S&P 500 near its highs, valuations across much of the market have been declining for months as investors are increasingly rewarding companies with stronger profitability, healthier balance sheets and more dependable earnings while assigning lower valuations to businesses whose prospects are less certain.

The aggregate P/E multiple is down over 20% from its high, and EPS growth is expected to slow substantially next year, albeit from an incredibly (and unsustainably) high level. And credit markets are getting more selective, forcing a quality rotation that includes equities—an internal rotation rather than an abandonment of stocks. So, when I talk about greater market breadth being “healthy” for the market, I’m not talking about equal-weight outperforming cap-weight for an extended period. No, after such periodic periods of cleansing the leverage and speculation, we still need Technology sector leadership, including from Big Tech. But having broader participation across the stock market with more (if not all) “boats” lifted is healthy and desirable for the stock market for many of the same reasons that having broader participation from the lower leg of the K-shaped economy is healthy and desirable for the economy and society.

However, the Fed knows that credit spreads have surged as investors seek either higher quality or greater compensation for elevated risk. But only CCC or worse are in distressed territory. This is yet another sign of the neglected lower-leg of the K-shaped economy being left behind in this AI infrastructure-driven economy, and why I urge the Fed not to hike rates any further—and in fact should cut back toward a 3.0-3.25% fed funds rate (FFR). Look, I understand the argument that today’s rates are simply normalizing to pre-GFC levels. And I am not talking about a return to ZIRP (zero interest rate policy), which created essentially “free money” leading to plenty of malinvestment in unworthy, highly speculative companies, products, and ventures—including non-fungible tokens (NFTs) and special purpose acquisition companies (SPACs).

I just want to see a more broad-based economy (i.e., more boats lifted) in which most if not all industries are participating. Keeping floating-rate debt manageable is a step in that direction. So, I’m thinking that a funds rate of 3.25% at the top end plus an historical average spread of 125 bps for the 10-year Treasury should put 10-year at about 4.5%. This suggests nominal GDP growth (with today’s growth-to-yield spread of 0.7%) of around 5.0-5.2%. With the GDP deflator falling to 2.0%, we would have sustainable real GDP growth at a solid 3.0%.

Overall, I see the US economy as more recession-resistant, more technology-efficient, more services-oriented (meaning less energy-intensive and less at risk of inventory buildup that must be dumped cheaply into the market, like China does), and thus less cyclical. So, a steadier, more predictable economy means structurally higher corporate margins, earnings, cash flow, and capex consistency, which supports higher valuation multiples, lower credit spreads, a subdued VIX, and a buy-the-dip investor mentality. It seems that only a resurgence in bond yields, an AI-related credit crisis, or a harsh political disruption could derail it.

As such, I still think the S&P 500 has a shot at hitting 8,000 by year-end. But it largely depends on the ongoing Q3 earnings reports and forward guidance, which have illuminated some concerns among juggernauts—including Meta (META), Alphabet (GOOGL), and Amazon (AMZN) all spending well beyond their monstrous cash generation on their AI buildouts and pushing each company into deep, historically unprecedented negative free cash flow. Expectations are becoming challenging. As the GMO Asset Allocation team observed, “For the first time in twenty years, with the brief exception of the Global Financial Crisis, we are seeing net dilution in the U.S. stock market (i.e., share issuance exceeding share buybacks) as the hyperscalers continue their capital expenditure spree.”

Moreover, I expect a continuation of the market broadening beyond just the AI trade, and I continue to see opportunities in active stock selection, equal-weight indexes, value stocks, cyclical sectors, small caps, and bond-alternative dividend payers. Indeed, Sabrient’s quant-based, actively selected (“quantamental”), equal-weight Baker’s Dozen, Forward Looking Value, Dividend, and Small Cap Growth portfolios have been largely outperforming their benchmarks—several by substantial margins. And as a reminder, our Earnings Quality Rank (EQR) is licensed as a quality prescreen to the actively managed, low-beta First Trust Long-Short ETF (FTLS), which now holds more than $2.6 billion in AUM.

Lastly, with a highly consequential election upon us, I hope you vote for policies over personalities, and long-term success and prosperity over short-term band-aids. There are those among us who are blissfully ignorant of and unburdened by our ancestors’ centuries of accumulated wisdom, trial and error, what works and what doesn’t, who think they know better how to maximize the potential and wellbeing of both individuals and society as a whole despite the harsh lessons of history and despite many candidates never having managed a successful enterprise themselves, much less a nation. Worse, many voters simply go for “the other guy” if they aren’t happy with their lives today, no matter how impractical the other guy’s proposed solutions. I have more to say about this in my Final Comments section below.

Here is a link to this full post in printable PDF format. As always, I’d love to hear from you! Please feel free to email me your thoughts on this article or if you’d like me to speak on any of these topics at your event.  Read on….

Scott Martindale


  by Scott Martindale
  CEO, Sabrient Systems LLC
 

Quick note 1: Sabrient’s Q3 2026 Baker’s Dozen portfolio (13 top picks) will launch on 10/20. On that day, our Q2 2025 Baker’s Dozen will terminate, and it is up +37.2% gross total return vs. +24.4% for SPY as of 10/2. Also, our quarterly Small Cap Growth 52 portfolio launched on 9/15, with a mix of 44 small-cap stocks across 9 business sectors. SCG 47 terminates on 10/16 and is up +38.9% vs. +22.5% for S&P 600 Small Cap Growth (SLYG) as of 10/2. It followed the launch of Sabrient’s annual Forward Looking Value 14 portfolio on 8/26, having a diverse mix of 31 stocks across 9 business sectors and a large/SMID-cap mix. Last year’s FLV 13 terminates on 11/17 and is up +35.7% vs. +16.3% for S&P 500 Value (SPYV) and +21.2% for S&P 500 (SPY) as of 10/2.

Quick note 2: I was recently a guest on the “Biz Wiz” podcast to tell my humble career story from engineering school to the oil industry to investment research and eventually CEO of Sabrient Systems. Key takeaway from the 30-minute discussion is that an entrepreneurial mindset means adaptability, resilience, focusing on high-potential projects, avoiding rabbit holes, responding to customer needs, creating and scaling value, and advocating for yourself and your ideas. I’d love to hear your impressions!

Overview:

September saw the convergence of several big issues for investors, including: 1) oil price (WTI) and the diesel crack spread both surging above the $100 mark, 2) soaring bond yields and bond volatility (with the 10-year Treasury hitting 5.35%, its highest since 2002, and 30-year mortgages hitting 7.28%), 3) the first Fed rate hike since July 2023, and 4) sudden apocalyptic warnings that unbridled AI could “kill us all by the end of the decade.” And on top of it all, companies and funds with “AI” in their name may to have change it to “SI” (for super intelligence), at least according to our president. The bond market (and the so-called “bond vigilantes”) drove up longer-term rates too rapidly, and so the Fed seems to have decided it had to react to what the market was reflecting—even though jobs and wage growth are stagnant while core inflation is moderating.

Alas, after a one-day pullback, yields surged higher anyway. But I think this is simply a “blowoff top” that will soon put a cap on the 10-year, which suggests to me a buying opportunity for longer duration bonds. Just as the adage about inflation says, “the cure for high prices is high prices,” suggesting a self-correcting loop, similarly the cure for high yields is high yields, meaning that the guaranteed return of bonds becomes increasingly competitive with more-volatile equity returns, attracting demand. I also think oil prices have seen their highs given all the effective workarounds, which should further reduce inflationary pressures and help cap bond yields.

Regardless, I believe the Fed’s hawkishness is a policy mistake given our bifurcated K-shaped economy. We have soaring corporate profits and stock prices juxtaposed with stagnant labor and housing markets, negative real wage growth, a low personal saving rate, and surging high-yield spreads—not to mention softening core inflation and underlying structural disinflationary trends.

In my comprehensive commentary below, I discuss:

1. The sudden AI panic is just the latest in a long lineage of imminent existential doomerism
2. Bureaucrats blunder into the AI fray
3. Stock valuations and bond yields
4. National debt and de-dollarization debate
5. The “debasement trade”
6. Jobs, inflation, and the K-shaped economy
7. My Final Comments essay: Time to vote!
8. Sabrient’s sector rankings, positioning of our sector rotation model, and some top-ranked ETF ideas

The healthy improvement in market breadth we saw for much of the year ended in mid-August, at which time bitcoin surged, the S&P 500 went sideways, the Nasdaq 100 consolidated gains and then surged to new highs, while the equal-weight S&P 500 (RSP), mid-cap S&P 400 (MDY), and small-cap Russell 2000 (IWM) all sold off. And of course, all of September saw a surge in yields—which is correlated with the selloff in all those non-Tech, interest-rate-sensitive stocks.

It seems that the FOMC saw rising yields as a supply problem at its July meeting but a demand problem today. By that I mean a supply-driven rise in yields reflects global supply shocks that raise inflation and weaken economic growth, whereas a demand-driven rise in yields reflects stronger-than-expected economic activity such that markets expect the Fed to keep rates higher-for-longer and thus are demanding more term premium.

The Fed's earlier patience assumed the supply/energy shock would soon fade. But with relentless AI/SI spending driving strong demand, the supply/energy problem became a demand problem in the eyes of the FOMC. And when all you have is a hammer, every problem looks like a nail—thus the rate hike. Fed chair Kevin Warsh said, “Our decision comes at a time when the American economy appears to be strengthening. New hiring, private-sector earnings, business capital investment. Each of these markers has improved in recent months and is pointing in a good direction. Credit flows have been robust, particularly for businesses.”

Indeed, on 9/11, the Fed announced that US national household net worth surged to over $195.9 trillion in Q2 (604% of GDP), primarily driven by capital gains on stocks. Q2 saw the 11th straight quarterly increase and the largest in history at $12.8 trillion—which amazingly exceeds the total annual GDP of every country in the world except the US ($32.4 trillion) and China ($20.8 trillion) as well as the aggregate GDP of the EU ($23.0 trillion, led by Germany’s $5.4 trillion). It’s the 11th consecutive quarterly rise, and the current number is 2x our household wealth since 2020. In addition, the ratio of net worth to disposable personal income (DPI), a measure of households’ potential to finance consumption out of their wealth, reached a record high of 8.3x in Q2.

As for inflation, Trimmed Mean PCE inflation, Core CPI, all the 3-month annualized trends, the 5-year breakeven, and real-time, blockchain-based Truflation all put underlying inflation much closer to (or even below) the Fed’s 2.0% target, as I detail below. Once the energy/supply shock resolves, the structural disinflationary trends should take control once again, e.g., aging demographics, slowing global population growth, accelerating disruptive innovation, automation, rising productivity, and re-globalization of supply chains (“excess productive capacity”).

Last Friday’s disappointing jobs report seemed to trigger an oversold bounce in stocks on the expectation that the Fed will soften. The question is whether this is sustainable or whether it’s just a technical bounce that will be stymied by overhead resistance (aka the proverbial “dead cat bounce”).

Again, I think the Fed made a policy mistake by hiking. The problem is, interest rates impact the whole economy—they can’t be targeted—and monetary policy is clearly restrictive in the most rate-sensitive industries and demographics (despite what Warsh states in his official comments about the broader economy). And even if they could be targeted, the upper leg of the K-shaped economy is largely rate-insensitive, including 1) cash-rich hyperscalers and other equity-capitalized Tech companies that are driving record earnings growth in a powerful secular growth story, and 2) Baby Boomers who are now freely spending their wealth in retirement without taking on debt. But the struggling lower leg of the K (small businesses and lower-income and working-class consumers) is highly rate-sensitive, and yet it is being given the same bad medicine as the robust upper leg. Moreover, it’s bad for government borrowing, further raising out-of-control interest expense, with a massive debt maturity wall coming due for rollover.

Regardless, I expect to see—through the end of this decade and likely beyond—smaller government and less low-ROI government spending in favor of more high-ROI capital allocation from an unleashed private sector as the primary engine of organic economic growth through fiscal support like favorable tax policy, deregulation, and other supply-side incentives for reshoring/onshoring to increase productive capacity. And for now, global liquidity remains abundant, continuing to hit new highs.

As such, I still think the S&P 500 will reach 8,000 by year end. Of course, it largely depends on the upcoming Q3 earnings reports and forward guidance, which have been beyond stellar so far this year, but expectations are becoming challenging. We got the September pullback I expected, with the S&P 500 successfully testing support at its 50-day moving average. However, as the GMO Asset Allocation team observed, “For the first time in twenty years, with the brief exception of the Global Financial Crisis, we are seeing net dilution in the U.S. stock market (i.e., share issuance exceeding share buybacks) as the hyperscalers continue their capital expenditure spree.”

But assuming core inflation metrics continue to moderate and the Fed comes to its senses on tightening, I expect a resumption in the healthy market broadening beyond the AI trade, and I continue to see opportunities in active stock selection, equal-weight indexes, value stocks, cyclical sectors, small caps, and bond-alternative dividend payers.

Indeed, Sabrient’s quant-based, actively selected (“quantamental”), equal-weight Baker’s Dozen, Forward Looking Value, Dividend, and Small Cap Growth portfolios have been largely outperforming their benchmarks—several by substantial margins. And as a reminder, our Earnings Quality Rank (EQR) is licensed as a quality prescreen to the actively managed, low-beta First Trust Long-Short ETF (FTLS), which now holds more than $2.6 billion in AUM.

Sabrient employs a wide variety of fundamental financial factors in our quantitative multifactor models and portfolio selection process. Sabrient Scorecards for Stocks and ETFs are investor tools that provide access to several of our proprietary models for portfolio monitoring and for idea generation for four key investing styles—Growth, Value, Dividend, and Small Cap Growth. To learn more, visit this link: https://www.moonrockstopowerstocks.com/scorecard.

Here is a link to this full post in printable PDF format. As always, I’d love to hear from you! Please feel free to email me your thoughts on this article or if you’d like me to speak on any of these topics at your event.  Read on….
Scott Martindale


  by Scott Martindale
  CEO, Sabrient Systems LLC


Quick note: Sabrient’s new Q3 2026 Baker’s Dozen Portfolio will launch on Monday 7/20 as a 15-month portfolio with a mid-cap bias and a diverse group of 13 stocks across 8 business sectors, including several under-the-radar names. Notably, the next-to-terminate Q2 2025 Baker’s Dozen shows a gross total return of +54.7% from its inception date of 4/17/25 through 7/10/26, vs. +45.6% for SPY. Until 7/17, the Q2 2026 portfolio remains in primary market for new investment. Its top performers so far are Seagate Technologies (STX), Roku (ROKU), and AbbVie (ABBV).

Overview

During Q2 2026, the S&P 500 and Nasdaq Composite indexes posted their best quarter since the pandemic recovery in 2020, rising +14.9% and +21.4%, respectively, driven by AI-related chip stocks, as the resilient bull market powers on. And encouragingly, market breadth expanded nicely as the Russell 2000 small cap index was up +21.4% (following a flat +0.9% Q1), giving it its best H1 since 1991 (+22.6%) as investors sought to broaden their exposure into growing companies poised to benefit from the One Big Beautiful Bill Act’s (OBBBA) tax policies, deregulation, and incentives.

After ChatGPT arrived in November 2022, the market was all about AI-dominant Big Tech, creating hyperscale, and spending unprecedented capex (consuming all the hyperscalers’ massive cash flow, plus some new debt) that drove a 150% gain in the Nasdaq over the ensuing 3.5+ years (annualizing around 30%/yr). But so far this year, the “S&P 493” have vastly outperformed the MAG7 (which peaked on 5/14 and then sold off 15% by 6/26 before bouncing), and investors have invited small caps—and other “trickle down” industries benefiting from massive AI capex—to join the party, despite the event-driven oil price shock, inflation spike, and rising Treasury yields. But Treasury yields are likely being driven more by the hawkish Fed talk than from concerns about structural inflation, and although the coast isn’t entirely clear of macro hurdles, it would be highly unusual for this broadening advance to spell the end of the bull market.

In my full commentary below, I discuss:

1. The trend in consumer sentiment vs. stock prices
2. AI capex and power demand
3. Fundamental tailwinds and the impact on China
4. The “SaaSpocalyse” and what happens next
5. Global liquidity concerns
6. Status and outlook for GDP, inflation, jobs, and productivity
7. My final comments section on stanching the insidious rise of socialism in this country
8. Sabrient’s sector rankings, positioning of our sector rotation model, and some top-ranked ETF ideas

Investor preferences even within Big Tech are definitely rotating. Suddenly, Apple (AAPL) has caught up with Alphabet (GOOGL) as the top performing MAG7 stocks YTD. Apple is expanding its relationship with Broadcom (AVGO) in a $30 billion chipmaking deal to produce more than 15 billion chips in the US, including expansion of Broadcom’s Fort Collins, CO facility. There are now 13 stocks in the $1 trillion market cap club—the MAG7 plus tech sector comrades Taiwan Semi (TSM), Broadcom (AVGO), SpaceX (SPCX), and Micron (MU), along with financial Berkshire Hathaway (BRK-B) and healthcare name Lilly & Co (LLY).

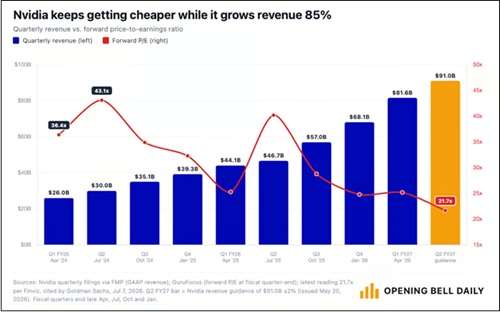
Meanwhile, previous investor darling NVIDIA (NVDA) is now trading at its lowest multiple since 2019. Despite posting an 85% YoY increase in revenue, hitting a whopping $81.6 billion last quarter, share price has been flat such that its forward P/E at around 22x is on par with the broad S&P 500’s composite forward P/E. Compare that to its 5-year average of 72x. The chart below is from Phil Rosen of Opening Bell Daily.

NVIDIA growth trend

After pulling back nearly 20% from its all-time high on 5/14, NVIDIA has recovered some ground and is up about +13% YTD, but rival Advanced Micro (AMD) is up +160% and Intel (INTC) is up +200% over the same timeframe, with forward P/Es around 75x and 125x, respectively. More broadly, according to Morgan Stanley, the P/E premium for the MAG7 versus the other S&P 493 has compressed from above 30% to roughly 10%. I suppose investors don’t see how it can continue to achieve such amazing growth and huge margins, which are attracting more competition in the space. Regardless, analysts continue to raise estimates, and NVIDIA should remain a growth juggernaut for the foreseeable future—particularly with hyperscaler capex (much of which buys NVIDIA products) projected to reach $1 trillion in 2027.

Incredibly, although NVIDIA lost around $1 trillion in market cap during its May-June correction, it is now back above $5 trillion in market cap and is the world’s largest company—on par with Germany’s entire nominal GDP, which is the third-largest economy in the world behind the US and China. NVIDIA represents about 8.5% of the S&P 500 index market cap, and it is larger than: 1) the entire Russell 2000 small cap index ($3.5 trillion), 2) 6 of the world’s top 10 stock exchanges (including UK, France, Italy, India, and Spain); 3) 6 of the 11 sectors of the S&P 500 individually; and 4) the combined market cap of the S&P 500’s Materials, Real Estate, and Utilities sectors.

Broadening beyond the market’s biggest stocks is well in motion. Both the Russell 2000 small cap index (+20% YTD) and the Dow Jones Transportation Average (+18% YTD) have had their best start to a year since 1991. Financials, Healthcare, and Industrials all displayed outperformance versus the broad S&P 500 during June. Corporate profitability has been solid across industries, reflecting resilient demand, disciplined cost management, technological innovation, and sustainable productivity gains—not to mention the trillions of dollars in capex for the gradual onshoring/reshoring of manufacturing, much of it already underway. Net corporate income now accounts for 12.4% of GDP.

As I write about regularly, the outlook for inflation continues to improve, particularly given the many underlying global disinflationary trends. This week brings the June CPI/PPI numbers, which I expect will be lower—although the resumption this month in hostilities in Iran and the resultant jump in oil and gasoline prices might signal some inflationary pressures for the July metrics and cause investors (and the Fed) to hold off on any celebration. Notably, seven OPEC+ countries (Saudi Arabia, Russia, Iraq, Kuwait, Kazakhstan, Algeria, and Oman) agreed to increase oil production by a combined 188,000 barrels per day starting in August. But beyond that announcement, supply chains have rapidly diversified in response to the Strait of Hormuz bottleneck—and what the International Energy Agency (IEA) has called “the largest supply disruption in history”—such that it is no longer strangling the global economy, as I discussed in my April post. Indeed, this was long overdue as Iran has not been a reliable observer of the “right of transit passage” in narrow international straits under the UN Convention on the Law of the Sea (UNCLOS) in 47 years.

In my full commentary below, I discuss the divergence between poor consumer sentiment versus strong advisor sentiment and a rising stock market, as well as the shift in focus from both the federal government and institutional investors into hard assets and infrastructure. Moreover, through the end of this decade and likely beyond, I expect to see smaller government and less low-ROI government spending in favor of more high-ROI capital allocation from an unleashed private sector as the primary engine of organic economic growth through fiscal support like favorable tax policy, deregulation, and other supply-side incentives for reshoring/onshoring to increase productive capacity.

This should lead to strong real GDP growth, a peace dividend, rising productivity and a resumption in other disinflationary trends that bring back inflation under 2.5%, and a new “hands-off” Federal Reserve under new chairman Kevin Warsh that aims for less market intervention and does not fear that robust economic growth (aka “overheated” or “above trend”) fuels inflation. Instead, Warsh believes as I do that inflation in general is driven by excessive monetary expansion and deficit spending (including massive spending bills, “helicopter money,” and QE), rather than by a strong and productive private economy.

As such, I still think the S&P 500 might hit 8,000 by year end, although I also think gold, silver, copper, and bitcoin remain long-term accumulation plays, even though they might see further near-term headwinds (e.g., war, a hawkish Fed, and a strong dollar). Given the market broadening beyond the Big Tech titans, and assuming the Fed does not become overly hawkish, we continue to see opportunities in active stock selection, small caps, and bond-alternative dividend payers.

Indeed, Sabrient’s Baker’s Dozen, Forward Looking Value, Small Cap Growth, and Dividend portfolios have been largely outperforming their benchmarks. Our latest Q2 2026 Baker’s Dozen Portfolio launched on 4/17 as a 15-month portfolio with a mid-cap bias and a diverse group of 13 stocks across eight business sectors. It remains in primary market until Friday 7/17, and then the new Q3 2026 Baker’s Dozen launches on Monday 7/20. And, as a reminder, our Earnings Quality Rank (EQR) is licensed as a quality prescreen to the actively managed, low-beta First Trust Long-Short ETF (FTLS), which now has over $2.4 billion in AUM.

Sabrient employs a variety of fundamental financial factors in our quantitative models and portfolio selection process. Sabrient Scorecards for Stocks and ETFs are investor tools that provide access to several of our proprietary models for idea generation and portfolio monitoring. To learn more, I invite you to visit https://MoonRocksToPowerStocks.com where you can download founder David Brown’s latest book (an Amazon international bestseller) and 2 bonus reports (on investing in the Future of Energy and Space Exploration)—all in PDF format—and start subscribing to the Scorecards, which make David’s process easy for idea generation and portfolio monitoring. They include our Top 30 stocks each week for 4 distinct investing strategies—Growth, Value, Dividend, and Small Cap. To go straight to the Scorecard subscription, go to: https://www.moonrockstopowerstocks.com/sabrient-scorecard

Here is a link to this post in printable PDF format. As always, I’d love to hear from you! Please feel free to email me your thoughts on this article or if you’d like me to speak on any of these topics at your event!  Read on….