by Scott Martindale
CEO, Sabrient Systems LLC
Quick note: Sabrient’s new Small Cap Growth 52 Portfolio just launched on 6/17 as a 15-month portfolio holding 43 stocks across a range of sectors. It offers an alpha-seeking alternative to the broad small-cap indexes. Notably SCG 46 is the next to terminate on 7/22, and it currently shows a gross total return of +81% vs. +48% for its benchmark S&P SmallCap 600 Growth (SLYG), as well as 61% for Russell 2000 Small Caps (IWM), and +43% for S&P 500 (SPY), as of 6/22.
Overview
The resilient bull market continues to be powered by a compelling combination of technological innovation, robust corporate earnings, resilient consumer spending (despite energy and supply-driven inflationary pressures), and investor optimism around productivity-driven economic growth, despite ongoing macro uncertainties (there’s always something). Notably, the April rally off the market correction was broad-based, then May saw a marked narrowing with Tech the clear leader while most other sectors struggling (as bond yields surged, which hurts interest-rate sensitive industries), and now June has the market resuming its broadening efforts, as evidenced by price action (including a new high for the Russell 2000 small caps) and a convergence in forward P/E multiples (e.g., cap-weight S&P 500 falling, equal-weight S&P 500 and Russell 2000 small caps rising).
In my full commentary below, I discuss:
1. Relative valuations and the SpaceX-led parade of mega-IPOs on tap
2. GDP, inflation, jobs, and productivity
3. Fed policy in the new Kevin Warsh chairmanship
4. AI backlash, the realities, and how to address it
5. Datacenter power demand and the NIMBY problem
6. My final comments section on government versus private sector capital allocation and ROI
7. Sabrient’s sector rankings, positioning of our sector rotation model, and some top-ranked ETF ideas
As I discussed in my May post, valuations in the broad market indexes have been falling even as the market has surged, as earnings surged at an even faster rate. The equal-weight indexes have outperformed their cap-weight brethren, most notably in the Tech sector, with the MAG-7 badly underperforming the aggregate of everyone else in the sector. Who are the new leaders? Those benefiting from all the hyperscalers’ capex, including names like Sandisk (SNDK), Western Digital (WDC), Seagate Technology (STX), Micron (MU), Broadcom (AVGO), Dell (DELL), Vertiv (VRT), Quanta Services (PWR), EMCOR (EME), Arista Networks (ANET), Bloom Energy (BE), Comfort Systems (FIX), and Sterling Infrastructure (STRL)—many of which have been holdings in Sabrient’s quarterly Baker’s Dozen portfolios.
With the splashy IPO debut of Elon Musk’s SpaceX (SPCX), there are now 12 companies in the $1 trillion market cap club as of 6/19 [including lone non-Tech name Berkshire Hathaway (BRK-B]. And given the rest of the mega-IPO lineup expected this year, some commentators are suggesting a new Big Tech-leadership acronym, such as “MANGOS”—Meta, Anthropic, NVIDIA, Google, OpenAI, and SpaceX. Or the “AI Big 10” that adds Micron, AMD, and Broadcom to the existing MAG-7.
Many of the main headwinds of H1 seem to be finding resolution. The Iran conflict is apparently winding down, and oil price has tumbled from around $105/bbl at its May peak to below $75/bbl (front-month futures contract for WTI on NYMEX), which soon will be reflected in inflation metrics. Consumer spending and retail sales have held up despite falling real wage growth, and now the extremely poor consumer and investor sentiment metrics are showing nascent signs of improvement—although still far from the euphoria or “irrational exuberance” of the dot-com era. Also, the huge SpaceX IPO hit the market without any notable damage.
Overall, I still think fundamental tailwinds outweigh headwinds as investors position for continued AI progress, robust capex for AI, reshoring, and re-industrialization, looser Fed monetary policy, resurgence in global liquidity growth, and One Big Beautifull Bill Act (OBBBA) policies fully kicking in with its pro-growth policies like tax reform, deregulation, smaller government, pro-energy protocols, and broad support for the private sector to retake its rightful place as the primary engine of growth via re-privatization, reshoring, and re-industrialization, with much more efficient capital allocation and ROI than government.
Furthermore, this should continue to attract foreign capital into the US (“shadow liquidity,” much of which is not counted in M2), cut the debt and deficit-to-GDP ratio, and unleash organic private sector growth. Today’s valuations are reasonable, particularly given rising corporate earnings forecasts (now at +23% YoY for CY2026), but future stock valuations likely will be driven more by rising earnings and ROI than by AI hope-driven multiple expansion, particularly given the lingering macro uncertainties and the risk of higher interest rates.
In addition, aside from the oil and supply-driven disruptions that have temporarily goosed inflation metrics, many disinflationary trends are still in place, including the secular implementation of AI and automation, rising productivity, falling shelter costs, the deflationary impulse from a struggling China, a stable/rising dollar (up nearly 5% YTD), and slow M2 growth (about 4.7% vs. last year and 3.5% annualized over the past 3 years, vs. 6.0% pre-pandemic average since 1960). So, as supply chains are repaired and rerouted (as I discussed in my April post) and as oil prices and inflation recede, we could see some multiple expansion—to perhaps as high as 24x on the S&P 500 (after the recent contraction to below 22x on a next-12-months basis)—which would further support stocks. Indeed, the market seems to be setting up the next up leg. Every dip has been a buying opportunity. According to InvesTech Research, “Margin Debt as a percentage of nominal GDP shot up 9% in May, reaching a new all-time high.”
Q1 earnings reporting season was stellar, with robust YoY earnings growth, margins, and productivity, plus rising forward guidance and analyst earnings forecasts. Blended EPS growth across sectors was up 28% in Q1, led by Tech sector at 54%. Revenue growth was 11%, led by Tech at 16%. Profit margins were 15%, led by Tech at 29%. But because EPS growth has exceeded price performance, the P/E multiple has shrunk. The S&P 500 started the year at 6,845 and closed last week at 7,500. The latest Wall Street consensus for S&P 500 operating EPS is about $339 for 2026 (implied P/E of 22.1x based on $7,500 price) and $392 for 2027 (forward P/E of 19.1x on current price). Both are roughly 10% higher than at the start of the year. An official resolution to the Iran conflict and supply shock could allow for some multiple expansion, perhaps pushing the forward P/E to 24x—which implies the S&P 500 Index hitting 8,000 by year-end 2026 and potentially 9,300 by year-end 2027. Are these realistic targets? Not out of the question, in my view, although bouts of volatility along the way surely should be expected—perhaps severe pullbacks as price stretches from moving averages (like a rubberband).
As the S&P 500’s concentration in Big Tech has grown, its dividend yield has compressed to below 1.0%—reminiscent of the late-1990s and well below its multi-decade average around 1.7%—mainly because those high-growth Big Tech companies that dominate the cap-weight index don’t need to pay dividends to attract investors. Instead, investors are willing to pay up for strong growth and high margins, increasingly discounting a world in which AI becomes deeply embedded in business operations in a long-term secular investment cycle rather than short-term cyclical trend. And this is in spite of the elevated benchmark 10-year Treasury yield around 4.5%, which normally would suppress valuation multiples (on a discounted cash flow basis). Although Big Tech is largely immune to interest rate volatility, the smaller companies—into which the market is seeking to broaden—are not.
Furthermore, many uncertainties remain. Investors are concerned about the worrisome inflation prints, Fed policy under the new chairmanship, and the concise-but-vague MOU with Iran. Moreover, the long stretch of years in which demand for US stocks has far outstripped supply (“scarcity”) seems to be suddenly reversing. The line-up of mega-IPOs this year, pre-IPO shares coming out of lock-up, and Big Tech’s shift from using its massive cash flow for share buybacks to supplementing cash with new share issuances to instead fund historic levels of AI-related capex for datacenters, advanced compute hardware (chips, memory, servers), networking, and power infrastructure. According to Michael Gayed, the four largest hyperscalers (Meta, Alphabet, Microsoft, Amazon) spent $416 billion on capex in 2025 and have projected 2026 capex of $725 billion.
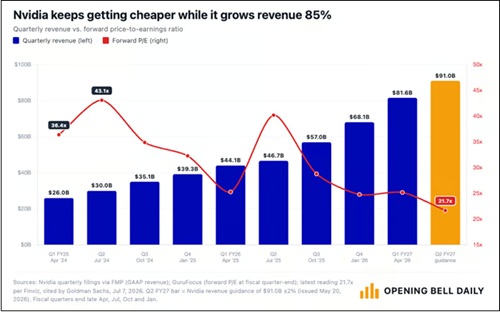
Concurrently, there is concern about Big Tech earnings quality and circular financing (e.g., NVIDIA investing in its customers who in turn buy NVIDIA’s GPUs), not to mention speculation on how soon all this massive AI spend will pay off (i.e., ROI) and what happens if and when the capex firehose dials down or shuts off. However, as the engraving in every convex passenger-side car mirror reminds us, “Objects in the mirror may be closer than they appear,” which certainly seems to be the case with AI as fundamentals are evolving much faster and impacting workflows much sooner than most anyone expected.
As for the Fed’s increasingly hawkish stance and rising odds of a rate hike (like the ECB just instituted), my view is that a hike won’t reduce the oil or food prices that are driving up the inflation metrics unless it induces an economic recession, which is not what the Fed or anyone wants to see. Assuming the Iran conflict is indeed coming to an end, inflation and interest rates likely have topped, with disinflationary structural trends resuming control and bonds catching a bid.
I remain of the belief that interest rate-sensitive segments of the economy, including housing, homebuyers, small businesses, and lower-income consumers, are already struggling with current financing and mortgage rates, offset only by the locked-in low interest rates from 2020-21, in a K-shaped economy, with higher income people doing well and spending, while lower income is being squeezed. For instance, higher income households have not reduced their driving habits at all, while most others have, and teenagers are having a hard time finding summer jobs due to all the older workers who have re-entered the workplace to supplement their retirement income. Moreover, the still-solid GDP growth metrics have been overly reliant on the combination of the AI race and its massive infrastructure spending, financed mostly on Big Tech cash flow than debt, plus unsustainable levels of fiscal deficit spending—i.e., around $1.9 trillion or 5.8% federal deficit-to-GDP, which includes $1 trillion in interest payments on 100% publicly held federal debt-to-GDP (and 123% total debt-to-GDP).
Notably, if you look solely at the primary deficit (excluding interest on debt), the ratio to GDP is 2.6% (20.1% spending minus 17.5% total revenue), which exceeds the 50-year historical average of 1.7% primary deficit-to-GDP ratio. If any of this spending slows, recessionary conditions might follow. In other words, we need all segments of the economy to flourish, and that can be supported by lower rates. And by the way, elevated inflation helps “inflate away” the debt as long as growth in real (after-inflation) GDP is positive (preferably strongly positive, like 2.5% or more) and exceeds growth in deficit spending, and interest rates remain contained (including any financial repression or yield curve control).
Having a hyper-financialized global economy means that rising rates could cripple debt-addicted businesses, governments (including our own federal government), and the housing market (which is critical for a healthy consumer). Sure, mortgage rates have been much higher in the past, but home prices today are based on a lower baseline of post-GFC easing and low rates. And given recent strengthening of the dollar, some emerging market economies with dollar-denominated debt may be forced into default. In other words, today’s global financial system simply can’t handle higher US interest rates.
Given the market broadening beyond the Big Tech titans, and assuming the Fed does not become overly hawkish, we continue to see opportunities in active stock selection, small caps, and bond-alternative dividend payers. Indeed, Sabrient’s Baker’s Dozen, Forward Looking Value, Small Cap Growth, and Dividend portfolios have been largely outperforming their benchmarks. Our latest Q2 2026 Baker’s Dozen Portfolio launched on 4/17 as a 15-month portfolio with a mid-cap bias and a diverse group of 13 stocks across eight business sectors. After two months, it is already off to a good start, up +9.5% vs. +5.1% for SPY and +3.6% for equal-weight S&P 500 (RSP), as of 6/22. Notably, last year’s Q1 2025 Baker’s Dozen terminated on 4/20 with a gross total return of +46.7% vs. +20.3% for SPY, and the next-to-terminate Q2 2025 portfolio is up +61% vs. +43% for SPY and +32% for RSP. And, as a reminder, our Earnings Quality Rank (EQR) is licensed to the actively managed, low-beta First Trust Long-Short ETF (FTLS) as a quality prescreen. FTLS now has $2.4 billion in AUM.
Sabrient employs a variety of fundamental financial factors in our quantitative models and portfolio selection process. Sabrient Scorecards for Stocks and ETFs are investor tools that provide access to several of our proprietary models for idea generation and portfolio monitoring. To learn more, I invite you to visit https://MoonRocksToPowerStocks.com where you can download founder David Brown’s latest book (an Amazon international bestseller) and 2 bonus reports (on investing in the Future of Energy and Space Exploration)—all in PDF format—and start subscribing to the Scorecards, which make David’s process easy for idea generation and portfolio monitoring. They include our Top 30 stocks each week for 4 distinct investing strategies—Growth, Value, Dividend, and Small Cap. To go straight to the Scorecard subscription, go to: https://www.moonrockstopowerstocks.com/sabrient-scorecard
Here is a link to the post in printable PDF format. As always, I’d love to hear from you! Please feel free to email me your thoughts on this article or if you’d like me to speak on any of these topics at your event! Click here to continue reading my full commentary....