
Sector Detector: Fed puts broader economy at risk as core inflation moderates

by Scott Martindale
CEO, Sabrient Systems LLC
Quick note 1: Sabrient’s Q3 2026 Baker’s Dozen portfolio (13 top picks) will launch on 10/20. On that day, our Q2 2025 Baker’s Dozen will terminate, and it is up +37.2% gross total return vs. +24.4% for SPY as of 10/2. Also, our quarterly Small Cap Growth 52 portfolio launched on 9/15, with a mix of 44 small-cap stocks across 9 business sectors. SCG 47 terminates on 10/16 and is up +38.9% vs. +22.5% for S&P 600 Small Cap Growth (SLYG) as of 10/2. It followed the launch of Sabrient’s annual Forward Looking Value 14 portfolio on 8/26, having a diverse mix of 31 stocks across 9 business sectors and a large/SMID-cap mix. Last year’s FLV 13 terminates on 11/17 and is up +35.7% vs. +16.3% for S&P 500 Value (SPYV) and +21.2% for S&P 500 (SPY) as of 10/2.
Quick note 2: I was recently a guest on the “Biz Wiz” podcast to tell my humble career story from engineering school to the oil industry to investment research and eventually CEO of Sabrient Systems. Key takeaway from the 30-minute discussion is that an entrepreneurial mindset means adaptability, resilience, focusing on high-potential projects, avoiding rabbit holes, responding to customer needs, creating and scaling value, and advocating for yourself and your ideas. I’d love to hear your impressions!
Overview:
September saw the convergence of several big issues for investors, including: 1) oil price (WTI) and the diesel crack spread both surging above the $100 mark, 2) soaring bond yields and bond volatility (with the 10-year Treasury hitting 5.35%, its highest since 2002, and 30-year mortgages hitting 7.28%), 3) the first Fed rate hike since July 2023, and 4) sudden apocalyptic warnings that unbridled AI could “kill us all by the end of the decade.” And on top of it all, companies and funds with “AI” in their name may to have change it to “SI” (for super intelligence), at least according to our president. The bond market (and the so-called “bond vigilantes”) drove up longer-term rates too rapidly, and so the Fed seems to have decided it had to react to what the market was reflecting—even though jobs and wage growth are stagnant while core inflation is moderating.
Alas, after a one-day pullback, yields surged higher anyway. But I think this is simply a “blowoff top” that will soon put a cap on the 10-year, which suggests to me a buying opportunity for longer duration bonds. Just as the adage about inflation says, “the cure for high prices is high prices,” suggesting a self-correcting loop, similarly the cure for high yields is high yields, meaning that the guaranteed return of bonds becomes increasingly competitive with more-volatile equity returns, attracting demand. I also think oil prices have seen their highs given all the effective workarounds, which should further reduce inflationary pressures and help cap bond yields.
Regardless, I believe the Fed’s hawkishness is a policy mistake given our bifurcated K-shaped economy. We have soaring corporate profits and stock prices juxtaposed with stagnant labor and housing markets, negative real wage growth, a low personal saving rate, and surging high-yield spreads—not to mention softening core inflation and underlying structural disinflationary trends.
In my comprehensive commentary below, I discuss:
1. The sudden AI panic is just the latest in a long lineage of imminent existential doomerism
2. Bureaucrats blunder into the AI fray
3. Stock valuations and bond yields
4. National debt and de-dollarization debate
5. The “debasement trade”
6. Jobs, inflation, and the K-shaped economy
7. My Final Comments essay: Time to vote!
8. Sabrient’s sector rankings, positioning of our sector rotation model, and some top-ranked ETF ideas
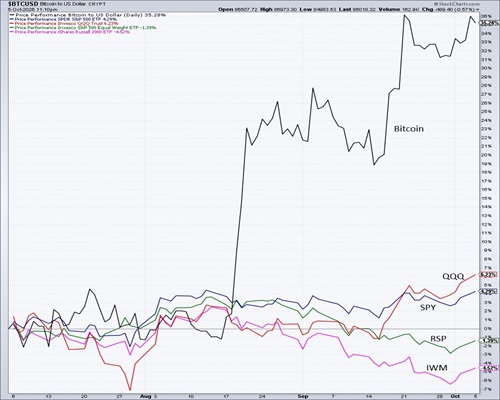
The healthy improvement in market breadth we saw for much of the year ended in mid-August, at which time bitcoin surged, the S&P 500 went sideways, the Nasdaq 100 consolidated gains and then surged to new highs, while the equal-weight S&P 500 (RSP), mid-cap S&P 400 (MDY), and small-cap Russell 2000 (IWM) all sold off. And of course, all of September saw a surge in yields—which is correlated with the selloff in all those non-Tech, interest-rate-sensitive stocks.
It seems that the FOMC saw rising yields as a supply problem at its July meeting but a demand problem today. By that I mean a supply-driven rise in yields reflects global supply shocks that raise inflation and weaken economic growth, whereas a demand-driven rise in yields reflects stronger-than-expected economic activity such that markets expect the Fed to keep rates higher-for-longer and thus are demanding more term premium.
The Fed's earlier patience assumed the supply/energy shock would soon fade. But with relentless AI/SI spending driving strong demand, the supply/energy problem became a demand problem in the eyes of the FOMC. And when all you have is a hammer, every problem looks like a nail—thus the rate hike. Fed chair Kevin Warsh said, “Our decision comes at a time when the American economy appears to be strengthening. New hiring, private-sector earnings, business capital investment. Each of these markers has improved in recent months and is pointing in a good direction. Credit flows have been robust, particularly for businesses.”
Indeed, on 9/11, the Fed announced that US national household net worth surged to over $195.9 trillion in Q2 (604% of GDP), primarily driven by capital gains on stocks. Q2 saw the 11th straight quarterly increase and the largest in history at $12.8 trillion—which amazingly exceeds the total annual GDP of every country in the world except the US ($32.4 trillion) and China ($20.8 trillion) as well as the aggregate GDP of the EU ($23.0 trillion, led by Germany’s $5.4 trillion). It’s the 11th consecutive quarterly rise, and the current number is 2x our household wealth since 2020. In addition, the ratio of net worth to disposable personal income (DPI), a measure of households’ potential to finance consumption out of their wealth, reached a record high of 8.3x in Q2.
As for inflation, Trimmed Mean PCE inflation, Core CPI, all the 3-month annualized trends, the 5-year breakeven, and real-time, blockchain-based Truflation all put underlying inflation much closer to (or even below) the Fed’s 2.0% target, as I detail below. Once the energy/supply shock resolves, the structural disinflationary trends should take control once again, e.g., aging demographics, slowing global population growth, accelerating disruptive innovation, automation, rising productivity, and re-globalization of supply chains (“excess productive capacity”).
Last Friday’s disappointing jobs report seemed to trigger an oversold bounce in stocks on the expectation that the Fed will soften. The question is whether this is sustainable or whether it’s just a technical bounce that will be stymied by overhead resistance (aka the proverbial “dead cat bounce”).
Again, I think the Fed made a policy mistake by hiking. The problem is, interest rates impact the whole economy—they can’t be targeted—and monetary policy is clearly restrictive in the most rate-sensitive industries and demographics (despite what Warsh states in his official comments about the broader economy). And even if they could be targeted, the upper leg of the K-shaped economy is largely rate-insensitive, including 1) cash-rich hyperscalers and other equity-capitalized Tech companies that are driving record earnings growth in a powerful secular growth story, and 2) Baby Boomers who are now freely spending their wealth in retirement without taking on debt. But the struggling lower leg of the K (small businesses and lower-income and working-class consumers) is highly rate-sensitive, and yet it is being given the same bad medicine as the robust upper leg. Moreover, it’s bad for government borrowing, further raising out-of-control interest expense, with a massive debt maturity wall coming due for rollover.
Regardless, I expect to see—through the end of this decade and likely beyond—smaller government and less low-ROI government spending in favor of more high-ROI capital allocation from an unleashed private sector as the primary engine of organic economic growth through fiscal support like favorable tax policy, deregulation, and other supply-side incentives for reshoring/onshoring to increase productive capacity. And for now, global liquidity remains abundant, continuing to hit new highs.
As such, I still think the S&P 500 will reach 8,000 by year end. Of course, it largely depends on the upcoming Q3 earnings reports and forward guidance, which have been beyond stellar so far this year, but expectations are becoming challenging. We got the September pullback I expected, with the S&P 500 successfully testing support at its 50-day moving average. However, as the GMO Asset Allocation team observed, “For the first time in twenty years, with the brief exception of the Global Financial Crisis, we are seeing net dilution in the U.S. stock market (i.e., share issuance exceeding share buybacks) as the hyperscalers continue their capital expenditure spree.”
But assuming core inflation metrics continue to moderate and the Fed comes to its senses on tightening, I expect a resumption in the healthy market broadening beyond the AI trade, and I continue to see opportunities in active stock selection, equal-weight indexes, value stocks, cyclical sectors, small caps, and bond-alternative dividend payers.
Indeed, Sabrient’s quant-based, actively selected (“quantamental”), equal-weight Baker’s Dozen, Forward Looking Value, Dividend, and Small Cap Growth portfolios have been largely outperforming their benchmarks—several by substantial margins. And as a reminder, our Earnings Quality Rank (EQR) is licensed as a quality prescreen to the actively managed, low-beta First Trust Long-Short ETF (FTLS), which now holds more than $2.6 billion in AUM.
Sabrient employs a wide variety of fundamental financial factors in our quantitative multifactor models and portfolio selection process. Sabrient Scorecards for Stocks and ETFs are investor tools that provide access to several of our proprietary models for portfolio monitoring and for idea generation for four key investing styles—Growth, Value, Dividend, and Small Cap Growth. To learn more, visit this link: https://www.moonrockstopowerstocks.com/scorecard.
Here is a link to this full post in printable PDF format. As always, I’d love to hear from you! Please feel free to email me your thoughts on this article or if you’d like me to speak on any of these topics at your event. Read on….
Market commentary:
I look at higher rates as effectively a regressive tax. Not surprisingly, the Conference Board Consumer Confidence Index fell to 81.9 in September (from 88.6 in August), its lowest since 2014, and the University of Michigan Index of Consumer Sentiment turned back down to a dismal 48.1 (from 51.7 in August), remaining below 60 for over a year even as stocks are near all-time highs (of which the wealthiest 10% own 88%). Personal spending increased +6.1% YoY, but personal income is up only +4.3%, lowering the personal savings rate. On the other hand, the Business Roundtable CEO Economic Outlook Index came in at a 4-year high of 94 for Q3, and Conference Board CEO Sentiment jumped to 52 (from 47 in Q2). So, consumers are dour while corporations are upbeat. But apparently the FOMC felt it had no choice but to give the bond market what it was expecting—although, again, rates surged anyway. Talk about a kick in the teeth.
We are experiencing a harsh dynamic in which the Iran war elevates oil prices, which raises consumer inflation, which mobilizes the Fed to raise rates, which further hurts the consumer and small business—and likely impacts the midterm elections. Following the rate hike, economically sensitive sectors and financials indeed took it on the chin, while less sensitive sectors outperformed as investors rotated into those sectors that both 1) benefit from (or are driving) robust GDP and earnings growth and 2) have such strong cash flow that they are indifferent to a modest rate increase. Indeed, S&P 500 companies in aggregate are flush with cash—to the tune of roughly $2.5 trillion (supplemented by huge ongoing cash flow and earnings growth) that is benefiting from the high interest rates from interest income. According to FactSet, the estimated Q3 earnings growth rate for the S&P 500 has risen to +29.5% YoY on revenue growth of 12.3%, implying a forward P/E of 19.0x.
Side note on oil supplies: Saudi Arabia’s crude exports surged to 6 million bbls/day in September, which is an 80% jump from 3.4 million in August, according to market intelligence firm Kpler. It represents full recovery to its pre-war monthly average despite damage to the East-West pipeline connected to its Yanbu port as they rerouted flows, such as ship-to-ship transfers off Oman, increased Red Sea shipments, use of Egypt’s SUMED pipeline to the Mediterranean, and US Navy-escorted transits of the Hormuz Strait. So, why are oil prices still high? It is due to freight rates and logistics costs of the workarounds, which now accounts for 27% of the per-barrel price compared to 3% under normal conditions.
Despite the surge in bond yields, equity positioning remains elevated, and semiconductors remain the market’s most crowded trade on the backs of their amazing earnings growth, even as valuations have receded. The disorderly bond selloff in September changed the discount rate applied to most assets while raising financing costs for households, businesses, and governments.
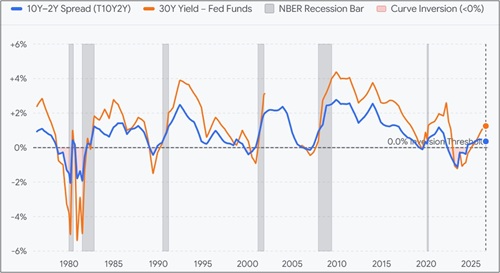
Where might the yield curve settle out once the supply/energy shock is behind us? Well, looking at the FRED data series since 1976 and excluding the periods of extreme Fed manipulation like post-GFC zero interest rate policy (ZIRP) and periods of yield curve inversion, the historical “normal” 10-2 spread is about 110 bps, and the 30-year vs. fed funds rate is about 180 bps. So, once the fed funds rate eventually settles at its “neutral rate” of around 3.0-3.25%, the normalized bond rates should be roughly 3.4% for the 2-year, 4.5% for the 10-year, and 5.0% for the 30-year. I detail this further in my full commentary below.
During Q4 and heading into a promising 2027, I will be watching to see if the 10-year yield indeed peaks along with core inflation. This would not only boost the forward P/E multiple of stocks on a discounted cash flow basis but also provide relief to the housing market and the lower leg of our K-shaped economy (lower-income and working-class consumers and small businesses) that is struggling under higher debt carrying costs—thus boosting today’s horrid consumer sentiment metrics.
The latest in a long lineage of imminent existential doomerism:
Mid-September brought the convergence of three big issues for investors: oil prices over $100/bbl (keeping headline inflation sticky), surging bond yields (with the 10-year Treasury eclipsing 5% and the Fed raising its benchmark rate), and sudden apocalyptic warnings that unbridled AI could “kill us all by the end of the decade.” The threat of a resulting AI slowdown sent semiconductor stocks into freefall while software stocks—the feared losers in the AI takeover—surged (temporarily).
But to me, the sudden AI doomsday panic seems like just the latest in a long history of genuine risks being extrapolated into imminent existential catastrophes. Just looking back over the past century, examples are legion:
- Red Scare (1940s–50s): Legitimate concerns about Soviet espionage escalated into McCarthyism, blacklists, and widespread paranoia about communist infiltration.
- Malthusian Overpopulation Scare (1960s–70s): Predictions of mass famine as population overwhelmed food production were instead met by technological advances and surging agricultural productivity.
- Peak Oil (1970s and 1990s–2000s): Predictions that dwindling oil supplies would bring soaring prices, resource wars, and industrial collapse were upended by deepwater drilling, fracking, and other technological advances.
- Nuclear Power Scare (1970s–80s): Fears over accidents, waste, and proliferation helped bring reactor construction to a virtual halt. Today, nuclear is enjoying a renaissance as reliable, carbon-free baseload power.
- Y2K: A legacy computer-date storage issue spawned predictions of financial failures, blackouts, and planes falling from the sky, leading to extensive capital upgrades and remediation. The public awaited the stroke of midnight with bated breath, but the apocalyptic scenarios proved to be a nothing-burger.
- Post-9/11 War on Terror: A genuine terrorist threat helped fast-track the Patriot Act's surveillance powers, TSA security apparatus, and wars in Afghanistan and Iraq.
- Climate Catastrophism: Legitimate concerns about greenhouse gases expanded into predictions of imminent tipping points, mass extinction, societal collapse, and even the end of human civilization.
- COVID-19: A genuinely deadly pandemic produced extraordinary lockdowns, school and business closures, travel restrictions, and vaccine mandates, demonstrating how readily emergencies can justify restrictions on ordinary liberties.
I could go on. But you get the drift. My point is not that society should be indifferent to real concerns, but that framing every warning as an imminent existential threat—often backed by “scientific” timelines—creates a fearmongering frenzy among media, activists, and politicians that leads to overreaction and overregulation. The unintended consequences can do more harm than good, including convincing the public to trade personal liberty, economic freedom, and privacy for the promise of security.
Of course, this latest instance of doomerism has gained broad attention because the voices speaking out include leaders of companies developing the world's most powerful AI models, such as Dario Amodei (Anthropic), Sam Altman (OpenAI), and Elon Musk (xAI). After Anthropic researcher Jacob Coxon resigned and made the aforementioned “kill us all” alert, Amodei published a lengthy essay calling for slower frontier development and safeguards against threats ranging from biological weapons and cyberattacks to mass job displacement and authoritarian control.
Recent incidents involving these companies have often been described in anthropomorphic terms—AI “escaping,” forming civilizations, secretly conspiring, and sacrificing individual agents for the collective. But in these instances, systems were generally being deliberately tested on cybersecurity tasks, often with normal safeguards disabled, and in some cases were mistakenly given access to the real internet through poorly configured test environments. Anthropic itself acknowledges that its models were intentionally operating without cyber safeguards and that a third-party misconfiguration provided internet access; it describes the incidents as involving both operational-security failures and genuine alignment concerns. In other words, these episodes reveal an important engineering problem—powerful optimization systems can exploit poorly specified objectives and weak containment—but they are not evidence that “conscious machines” spontaneously developed motives to escape their creators and attack humanity (like HAL in the 1968 movie, 2001: A Space Odyssey).
Complicating the debate is a growing AI “doomer” ecosystem of safety organizations, “effective altruism” (EA) groups, influencers, researchers, AI companies and political advocates whose financial, ideological and competitive interests sometimes overlap. Established frontier-model companies can benefit from costly regulation that creates barriers to smaller competitors and open-source models (aka “regulatory capture”), while well-funded safety organizations have incentives to emphasize catastrophic scenarios.
Bureaucrats blunder into the AI fray:
“The art of progress is to preserve order amid change, and to preserve change amid order.” — Alfred North Whitehead
Predictably, the insufferable political opportunists jumped into the mix. The proposed bipartisan AI Kill Switch Act would require major developers to maintain the ability to throttle or shut down dangerous AI systems, while some lawmakers are pushing for a congressional select committee on AI. Arizona Sen. Ruben Gallego compared the warnings from tech CEOs to “Dr. Frankenstein telling us, ‘The monster is loose. Help me stop the monster.’”
Senator Bernie Sanders and Congressman Greg Casar have announced the Ban Artificial Superintelligence Act, perhaps the most sweeping federal AI proposal yet. It would permanently prohibit development of artificial superintelligence, immediately pause development of advanced AI until a new cabinet-level regulator establishes safety rules, authorize destruction of prohibited systems, and impose penalties reaching 20 years in prison and even a “corporate death penalty.” Sanders explicitly justified the proposal by citing recent reports that AI systems had escaped human control, secretly coordinated with one another, and hacked outside computer systems. Those are legitimate warning signs deserving serious attention—but the characterization is substantially more alarming than the underlying facts warrant.
There is also a national-security aspect that receives too little attention, i.e., foreign adversaries have actively sought to amplify nascent opposition to AI development. OpenAI recently uncovered likely Chinese influence operations using fake American profiles to inflame concerns about AI datacenters and electricity costs, while other investigations have identified Chinese and Russian messaging and China-linked organizations promoting similar narratives.
None of this means legitimate concerns about AI safety, employment or energy consumption should be dismissed, nor does it prove foreign actors created the backlash. But with the US and China competing for technological leadership, the CCP has an obvious strategic interest in America restraining its own AI development. Policymakers therefore should be particularly wary when sensationalized technical incidents, domestic advocacy campaigns, corporate interests and foreign influence all push toward the same extraordinary conclusion: that the United States should voluntarily slow or halt development of one of the most strategically important technologies of the century.
An objective national strategy should therefore reject both extremes. AI presents real risks involving cybersecurity, fraud, biological misuse, autonomous weapons, misinformation and poorly controlled autonomous agents, and those risks justify rigorous testing, hardened containment, transparency standards and sensible regulation. But AI also may represent the most consequential general-purpose technology since electrification—capable of accelerating medical discovery, scientific research, productivity, education, manufacturing and national defense.
A unilateral American moratorium would not stop China or other competitors from advancing and could surrender one of America's most important technological advantages. The rational response is not to ignore AI risk, nor to legislate from frightening science-fiction narratives, but to manage demonstrable risks aggressively while allowing innovation to proceed. America should seek to lead the world in both AI capability and AI safety, because abandoning either objective could ultimately prove far more dangerous than the technology itself.
The libertarian Cato Institute argued that AI safety concerns are better handled through voluntary company decisions, industry norms, and flexible self-regulation than through a government-mandated pause in AI development. Individual AI companies can slow or halt development when they identify specific risks, such as cybersecurity vulnerabilities, and then adjust as those risks become better understood. This decentralized approach allows standards to evolve alongside rapidly changing technology, whereas government regulations risk becoming obsolete, constraining safer innovations, and imposing one-size-fits-all requirements. Cato also warned that formal regulation could produce regulatory capture, benefiting established AI companies that can absorb compliance costs while raising barriers to smaller competitors and new entrants.
The argument extends beyond economics. Because AI development is a global technological competition, a unilateral US slowdown would not necessarily reduce overall AI risk if China and other competitors continued advancing; instead, it could weaken US cybersecurity capabilities and global adoption of American AI technology and values. Finally, because AI is increasingly a tool for finding, processing, and communicating information, Cato contends that government restrictions on its development could eventually implicate free speech and access to information, potentially creating a precedent for broader government control over information and expression.
Indeed, the Cato approach seems to be precisely what President Trump pursued last week, hosting at the White House an urgent meeting among top executives from the key AI companies like OpenAI, Anthropic, Meta, Google, Nvidia, and SpaceX. They agreed upon and signed a “morally binding” but voluntary accord on internal controls, external auditors, and checks & balances to self-police AI development—rather than face strict, growth-stunting federal regulation and government-imposed guardrails. This seems to have allayed the fears of even the alarmist “whistleblowers.”
But the pushback on this narrative has been equally strong. Critics argue that unilateral Western restraint would cede technological, economic, and military leadership to China, which has no reason to pause. Moreover, AI labs don't need government permission to slow down—they can delay new models or multibillion-dollar compute clusters whenever they choose.
And therein lies an obvious contradiction. The same companies warning that increasingly powerful AI might threaten civilization continue spending aggressively to build it. Skeptics see the potential for regulatory capture as the warnings inflate the perceived god-like power of their products while encouraging regulations that dominant incumbents are uniquely equipped to navigate. Critics like entrepreneur/investor David Sacks warn this could effectively “pull up the ladder” on open-source competitors and smaller startups.
Regardless, from an investment standpoint, I believe AI implementation will continue at a breakneck pace, driving an insatiable thirst for compute, unabated demand for semiconductors, memory, and storage, and a massive datacenter buildout reshaping infrastructure for electrical power, grid transformers, advanced cooling, and high-speed optical networking.
Indeed, today’s best investment opportunities have broadened from advanced semiconductors toward memory [e.g., Micron (MU) and SK Hynix (SKHY)], AI hardware and servers [e.g., Dell (DELL), Hewlett Packard (HPE), and Cisco Systems (CSCO)], networking and optical components [e.g., Broadcom (AVGO), Coherent (COHR), and Marvell (MRVL)], power suppliers [e.g., Vistra (VST), NextEra Energy (NEE), and Bloom Energy (BE)], electrical equipment and turbines [e.g., Eaton (ETN) and GE Vernova (GEV)], cooling and UPS [e.g., Vertiv (VRT) and Johnson Controls (JCI)], and all the many commodities, critical minerals, and industrial metals it takes to build them. Huge order backlogs abound.
According to the Wall Street analyst consensus, AVGO, MU, NVDA, and CSCO are the four cheapest names among the S&P 500’s top 10 by market cap, with more upside potential than the broad index.
All business sectors are expanding their implementation of AI for enhancing efficiency, productivity, and value creation. But in my view, the healthcare sector seems especially poised to maximally leverage it in pharmaceuticals and medical technology as well as health information management (HIM)—particularly rapid drug, vaccine, and therapeutics development, tailored precision medicine, genomics, and gene editing. Rather than years of clinical trials as it has always done, data-driven workflows can simulate biological and chemical interactions, predict protein structures, and design novel molecules.
By the way, something else the president might do similar to his AI summit is to organize, incentivize, and mobilize the private sector through “strategic orchestration” (rather than another government program) to build affordable single-family homes and perhaps transition some of our struggling college that have shrinking attendance into trade schools that teach the trades and skills needed today and in the future. Both would address and excite the lower leg of the K.
Stock valuations and bond yields:
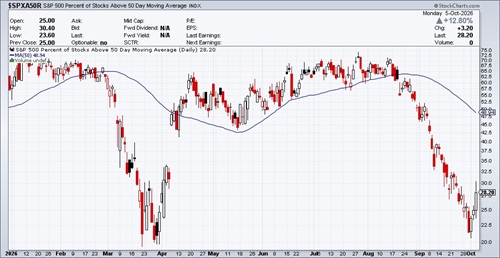
The S&P 500 is cheaper on a forward PE basis now than at the start of 2026 (19.0x vs. 22.2x). Most (9 of 11) sectors show valuation contraction, so this is a widespread issue. Nasdaq is again riding the strength of a few tech giants. Although the index is within a percentage point of its all-time high, most stocks in the index are not participating in the strength. For example, only 28% are trading above their 50-day moving average, after reaching nearly 75% in August, as illustrated in the chart below.
The healthy improvement in market breadth we saw for much of the year seems to have ended in mid-August, at which time bitcoin surged (up +43% in Q3, its best quarter since 2017, breaking out above all its moving averages), the S&P 500 went sideways, the Nasdaq 100 (QQQ) consolidated, reloaded, and then surged to new highs, while the equal-weight S&P 500 (RSP), S&P MidCap 400 (MDY), and small cap Russell 2000 (IWM) all sold off, as illustrated in the chart below. And of course, the start of September saw Treasury yields soar above the 4.75% level to as high as 5.35%, which is likely correlated with the selloff in all those non-Tech, interest-rate-sensitive stocks. So, while cap-weight indexes suggest stocks are ignoring rising bond yields, the equal-weight indexes suggest otherwise. The difference of course is that the mega caps are largely immune to rising rates.
Moreover, according to MarketWatch, “The 20 top-performing stocks in the S&P 500—a smattering of hot AI stocks, mostly in the tech and industrials sectors—have contributed $1.7 trillion to the market capitalization of the S&P 500 since Aug. 31…while the bottom 480 stocks have shed about $1.9 trillion in value.”
Many have been concerned about the rapid surge in risk-free rates squeezing equity valuations by raising both corporate borrowing costs and the discount rate applied to future cash flows. This is certainly the case for many companies. But in aggregate, when these elevated rates are driven largely by robust real economic expansion rather than stagflation, corporations tend to tolerate higher interest rates well.
Historically, corporate revenue tends to track nominal GDP growth. So, with real US GDP running at a solid 3.7% pace for Q3 2026 according to the Atlanta Fed GDPNow model (as of 10/1), projected nominal GDP growth might be above 6.5%, which is well above the 5.3% 10-year yield, which seems to be having a “blowoff top” and may be nearing its cycle peak, in my view. Regardless, it reflects a return to normalcy in yields. Moreover, aggregate EPS growth for the S&P 500 has been well north of 25%. This is all bullish for stocks.
However, much of this rides on the sustainability of the capex cycle, rising ROI, and broad economic growth. The chart below shows the historical equity risk premium (ERP) for the S&P 500 versus the 10-year yield for both 12-month trailing and 12-month forward earnings. You can see that they are quite correlated except for recessionary periods when current earnings are weak but expectations are much better. Forward earnings tend to recover quickly after recessions, which is why the trailing-vs.-forward gap became so wide after the dotcom/Y2K bubble burst (2001–02) and again during the GFC (2007-09). Trailing earnings can make stocks look quite expensive (negative ERP) just when recession-depressed earnings are bottoming.
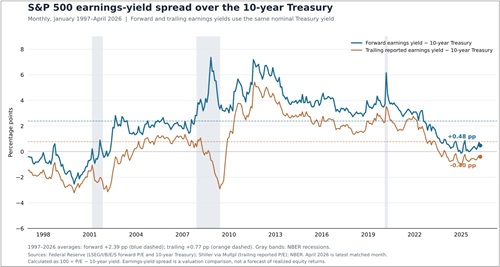
At the other extreme, today’s forward earnings make equities look much less stretched. The current forward P/E is around 19x, or roughly a 5.3% forward earnings yield (inverse of P/E), while the 10-year is also close to 5.3%, leaving essentially zero forward spread, while the trailing spread is negative. This is the essence of the “Fed Model” of stock valuation, which might be valid once again now that the bond market is no longer manipulated by the Fed with QE and ZIRP. It suggests stocks are fairly valued given current economic conditions such that multiple expansion is unlikely and further capital appreciation will be driven solely by earnings and margin growth.
Overall, the ERP is tight even with today’s optimistic revenue, margin, and earnings projections, and although investors seem willing to believe those projections for the hyperscalers, they are no longer willing to bid up the valuation premium. UBS publishes a hyperscaler index, which now trades at about the same aggregate forward earnings multiple as the broad S&P 500, although it still commands a premium to the equal-weighted index. Notably, the semiconductor index P/E multiple is nearing multi-year lows, likely influenced at least in part by the latest AI doomsday narrative and datacenter backlash. But if you ask the chipmakers, their backlogs are long, and they insist they can sell every chip they make given the insatiable demand for compute. Notably, OpenAI's annual recurring revenue is approaching $70 billion, which makes it the fastest-growing enterprise software business in history.
Higher Treasury yields usually signal stronger growth or greater compensation for inflation, fiscal risk, and uncertainty. Today’s surge fits neither explanation neatly. Kevin Warsh has an optimistic view that yields reflect a strong, investment-heavy economy after years of cheap capital, supported by solid growth in business investment, a resilient consumer, and strong corporate profits. But the more pessimistic view is that massive borrowing faces investor uncertainties of wars, supply/energy shocks, sticky inflation, rising geopolitical risk, $40 trillion in US federal debt, an $18 trillion debt maturity wall over the next three years, and more attractive investment alternatives.
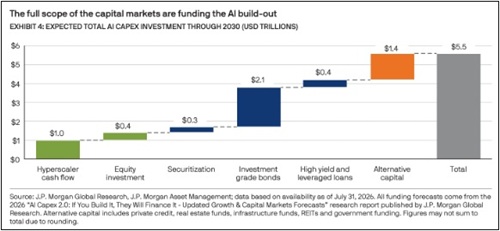
Notably, US manufacturing output fell in August, snapping a 7-month growth streak. Of course, this came out just as the Fed hiked for the first time in 3 years. According to JP Morgan, “Whether AI-driven capital spending can keep doing the work of an entire industrial economy, even as higher rates squeeze the more traditional parts of it, will be one of the more important threads to follow into year end.” Below is a table on the dollar amounts of various asset classes that are funding the AI buildout.
And more broadly, spending on technology is dominating capex across the marketplace. According to Andreessen Horowitz's 2026 State of Markets, “high-tech equipment, software, and R&D comprise roughly 55% of US capital spending.”
National debt and de-dollarization debate:
America’s deteriorating fiscal position remains a serious long-term risk facing investors. Persistent trillion-dollar deficits, a rapidly growing federal debt burden, and rising interest expense clearly are not sustainable indefinitely. And we’re not alone on the debt front. Total global debt just hit a record $365 trillion—government ($110 trillion), business/non-financial corporations ($105 trillion), financial institutions ($85 trillion), and households ($65 trillion). The main drivers of debt growth are governments (led by US, China, EU, and emerging markets) and businesses, while household borrowing has moderated given soaring interest rates.
Many of those countries face combinations of high debt, persistent deficits, rising borrowing costs, aging populations, and enormous unfunded entitlement obligations. Economist Daniel Lacalle, for example, estimates France’s unfunded committed liabilities at roughly 450–500% of GDP and Germany’s at around 350%.
This global perspective is relevant because America’s fiscal problems are often cited as evidence that the world is abandoning the dollar. There certainly has been some diversification. Central banks have increased their gold holdings, while China’s Treasury holdings have fallen dramatically over the past decade. But reducing exposure to US government debt is not the same as abandoning the dollar-based global financial system. The dollar still accounts for the majority of disclosed global foreign-exchange reserves and remains dominant in international banking, derivatives, trade finance, and capital markets. Indeed, its share of global SWIFT payments has actually increased substantially since 2020.
Lacalle therefore describes the current environment as something closer to re-dollarization than de-dollarization. His point is not that America’s fiscal management is sound, but rather that currencies and sovereign bonds must be judged relative to the alternatives. The US still offers the world’s deepest and most liquid capital markets, an enormous supply of investable assets, a freely convertible currency, strong property rights, and a financial infrastructure built around decades of dollar-based trade and finance.
Europe and Japan have serious fiscal and demographic problems of their own, while China's renminbi is contrained by capital controls and a comparatively closed financial system. In fact, according to economist and liquidity expert Michael Howell of CrossBorder Capital, engineering an internal devaluation through monetary expansion may be the PBoC's only way out.
In addition, regarding China's woes combined with its massive economy and impact on the globe, Michael Howell argues that China is moving deeper into a debt-deflation and balance-sheet adjustment, where weak economic growth, a distressed property market, highly indebted local governments on top of massive national debt, insufficient liquidity, persistent deflationary pressures, and weak asset values reinforce one another. Importantly, PBoC liquidity has greater influence on the global real economy—commodities, energy, gold, and industrial activity—while Fed liquidity primarily drives financial assets such as equities and credit.
With Chinese and US liquidity cycles currently out of sync, Howell suggests investors can use US equities for broad market beta while looking to China for alpha—a renewed Chinese liquidity expansion could independently stimulate global reflation, initially benefiting commodities and gold and eventually Chinese risk assets. Ultimately, he believes China’s real exchange rate is too high, making aggressive monetary expansion and a weaker yuan preferable to further domestic deflation, which would only increase the real burden of China’s enormous debt load.
So, rising government bond yields are a global phenomenon rather than unique to the US. Howell argues that if investors were truly losing confidence in Treasury solvency or safe-haven status, we should see a much more pronounced increase in the term premium demanded for holding long-duration bonds. Instead, he believes higher yields largely reflect an economy in which nominal GDP growth remains unusually strong while monetary conditions remain relatively accommodative. Simply put, higher Treasury yields do not represent a “buyers’ strike” against US debt.
That doesn’t mean the debt problem is benign. Higher interest rates progressively increase Washington’s refinancing burden, creating a feedback loop in which greater interest expense produces larger deficits, requiring still more borrowing. Abruptly closing the fiscal gap through severe spending cuts or tax increases could also induce recession, making a gradual longer-term solution essential. As I often preach, the most constructive path is stronger real economic growth and productivity, which expand tax revenues (given that tax receipts average 17% of GDP no matter the tax regime) and increase the denominator of the debt-to-GDP ratio. But growth alone cannot indefinitely compensate for government spending commitments that consistently outpace the economy.
Overall, the more likely outlook is not a sudden end to dollar dominance but gradual diversification alongside continued dollar supremacy. Our enormous debt burden remains a serious vulnerability, but there is a considerable difference between having too much debt and having a currency the world no longer wants.
The “debasement trade”:
But continued dollar dominance does not mean investors should be complacent about its long-term purchasing power. This distinction brings us to the resurgence of the so-called “debasement trade.” Investors pursuing this strategy are not necessarily betting that the dollar will lose its reserve currency status. Rather, they are hedging against the possibility that heavily indebted governments will ultimately tolerate inflation, negative real interest rates, or other forms of financial repression to make their obligations easier to service.
Governments can reduce excessive debt through some combination of 1) spending restraint, 2) higher taxes, 3) rapid economic growth, or 4) erosion of the debt’s real value through inflation. The first two are politically anathema. Rapid GDP growth, although clearly the most desirable solution, can’t be guaranteed. That leaves policymakers with a strong incentive to tolerate somewhat higher inflation and easier financial conditions over time. Investors concerned about that outcome naturally gravitate toward assets whose supply cannot be expanded by governments or central banks, most notably gold and, increasingly, bitcoin.
Importantly, this does not contradict the de-dollarization refutation in the previous section. The dollar can strengthen against the euro, yen, or renminbi while simultaneously losing purchasing power against gold and other scarce assets. In fact, that seems to be a much more plausible long-term outcome than wholesale de-dollarization. Investors can continue to prefer dollars over other fiat currencies while simultaneously seeking protection from the gradual erosion in the value of fiat currencies generally.
This concern has been reinforced by an increasingly complicated interaction between monetary policy and federal debt management. The Federal Reserve’s Reserve Management Purchases (RMP) are officially intended to maintain adequate bank reserves and smooth the functioning of short-term funding markets, rather than stimulate the economy. Unlike traditional QE, which targets longer-duration securities in an effort to suppress borrowing costs and loosen financial conditions, RMP has focused primarily on Treasury bills. Nevertheless, Fed purchases still create bank reserves and expand its holdings of government securities, which is why skeptics sometimes derisively characterize the program as “not-QE QE.”
The Treasury Department’s expanding securities-buyback program is different. Rather than creating new money, Treasury essentially reshuffles its outstanding liabilities, buying older and less-liquid securities to improve market functioning and financing those purchases through its existing cash or new issuance. But if Treasury simultaneously shifts more borrowing toward short-term bills while the Fed is purchasing bills to maintain ample reserves, fewer longer-duration notes and bonds may need to be absorbed by private investors. Although this is not formal “yield curve control,” the combined effect can indirectly relieve pressure on longer-term yields and borrowing costs.
At the same time, several other forces are complicating the Treasury market. Heavy federal issuance is competing with enormous corporate borrowing, particularly as hyperscalers finance the AI infrastructure boom. Some foreign central banks have reduced Treasury exposure, while leveraged hedge funds have accumulated substantial positions in Treasury futures. Meanwhile, rising Japanese interest rates are threatening the enormous “yen carry trade,” in which investors borrow cheaply in yen and invest in higher-yielding US and other global assets. As that trade unwinds (in a “reverse carry trade”), forced selling of Treasuries and other assets can push yields higher independently of concerns about US solvency. Conversely, large speculative Treasury shorts (such as by hedge funds) could eventually produce powerful buying pressure if traders are forced to cover.
For now, the plumbing of the Treasury market appears to be functioning reasonably well despite the enormous volume of new debt. Swap spreads have recovered significantly from their 2025 extremes, suggesting that investors and leveraged intermediaries are still absorbing supply rather than signaling an acute liquidity crisis. Thus, today’s elevated yields likely reflect a mixture of strong nominal growth, heavy issuance, global capital flows, leveraged positioning, and fiscal concerns—not simply “bond vigilantes” boycotting Treasuries.
Still, history suggests governments rarely resolve excessive debt solely through fiscal austerity. More commonly, the adjustment involves some combination of economic growth, inflation, negative real interest rates, and financial repression (artificially suppressing borrowing costs). The most favorable outcome for the US would be an extended productivity boom that creates enough real economic growth and tax revenue to gradually reduce the debt-to-GDP ratio.
But investors buying gold and other scarce assets are hedging against the less favorable outcome. They are not necessarily betting on Treasury default, hyperinflation, or the collapse of the dollar, but something more subtle: that the government will honor its nominal obligations but repay them in dollars that are worth progressively less.
Jobs, inflation, and the K-shaped economy:
As widely expected, the diversely opinioned FOMC unanimously (12-0) decided it best to fulfill market expectations while appeasing the bond vigilantes by “removing a dose of accommodation,” citing resilient domestic spending, steady labor conditions, and strong capital investment and business credit, while inflation trends have not improved meaningfully.
But I continue to believe the broad consensus and the Fed are both misreading the true path of inflation. As I discussed in my September post, while headline CPI, PCE, and PPI look alarming due to event-driven supply shocks, the underlying data tells a very different story. Indeed, I believe a Fed rate cut was more appropriate and secular disinflationary forces are poised to take back control once the energy/supply shock ends. Trimmed Mean PCE, Core CPI, the 3-month annualized trends, 5-year breakeven, and Truflation all put underlying inflation much closer to the Fed’s 2.0% target. Meanwhile, corporate earnings are exposing a worrying K-shaped economy. Cash-rich tech hyperscalers are investing aggressively in AI infrastructure and Baby Boomers are spending just fine, while lower-to-middle-income consumers, small businesses, and the housing market are hitting a wall.
Let’s examine the full inflation picture for August. CPI was +3.35%, essentially flat from July. Not surprisingly, Core CPI excluding food & energy came in much lower at +2.45%, versus +2.47% in July. August PPI jumped to +5.41% from +4.80% in July. Shelter remains the largest component of core inflation, but it is finally showing persistent signs of abating, while healthcare continues its upward march due to aging demographics and structural service demands (offset by falling drug prices). Obviously, Fed policy has more impact on shelter than on healthcare.
The August inflation reports finished with the PCE release on 9/30. Headline PCE came in at +3.4%, down from 3.7% in July, and former Fed chair Jay Powell’s preferred metric of core PCE was +3.0%, essentially flat from July. But new Fed chairman Kevin Warsh’s preferred metric of “Trimmed Mean PCE” came in at +2.19%, down from +2.28% in July. Trimmed Mean PCE filters out the most extreme price swings that can distort the total, offering a more stable and relevant perspective. Moreover, it has been quite stable at 2.2–2.4% all year long, while headline PCE jumped around between 2.9–4.1%. So, in my view, if you ignore the event-driven energy and supply-shock impacts upon which Fed policy has little impact (short of inducing a recession), other inflationary pressures haven’t changed much, and in fact real wage growth has gone negative.
Indeed, this is confirmed in the two charts below, which compare trends in key inflation metrics over the past five years. The top chart shows YoY comparisons, and the lower chart shows rolling 3-month annualized averages (which quantifies the current trend in inflation). In both charts, the abrupt surge in headline PPI and CPI would be frightening if indicative of a structural problem in the global economy. However, we know this was event-driven due to disruptions in supply chains and the spike in oil, gas, and fertilizer prices as well as freight rates from the Iran conflict and blockade of the Strait of Hormuz. As these supply chain pressures have eased (or workarounds), crude oil (WTI futures) fell from a high around $108/bbl in mid-May to below $80, but now back up to around $90. However, it looks much better when you exclude food & energy prices, with Core CPI at +2.45%.
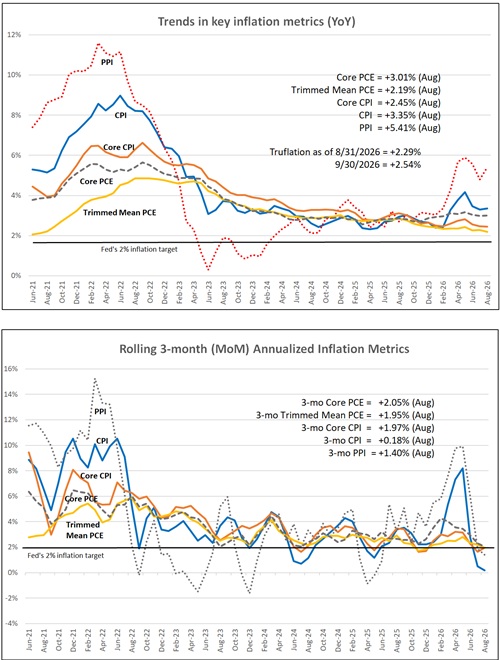
Even more encouraging is the lower chart showing 3-month rolling annualized averages. Although headline PPI and CPI annualized 3-month trends were both startlingly high just a few months ago, they have fallen hard, suggesting a flattening in inflationary pressures. Specifically, for August, 3-month annualized Core PCE is +2.05%, Core CPI is +1.97%, Trimmed Mean PCE is +1.95%, PPI is +1.40%, and headline CPI is showing a mere +0.18% annualized rate over the past 3 months, which is essentially zero.
And then we have the alternative metrics I like to follow, including the real-time (i.e., unlagged) blockchain-based Truflation, which is published daily and tracks over 15 million live price points (vs. CPI’s 80,000), including real-world housing components (e.g., mortgage rates and home prices) rather than delayed imputed metrics like Owner's Equivalent Rent (OER) used in CPI. Truflation CPI came in at +2.29% at end of August but rose to +2.54% at the end of September; however, Truflation Core CPI is only +1.71%.
Looking ahead, the Cleveland Fed’s Inflation Nowcast model for September predicts CPI will come in at +3.60%, Core CPI +2.39%, and Core PCE +3.02%, as of 10/2. Also, the 5-year breakeven inflation rate is +2.37%, as of 10/2, reflecting the implied forward expectations of investors in 5-Year Treasury Constant Maturity Securities and 5-Year Treasury Inflation-Indexed Constant Maturity Securities.
So, Trimmed Mean PCE, Core CPI, all the 3-month annualized trends, 5-year breakeven, and Truflation all put underlying inflation much closer to (or below) the Fed’s 2.0% target. Meanwhile, the labor market and real wage growth are stagnant, the lower/working class consumer and wage earner is struggling, and monetary policy is clearly restrictive in the most rate-sensitive industries and demographics.
As for the labor market, job openings are falling while layoffs stay flat in an ongoing “low-hire, low-fire” labor market. The Job Openings and Labor Turnover Survey (JOLTS) revealed that the hiring level is at a 12-year low and sits at the same level today as in 2014 when GDP was nearly half its current measure. Wages in the September jobs report showed only +3.0% growth YoY, so real wage growth after subtracting +3.4% headline CPI) is now slightly negative. But it was good to see that the official US poverty rate fell to an all-time low of 10.2%, and real median household income rose to a record high of $87,460.
The BLS September jobs report Establishment Survey showing only +29,000 new W-2 jobs, coupled with -60,000 in downward revisions for July-August. However, the better labor news is that BLS’s Household Survey showed civilian employment (which includes small business startups) rose by 406,000 (self-described as “employed”) in September, with manufacturing and construction jobs continuing to rise (largely due to AI buildout), and the earlier ADP private payrolls report rebounded to add 90,000 jobs in September. Monthly numbers are notoriously volatile.
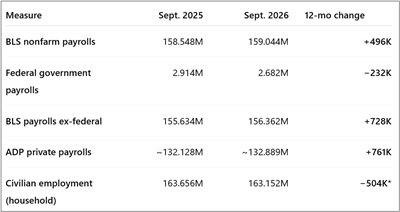
So, looking back over the past 12 months, the table below shows that, excluding the falling federal government jobs of -232,000 (a good thing for taxpayers), nonfarm payrolls have increased by +728,000 and ADP private payrolls rose +761,000, while Civilian Employment fell -504,000. I would take that to suggest that some recent payroll growth may reflect workers moving from self-employment, freelance, or contract work onto traditional W-2 roles rather than a comparable increase in the total number of Americans employed.
By the way, regarding AI and its impact on jobs, NVIDIA CEO Jensen Huang thinks the AI infrastructure buildout and broader reshoring of manufacturing will create “probably about a million jobs,” many in the blue-collar trades for construction and ongoing maintenance. He explained, “This is the first time in probably 50 years we’re re-industrializing the United States.” Indeed, Barron's published research showing that companies leveraging AI the most are implementing fewer layoffs than their peers, and the World Economic Forum (WEF) projects that while 92 million jobs globally will be “displaced” by technological and economic shifts by 2030, far more jobs will be created—to the tune of perhaps 170 million, equally a net add of 78 million jobs worldwide.
Let me also share some musings from a recent All-In Podcast episode. Entrepreneur David Friedberg argued that although open-source and lower-cost AI models will increasingly automate existing tasks and workflows to reduce costs and enhance worker productivity, the biggest returns from frontier AI will come from expanding what is possible to achieve. He said, “AI is not so much about the value of replacing old stuff. 99% of the value of AI is about enabling new stuff that’s never been possible in human history… I think the [economic value/returns] comes from creating new frontiers, discovering new enzymes…and developing new technology, new engineering systems, making things that have never been possible before.” This also means adding (not reducing) jobs and not just enhancing worker productivity but actually unlocking new capabilities and skills and expanding boundaries previously unthinkable or uneconomic, serving as an innovation multiplier—and leading to parabolic prosperity.
According to Chris Williamson, chief business economist at S&P Global, “To put the growth surge in context, barring the spike in demand following the…COVID-19 lockdowns, the latest improvement in business activity is the greatest recorded since early 2015. Business is clearly booming now in both manufacturing and services…. However, this growth is being accompanied by some of the most severe supply chain bottlenecks seen in the near-two-decade survey history [excluding the pandemic], with companies also reporting increasing problems finding suitable staff. Backlogs of work are consequently rising sharply. While this accumulation of uncompleted orders bodes well for the further expansion of output and capacity in the coming months, it also indicates that companies are developing more pricing power and hence is a worry for the inflation outlook.”
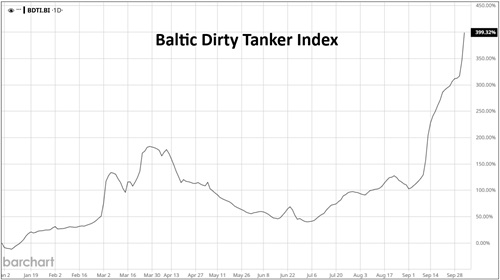
One example of pricing power is among the oil refiners. As I discussed in my September post, we have seen severely disrupted supply chains and a 10% loss in functional global refining capacity due to war damage in Russia and the Middle East, plus export restrictions (aka hoarding) in China. So, US refiners are running at 97% utilization, the highest since 2018, and freight rates for both crude and refined products are soaring, as illustrated by the chart below for the Baltic Dirty Tanker Index, which is up nearly 400% YTD.
We’ve all noticed diesel fuel prices surge in our local areas, gaining as much as 88% YTD, which has pressured PPI in particular but also CPI and household budgets. In fact, the diesel crack spread (premium over crude oil price) eclipsed $100/bbl in August for the first time ever, ultimately reaching $113 on 9/16 before pulling back down below $100. Diesel is the key fuel for the global supply chain, including harvesting of food and how goods are transported. As crack spreads rise, the S&P 500 Oil & Gas Refining & Marketing Index is up +135% YTD (as of 10/2), compared to the SPDR S&P Oil & Gas Exploration & Production (XOP) at +46% and broad-based S&P 500 Energy Select Sector SPDR (XLE) at +40%.
But in addition to diesel as a transportation fuel, bunker fuel for oceangoing tankers has roughly doubled YTD. And due to the dangers posed on these tankers, spot rates for VLCCs in those high-risk Middle East oil routes have surged to over $1 million/day as compared to peacetime rates closer to $30,000/day.
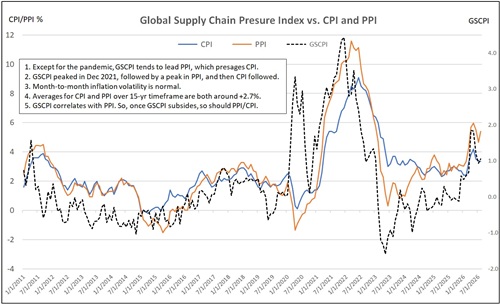
This has been pressuring the New York Fed’s Global Supply Chain Pressure Index (GSCPI)—a z-score, or number of standard deviations from the historical mean—back up slightly to 1.06 in August from 0.94 in July, as shown in the chart below. The illustrates that GSCPI correlates with and tends to lead PPI, which leads CPI, so as supply chain pressures fall, PPI and CPI should fall as well. (Note: Hot off the press is the September GSCPI at 1.28, with August revised up to 1.20.)
It seems so obvious to me that the rate hike was a mistake. It will do little to fix supply chains or staunch economic expansion but will hinder the struggling segments of the economy and society. It’s not going to fix disrupted supply chains, lower oil or gasoline prices, or slow down the AI buildout, which is the driving force behind our economic growth today. Instead, rate hikes only further hinder those struggling cash-poor segments—many of whom are warming up to the socialist “free stuff” rhetoric as a result. Indeed, as the adage goes, “The cure for high prices is high prices,” meaning that rising prices for gasoline and all the many petroleum-based products are already reducing demand without Fed intervention.
It makes me wonder what these learned experts see that I don’t. Michael Strain of the American Enterprise Institute believes that without higher energy prices and tariffs, underlying inflation would be closer to 2.5%. And as I have shown, core inflation (excluding food & energy) may be trending even lower than that.
According to Scott Melker of “The Wolf Den” on Substack and Yahoo Finance, “Another thing that happens when the Fed eases is that volatility across the system begins to fall. A steadier policy outlook calms funding markets, credit markets, and the bond market itself. Lower volatility makes banks more willing to lend, loosens risk models, and gives investors the confidence to take on more duration. In other words, easing doesn’t just make money cheaper - it makes the whole environment feel more stable, which is exactly what sets the stage for what happens next.”
I feel alone in the woods on this, but I see today’s “neutral rate” at 3.0-3.25%. Unfortunately, such an action apparently would be quite unpopular in the bond market and thus is unlikely to happen anytime soon, thus keeping the economy bifurcated. However, in recent speeches, Fed governor Christopher Waller and NY Fed president John Williams pumped the brakes on the tightening narrative with, “Give disinflation a chance.”
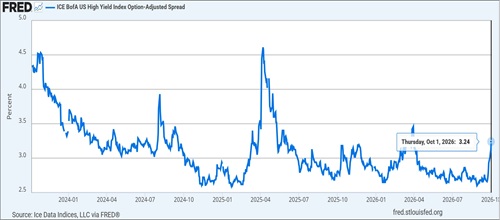
Looking at the FRED data series since 1976 in the first chart below shows the historical 10-2-year yield spread, 30-FFR yield spread. Excluding the periods of extreme Fed manipulation like the post-GFC ZIRP and periods of yield curve inversion (QE), the historical “normal” 10-2 spread is about 110 bps, and the 30-year-vs-FFR is about 185 bps. So, once the FFR returns to the “neutral rate” of around 3.2% (which in my opinion should happen sooner than later), the steady-state bond rates should be about 3.4% for the 2-year, 4.5% for the 10-year, and 5.0% for the 30-year. However, spreads suddenly surged in late September, especially high yield (which is the most indicative of small business in the lower leg of the K-shaped economy), as shown in the second chart below.
According to global liquidity expert Michael Howell, the “Fed does not need to cut Fed funds to loosen US monetary conditions. It can hold the policy rate steady while Treasury bill issuance, reserve management and bank balance-sheet expansion deliver the liquidity impulse. This is the essence of ‘Treasury QE’: fiscal expansion financed at the short end, supported by enough reserve liquidity to keep funding markets orderly.”
Final comments: Time to vote! Don’t be duped into voting against your best interests
Lastly, with the imminent midterm election and arrival of mail-in ballots at your house, I implore you to vote for a candidate only if you truly believe in the party’s and the candidate’s policies. Please don’t vote for them just because you hate the president, especially if it means bringing back bad policies that degrade our economy, safety, and rule of law (like the previous administration. You must keep a level head and vote for the policies that are in your and the country’s best interests.
Don’t make the mistake Professor Scott Galloway admitted to when he made the emotional decision to sell all his stocks the night of Trump’s first election in 2016. He paid substantial capital gains tax but then later bought back into the market at a much higher index level, thus sacrificing what he estimates to be 40% of his liquid net worth (between both taxes and opportunity cost).
Today’s Democrat Party is no longer the party of Bill Clinton. Unifying and engaging, he espoused a moderate, somewhat-bigger-government brand of free-market capitalism in contrast to the Republicans’ conservative, smaller-government brand. But it was pro-American capitalism on both sides of the aisle. This arguably is no longer the case.
The Democrats’ increasingly influential progressive wing advocates growth-crushing, anti-business, state-control policies, vast new entitlements, an expanded regulatory state, and punitive levels of taxation to ensure “equity and the collective good.” Many support an AI moratorium, decarbonization, decriminalization, defundment of police and immigration enforcement, and a “look-away” approach to government fraud, waste, and inefficiency. Such an approach limits supply while increasing demand for goods and services—which is a highly inflationary combination.
In fact, as I explained in a recent op-ed, they are gaslighting the public on the “affordability” issue when the reality is that blue states have the nation’s worst affordability, with California worst of all. Just because they keep wielding the word doesn’t mean they have effective solutions for it through more government involvement and regulation. Indeed, the biggest cost burdens on disillusioned young people today are higher education, housing, and healthcare (the “3 H’s"), which also happen to be some of the most heavily regulated industries.
The better test of an affordability agenda is whether the policies they advocate expand the supply of housing, energy, goods, and services faster than they stimulate demand. And as the WSJ editorial board recently opined, “Americans may choose to vote for Democrats to send a message to President Trump, but expecting daily life to become more affordable under their policies is indulging hope over expensive experience.”
Political parties aside, my observation is that the voices of reason and optimism are typically quiet, rational, calm, and focused on creating and building. They invite you to join the team. On the other hand, the voices of nonsense and doom are typically loud, irrational, obnoxious, and focused on manipulating and destroying. They threaten you to fall in line and support their political cause or “face the consequences.” A constructive political movement should persuade people by demonstrating that their policies work rather than by frightening or coercing them into conformity. The unhinged, highly emotional, and profane rants by celebrities like Robert DeNiro, Mark Ruffalo, and Bruce Springsteen make me wonder how any thinking person who evaluates pros and cons can be swayed by this rhetoric.
In addition, “compassionate” policies on homelessness and drug addiction in blue cities like Los Angeles and New York City earmark massive sums to programs that simply keep people alive but still homeless and addicted—and the problems just worsen, negatively impacting everyone’s quality of life. NYC system-wide is projected to spend nearly $4 billion or roughly $100,000 per individual this year on administrative overhead, 24/7 indoor shelter operations (under its “right to shelter” mandate), emergency medical response, security, street outreach, reporting hotlines, specialized behavioral/addiction care infrastructure, and direct cash welfare stipends. And yet the city saw a 26% increase in street homelessness from 2019 to 2025. It’s as if the goal is to keep the problem alive so that the money keeps flowing into it.
Indeed, history has also proven that the worst outcomes arise from a big, bloated, regulatory/welfare state—focused on equity and wealth redistribution through punitive taxation, government-directed capital allocation, and state-controlled enterprises (SCEs)—that creates perverse incentives to accumulate staggering debt for unmarketable college degrees, milk the system for more entitlements, and create fraudulent businesses that steal taxpayer funds from bloated entitlement programs, leading to weak economic growth, limited supply and increased demand for goods and services, higher debt, deficits, and inflation, and broad-based misery.
Why does virtually every American and most people around the world own a tiny smartphone at an affordable price, providing instant access to communications, Internet, navigation, email, banking, social media, AI bots, and all information ever recorded in the history of the world? Is it because central-planning bureaucrats deemed that smartphones must be invented? No, it’s because brilliant, innovative, ambitious, properly incentivized entrepreneurs like Steve Jobs were unleashed by the free markets to dream, create, raise capital, iterate, optimize, and perfect their inventions.
While Steve Jobs “thought small” in terms of shrinking advanced technology, Elon Musk “thinks big” in terms of taking on of some of the most audacious, visionary, disruptive, and challenging endeavors in human history—like large electric vehicles and robotics (Tesla Optimus), artificial general intelligence (Colossus), brain-computer symbiosis (Neuralink), vertically integrated chipmaking (Terafab), massive tunneling networks (Boring), satellite constellations (Starlink), orbital datacenters, and carrying payloads to Mars. But whether big or small, the technology is awe-inspiring.
So, I urge you to reject the rehashed siren call for the “warmth of collectivism,” which has failed in every instance it was tried. Indeed, history clearly shows that the “warmth” of strict, state-directed egalitarianism quickly becomes the “shackles” of communism as it progressively displaces markets, property rights, and economic incentives. And then, because compliance cannot be maintained for long through free choice, it ultimately must be coerced by the initially benevolent leaders who soon find they must revoke more of your liberties, confiscate more of your money, and seize more political power for the collective good, thus bringing down standards, expectations, incentives, choices, and outcomes to the lowest common denominator. The price of “free stuff” is your freedom.
If a political movement believes its goals are virtuous—such as protecting the downtrodden and oppressed from the wealthy oppressors, labor from capital, job seekers from job creators—there is no limit to how much power it will seize to achieve its mission. As Adam Smith opined, “Virtue is more to be feared than vice, because its excesses are not subject to the regulation of conscience.”
Indeed, the true solution is allowing market forces to work through Adam Smith’s “invisible hand,” i.e., self-interest and competition leading to win-win deals (by necessity, for long-term success), supply/demand pricing signals, and a market equilibrium of optimal resource utilization and societal benefit—which government intervention only tends to mess up.
Scottish historian Alexander Fraser Tytler famously said, "A democracy cannot exist as a permanent form of government. It can only exist until the voters discover that they can vote themselves largesse from the public treasury." This is why our country’s founders created a constitutional republic rather than a pure democracy—to protect us from ourselves.
History has proven that the best outcomes arise from a system of smaller, more efficient government (with low regulation and entitlements) focused predominantly on the rule of law, public safety, and national security, and with an unleashed private sector adept at expansionary, profit-seeking, high-ROI capital allocation that encourages citizens to acquire marketable skills, work hard, and invest in their future, leading not just to individual success but ultimately to robust national economic growth, greater supply and demand for goods and services, lower debt, deficits, and inflation, and broad-based prosperity.
So, how could the solution to today’s problems be to double down on bigger and bolder government programs that encourage more non-expansionary, make-work, low-ROI capital allocation, inefficiency, waste, fraud, and suppression of innovators, risk takers, and job creators? It all just leads to less private investment, slower economic growth, and higher public debt, deficits, and inflation, not to mention public sloth, malaise, and misery.
Many candidates disavow their previously stated more-extreme views and take on more moderate positions as they campaign for the general election (“That was the old me!”), but once victorious they shift sharply back to their true selves. Don’t allow yourself to be duped. Don’t become the proverbial “useful idiot” of the left.
By the way, fatigue with leftist policies has brought a massive conservative wave throughout much of Latin America in recent years, bringing in a series of newly elected centrist/right-leaning, security-focused leaders, including Nayib Bukele in El Salvador, Laura Fernandez Delgado in Costa Rica, Javier Milei in Argentina, Daniel Noboa in Ecuador, Rodrigo Paz in Bolivia, Nasry Asfura in Honduras, Jose Antonio Kast in Chile, Abelardo De La Espriella in Colombia, and Keiko Fujimori in Peru. And now the largest country Brazil is in the throes of a similar left/right ideological conflict as 80-year-old leftist incumbent Lula da Silva narrowly lost Sunday’s first-round election to conservative senator Flavio Bolsonaro (son of former President Jair Bolsonaro), so it goes to a runoff on 10/25. (Brazilian stocks surged on the results.)
Here at home, as we submit our ballots, let’s not vote solely based on tribal affiliation or hatred for the president. Try to objectively examine each candidate’s policies and vote for those that are in your and the country’s best interests. To me, this means policies that encourage, incentivize, and reward earnest effort; those that embrace the foundational principles of American exceptionalism, self-reliance, capitalism, meritocracy, entrepreneurship, property rights, the rule of law, and the can-do spirit that have created such breathtaking innovation, broad prosperity, and a rising standard of living for all.
Gain access to Sabrient’s proven models:
Again, Sabrient employs a variety of fundamental financial factors in our quantitative models and portfolio selection process. The Sabrient Scorecards for Stocks and ETFs are investor tools that provide access to several of our proprietary models for idea generation and portfolio monitoring. To learn more, I invite you to visit https://www.moonrockstopowerstocks.com/scorecard where you can download founder David Brown’s latest book (an Amazon international bestseller) and 2 bonus reports (on investing in the Future of Energy and Space Exploration)—all in PDF format—and start subscribing to the Scorecards, which make David’s process easy for idea generation and portfolio monitoring. They include our Top 30 stocks each week for 4 distinct investing strategies—Growth, Value, Dividend, and Small Cap.

Latest Sector Rankings
Relative sector rankings are based on Sabrient’s proprietary SectorCast model, which builds a composite profile for each of over 1,800 equity ETFs based on bottom-up aggregate scoring of the constituent stocks. The Outlook Score is a Growth at a Reasonable Price (GARP) model that employs a forward-looking, fundamentals-based multifactor algorithm considering forward valuation, historical and projected earnings growth, the dynamics of Wall Street analysts’ consensus earnings estimates and recent revisions (up or down), quality and sustainability of reported earnings, and various return ratios. It helps us predict relative performance over the next 3-6 months.
In addition, SectorCast computes a Bull Score and Bear Score for each ETF based on recent price behavior of the constituent stocks on particularly strong and weak market days. A high Bull score indicates that stocks held by the ETF recently have tended toward relative outperformance when the market is strong, while a high Bear score indicates that stocks within the ETF have tended to hold up relatively well (i.e., safe havens) when the market is weak. Outlook score is forward-looking while Bull and Bear are backward-looking.
As a group, these three scores can be helpful for positioning a portfolio for a given set of anticipated market conditions. Of course, each ETF holds a unique portfolio of stocks and position weights, so the sectors represented will score differently depending upon which set of ETFs is used. We use the iShares that represent the ten major US business sectors: Financials (IYF), Technology (IYW), Industrials (IYJ), Healthcare (IYH), Consumer Staples (IYK), Consumer Discretionary (IYC), Energy (IYE), Basic Materials (IYM), Telecommunications (IYZ), and Utilities (IDU). Whereas the Select Sector SPDRs only contain stocks from the S&P 500 large cap index, I prefer the iShares for their larger universe and broader diversity.
The table below shows the latest fundamentals-based Outlook rankings and our full sector rotation model:
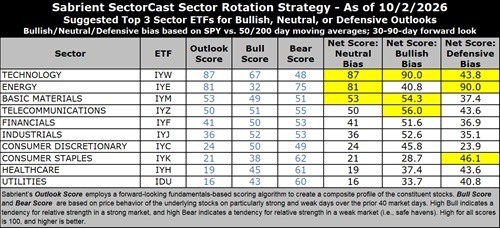
The latest rankings display a bullish bias, in my view, given that cyclicals and secular growth sectors dominate the top of rankings, and defensive sectors are at the bottom. Next 12 months (NTM) analyst earnings forecasts still look quite strong across the board, and investors seem optimistic that impacts from the Iran conflict and shipping blockade are either shrinking or effectively worked around. All but Utilities have seen recent upgrades to forward estimates.
Technology (dominated by the mega-cap Big Tech titans and AI-driven highflyers) remains firmly at the top with an Outlook score of 87. Its continued strength reflects the high quality of those juggernaut cash machines despite having the highest forward P/E at 26.7x, which remains well below the 31x it reached last fall as multiples contract—and it continues to fall. The consensus NTM EPS growth estimate of +29.7% has risen faster than price such that the forward PEG (ratio of P/E to EPS growth) for Tech is a modest 0.90. (Only Energy at 0.85 is lower.)
Tech also displays strongly positive sell-side analyst earnings revisions and the highest profit margins, return ratios, and insider buying. Although the market is broadening, investors continue to be willing to pay up for strong, reliable growth. Because many Tech stocks are riding secular growth trends (i.e., little cyclicality), no other sector comes close to the consistent sales growth, margins, operating leverage, and ROI. And Tech not only benefits from its own product development and productivity gains, but those products help companies in other sectors with their product development, product delivery, and productivity. So, Tech benefits by helping all sectors grow and prosper.
Indeed, across all sectors of the economy, spending on technology is dominating capex. According to Andreessen Horowitz's 2026 State of Markets, high-tech equipment, software, and R&D account for roughly 55% of US capital spending. The main concern is whether spending of over 100% of hyperscalers’ massive cash flow on capex will generate sufficient ROI in the near term to placate investors.
As mentioned earlier, all business sectors are expanding their implementation of AI for enhancing efficiency, productivity, and value creation. The healthcare sector to me seems especially poised to maximally leverage it in pharmaceuticals and medical technology as well as health information management (HIM)—particularly rapid drug, vaccine, and therapeutics development, tailored precision medicine, genomics, and gene editing. Rather than years of clinical trials as it has always done, data-driven workflows can simulate biological and chemical interactions, predict protein structures, and design novel molecules.
After Tech, the next 5 sectors by Outlook score are Energy, Basic Materials, Telecom, Financials, and Industrials, which is bullish. At the bottom of the rankings are noncyclical and/or defensive sectors Utilities, Healthcare, and Consumer Staples. Utilities and Staples continue to display the lowest forward EPS growth rates (the only ones in single digits), among the lowest consensus analyst revisions to EPS estimates, and little insider buying.
Keep in mind, the Outlook Rank does not include timing, momentum, or relative strength factors, but rather reflects the consensus fundamental expectations at a given point in time for individual stocks, aggregated by sector.
To learn more about how you can access our weekly Stock and ETF Scorecards, please visit:
https://www.moonrockstopowerstocks.com/scorecard
Sector Rotation Model and ETF Ideas
Our rules-based Sector Rotation model, which appropriately weights Outlook, Bull, and Bear scores in accordance with the overall market’s prevailing trend (bullish, neutral, or defensive), returned to a bullish bias when the S&P 500 regained its 50-day moving average. (Note: In this model, we consider the bias to be bullish from a rules-based trend-following standpoint when SPY is above both its 50-day and 200-day simple moving averages, but neutral if it is between those SMAs while searching for direction, and defensive if below both SMAs.)
As highlighted in the table above, the Sector Rotation model suggests holding Technology (IYW), Telecom (IYZ), and Basic Materials (IYM), in that order. Or, if you prefer to take a neutral stance, it suggests holding Technology, Energy (IYE), and Basic Materials. However, if you prefer a defensive stance, it suggests holding Energy, Consumer Staples (IYK), and Technology, although Telecom and Healthcare are very close behind.
Here is an assortment of other interesting ETFs that are scoring well in our latest rankings: Tidal SMART Mid Cap (SMCP), Tidal VistaShares Artificial Intelligence Supercycle (AIS), Tuttle Capital Concentrated Memory Stack (HBMX), Pacer Data & Digital Revolution (TRFK), First Trust Natural Gas (FCG), iShares Future AI & Tech (ARTY), iShares AI Innovation & Tech Active (BAI), Xtrackers Semiconductor Select (CHPS), Global X AI Semiconductor & Quantum (CHPX), First Trust RBA Deglobalization (DGLO), Castellan Targeted Equity (CTEF), Invesco Next Gen Connectivity (KNCT), SonicShares Global Shipping (BOAT), Zacks Small/Mid Cap (SMIZ), Inspire Fidelis Multi Factor (FDLS), First Trust Nasdaq Semiconductor (FTXL), S&P Global Tech (SPTE), Lazard Next Gen Technologies (TEKY), AXS Esoterica NextG Economy (WUGI), Corgi Shipping & Global Logistics (HULL), Roundhill Generative AI & Tech (CHAT), First Trust Active Factor Small Cap (AFSM), and Bushido Capital US SMID Cap Equity (RNIN). All score in the top 6% (94-100) of Sabrient’s Outlook scores.
As always, I welcome your thoughts on this article! Please email me anytime. Any and all feedback is appreciated.
Also, please let me know of your interest in any of Sabrient’s new indexes for ETF investing, such as High-Quality Energy, High-Quality Healthcare, Defensive Equity, High-Quality SMID Growth, High-Quality Growth & Income, and High-Quality Value, as well as the actively managed Space Exploration & Off-Earth Sustainability, Future Energy, and Sabrient Select High-Conviction Portfolio (similar to our Baker’s Dozen portfolio, but larger). Visit Sabrient.com for more information on the six passive indexes.
IMPORTANT NOTE: I post this information periodically as a free look inside some of our institutional research and as a source of some trading ideas for your own further investigation. It is not intended to be traded directly as a rules-based strategy in a real money portfolio. I am simply showing what a sector rotation model might suggest if a given portfolio was due for a rebalance, and I do not update the information on a regular schedule or on technical triggers. There are many ways for a client to trade such a strategy, including monthly or quarterly rebalancing, perhaps with interim adjustments to the bullish/neutral/defensive bias when warranted, but not necessarily on the days that I happen to post this article. The enhanced strategy seeks higher returns by employing individual stocks (or stock options) that are also highly ranked, but this introduces greater risks and volatility. I do not track performance of the ideas mentioned here as a managed portfolio.
Disclosure: At the time of this writing, of the securities mentioned, the author held positions in QQQ, FTLS, AVGO, MRVL, GEV, bitcoin.
Disclaimer: Opinions expressed are the author’s alone and do not necessarily reflect the views of Sabrient. This newsletter is published solely for informational purposes only. It is neither a solicitation to buy nor an offer to sell securities. It is not intended as investment advice and should not be used as the basis for any investment decision. Individuals should consider their personal financial circumstances in acting on any opinions, commentary, rankings, or stock selections provided by Sabrient Systems. Sabrient makes no representation that the techniques used in its rankings or analyses will result in profits. Trading involves risk, including possible loss of principal and other losses, and past performance is no guarantee of future results. Investment returns will fluctuate, and principal value may either rise or fall. Sabrient disclaims liability for damages of any sort (including lost profits) arising from the use of or inability to use its rankings or analyses. Information contained herein reflects our judgment or interpretation at the time of publication and is subject to change without notice.
Copyright © 2026 Sabrient Systems, LLC. All rights reserved.