
Sector Detector: Record low consumer sentiment might be signaling record high stock prices ahead

by Scott Martindale
CEO, Sabrient Systems LLC
Quick note: Sabrient’s new Q3 2026 Baker’s Dozen Portfolio will launch on Monday 7/20 as a 15-month portfolio with a mid-cap bias and a diverse group of 13 stocks across 8 business sectors, including several under-the-radar names. Notably, the next-to-terminate Q2 2025 Baker’s Dozen shows a gross total return of +54.7% from its inception date of 4/17/25 through 7/10/26, vs. +45.6% for SPY. Until 7/17, the Q2 2026 portfolio remains in primary market for new investment. Its top performers so far are Seagate Technologies (STX), Roku (ROKU), and AbbVie (ABBV).
Overview
During Q2 2026, the S&P 500 and Nasdaq Composite indexes posted their best quarter since the pandemic recovery in 2020, rising +14.9% and +21.4%, respectively, driven by AI-related chip stocks, as the resilient bull market powers on. And encouragingly, market breadth expanded nicely as the Russell 2000 small cap index was up +21.4% (following a flat +0.9% Q1), giving it its best H1 since 1991 (+22.6%) as investors sought to broaden their exposure into growing companies poised to benefit from the One Big Beautiful Bill Act’s (OBBBA) tax policies, deregulation, and incentives.
After ChatGPT arrived in November 2022, the market was all about AI-dominant Big Tech, creating hyperscale, and spending unprecedented capex (consuming all the hyperscalers’ massive cash flow, plus some new debt) that drove a 150% gain in the Nasdaq over the ensuing 3.5+ years (annualizing around 30%/yr). But so far this year, the “S&P 493” have vastly outperformed the MAG7 (which peaked on 5/14 and then sold off 15% by 6/26 before bouncing), and investors have invited small caps—and other “trickle down” industries benefiting from massive AI capex—to join the party, despite the event-driven oil price shock, inflation spike, and rising Treasury yields. But Treasury yields are likely being driven more by the hawkish Fed talk than from concerns about structural inflation, and although the coast isn’t entirely clear of macro hurdles, it would be highly unusual for this broadening advance to spell the end of the bull market.
In my full commentary below, I discuss:
1. The trend in consumer sentiment vs. stock prices
2. AI capex and power demand
3. Fundamental tailwinds and the impact on China
4. The “SaaSpocalyse” and what happens next
5. Global liquidity concerns
6. Status and outlook for GDP, inflation, jobs, and productivity
7. My final comments section on stanching the insidious rise of socialism in this country
8. Sabrient’s sector rankings, positioning of our sector rotation model, and some top-ranked ETF ideas
Investor preferences even within Big Tech are definitely rotating. Suddenly, Apple (AAPL) has caught up with Alphabet (GOOGL) as the top performing MAG7 stocks YTD. Apple is expanding its relationship with Broadcom (AVGO) in a $30 billion chipmaking deal to produce more than 15 billion chips in the US, including expansion of Broadcom’s Fort Collins, CO facility. There are now 13 stocks in the $1 trillion market cap club—the MAG7 plus tech sector comrades Taiwan Semi (TSM), Broadcom (AVGO), SpaceX (SPCX), and Micron (MU), along with financial Berkshire Hathaway (BRK-B) and healthcare name Lilly & Co (LLY).
Meanwhile, previous investor darling NVIDIA (NVDA) is now trading at its lowest multiple since 2019. Despite posting an 85% YoY increase in revenue, hitting a whopping $81.6 billion last quarter, share price has been flat such that its forward P/E at around 22x is on par with the broad S&P 500’s composite forward P/E. Compare that to its 5-year average of 72x. The chart below is from Phil Rosen of Opening Bell Daily.
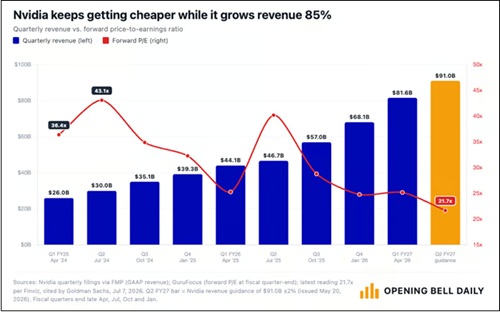
After pulling back nearly 20% from its all-time high on 5/14, NVIDIA has recovered some ground and is up about +13% YTD, but rival Advanced Micro (AMD) is up +160% and Intel (INTC) is up +200% over the same timeframe, with forward P/Es around 75x and 125x, respectively. More broadly, according to Morgan Stanley, the P/E premium for the MAG7 versus the other S&P 493 has compressed from above 30% to roughly 10%. I suppose investors don’t see how it can continue to achieve such amazing growth and huge margins, which are attracting more competition in the space. Regardless, analysts continue to raise estimates, and NVIDIA should remain a growth juggernaut for the foreseeable future—particularly with hyperscaler capex (much of which buys NVIDIA products) projected to reach $1 trillion in 2027.
Incredibly, although NVIDIA lost around $1 trillion in market cap during its May-June correction, it is now back above $5 trillion in market cap and is the world’s largest company—on par with Germany’s entire nominal GDP, which is the third-largest economy in the world behind the US and China. NVIDIA represents about 8.5% of the S&P 500 index market cap, and it is larger than: 1) the entire Russell 2000 small cap index ($3.5 trillion), 2) 6 of the world’s top 10 stock exchanges (including UK, France, Italy, India, and Spain); 3) 6 of the 11 sectors of the S&P 500 individually; and 4) the combined market cap of the S&P 500’s Materials, Real Estate, and Utilities sectors.
Broadening beyond the market’s biggest stocks is well in motion. Both the Russell 2000 small cap index (+20% YTD) and the Dow Jones Transportation Average (+18% YTD) have had their best start to a year since 1991. Financials, Healthcare, and Industrials all displayed outperformance versus the broad S&P 500 during June. Corporate profitability has been solid across industries, reflecting resilient demand, disciplined cost management, technological innovation, and sustainable productivity gains—not to mention the trillions of dollars in capex for the gradual onshoring/reshoring of manufacturing, much of it already underway. Net corporate income now accounts for 12.4% of GDP.
As I write about regularly, the outlook for inflation continues to improve, particularly given the many underlying global disinflationary trends. This week brings the June CPI/PPI numbers, which I expect will be lower—although the resumption this month in hostilities in Iran and the resultant jump in oil and gasoline prices might signal some inflationary pressures for the July metrics and cause investors (and the Fed) to hold off on any celebration. Notably, seven OPEC+ countries (Saudi Arabia, Russia, Iraq, Kuwait, Kazakhstan, Algeria, and Oman) agreed to increase oil production by a combined 188,000 barrels per day starting in August. But beyond that announcement, supply chains have rapidly diversified in response to the Strait of Hormuz bottleneck—and what the International Energy Agency (IEA) has called “the largest supply disruption in history”—such that it is no longer strangling the global economy, as I discussed in my April post. Indeed, this was long overdue as Iran has not been a reliable observer of the “right of transit passage” in narrow international straits under the UN Convention on the Law of the Sea (UNCLOS) in 47 years.
In my full commentary below, I discuss the divergence between poor consumer sentiment versus strong advisor sentiment and a rising stock market, as well as the shift in focus from both the federal government and institutional investors into hard assets and infrastructure. Moreover, through the end of this decade and likely beyond, I expect to see smaller government and less low-ROI government spending in favor of more high-ROI capital allocation from an unleashed private sector as the primary engine of organic economic growth through fiscal support like favorable tax policy, deregulation, and other supply-side incentives for reshoring/onshoring to increase productive capacity.
This should lead to strong real GDP growth, a peace dividend, rising productivity and a resumption in other disinflationary trends that bring back inflation under 2.5%, and a new “hands-off” Federal Reserve under new chairman Kevin Warsh that aims for less market intervention and does not fear that robust economic growth (aka “overheated” or “above trend”) fuels inflation. Instead, Warsh believes as I do that inflation in general is driven by excessive monetary expansion and deficit spending (including massive spending bills, “helicopter money,” and QE), rather than by a strong and productive private economy.
As such, I still think the S&P 500 might hit 8,000 by year end, although I also think gold, silver, copper, and bitcoin remain long-term accumulation plays, even though they might see further near-term headwinds (e.g., war, a hawkish Fed, and a strong dollar). Given the market broadening beyond the Big Tech titans, and assuming the Fed does not become overly hawkish, we continue to see opportunities in active stock selection, small caps, and bond-alternative dividend payers.
Indeed, Sabrient’s Baker’s Dozen, Forward Looking Value, Small Cap Growth, and Dividend portfolios have been largely outperforming their benchmarks. Our latest Q2 2026 Baker’s Dozen Portfolio launched on 4/17 as a 15-month portfolio with a mid-cap bias and a diverse group of 13 stocks across eight business sectors. It remains in primary market until Friday 7/17, and then the new Q3 2026 Baker’s Dozen launches on Monday 7/20. And, as a reminder, our Earnings Quality Rank (EQR) is licensed as a quality prescreen to the actively managed, low-beta First Trust Long-Short ETF (FTLS), which now has over $2.4 billion in AUM.
Sabrient employs a variety of fundamental financial factors in our quantitative models and portfolio selection process. Sabrient Scorecards for Stocks and ETFs are investor tools that provide access to several of our proprietary models for idea generation and portfolio monitoring. To learn more, I invite you to visit https://MoonRocksToPowerStocks.com where you can download founder David Brown’s latest book (an Amazon international bestseller) and 2 bonus reports (on investing in the Future of Energy and Space Exploration)—all in PDF format—and start subscribing to the Scorecards, which make David’s process easy for idea generation and portfolio monitoring. They include our Top 30 stocks each week for 4 distinct investing strategies—Growth, Value, Dividend, and Small Cap. To go straight to the Scorecard subscription, go to: https://www.moonrockstopowerstocks.com/sabrient-scorecard
Here is a link to this post in printable PDF format. As always, I’d love to hear from you! Please feel free to email me your thoughts on this article or if you’d like me to speak on any of these topics at your event! Read on….
Market Commentary
According to the monthly Wealth Management’s Advisor Sentiment Index (published 6/22), “with a de-escalation of the conflict in the Middle East, falling oil prices and a slate of large initial public offerings hitting the market, advisors are registering a strong vote of confidence in stocks and the underlying economy. Advisor sentiment on the stock market jumped 8% to an index reading of 131 (neutral = 100), the highest since the Advisor Sentiment Index began tracking the metric in January 2024… Strong corporate earnings, ongoing business profitability, AI-driven investment, and continued economic resilience were commonly mentioned as reasons for optimism, with several respondents noting that economic conditions appear stronger than media headlines often suggest.”
The three largest IPOs in history are expected this year (SPCX already being the first, with OpenAI and Anthropic likely next), M&A deal value during H1 2026 exceeded $1.5 trillion, which is the highest ever and represents an 80% YoY increase from H1 2025. Technology led with $668 billion in deal value, followed by energy and power at $383.6 billion. We are also witnessing a boom in venture capital raises (much of it to OpenAI and Anthropic), private credit, and new corporate bond and stock issuance. People are making valid comparisons of the widespread impacts of the AI buildout to the Transcontinental Railroad completed in 1869—a 6-year construction project that reduced the average travel time between New York City and San Francisco from months to a mere 7 days, thus opening up the entire country to settlement.
Indeed, according to DataTrek Research, “Nvidia’s B200 chip, the cutting edge in AI hardware, is 20 million times more powerful than the Intel Pentium chips that powered the 1990s Internet boom. That almost unimaginable difference is why comparisons to previous innovation cycles fall short. Computing power compounds its utility far faster than railroads or electricity ever could.”
And yet we are witnessing a huge divergence between record-low consumer sentiment versus optimistic investor sentiment, which from a contrarian perspective actually might be signaling a renewed upswing in stocks. The chart below shows the University of Michigan Index of Consumer Sentiment (ICS) versus the S&P 500. The major bottoms in consumer sentiment (1990, 2003, 2008, 2011, 2020, and 2022) all occurred during or shortly after significant market declines, while the highest sentiment readings (late 1990s and 2018–21) occurred after long bull markets resulting in forward returns that were generally more muted. The circled areas indicate sentiment lows corresponding to periods when investors who bought stocks were generally well rewarded over the following several years.
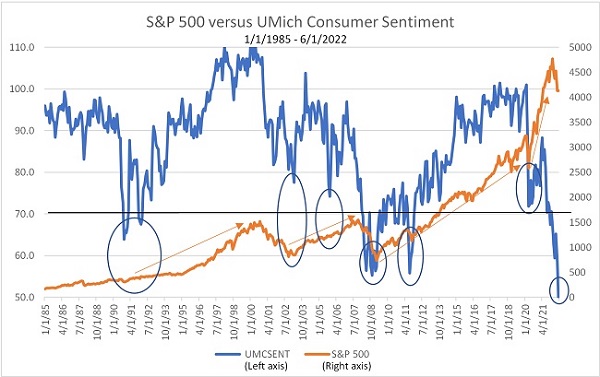
This is an updated version of the chart I first published back in June 2022, and you can see that the sentiment low at that moment in time marked the end of the bear market and a major turning point in stocks. The latest UMich ICS low just occurred in May at 44.8, which marked an all-time low for the index. But it bounced in June to 49.5 and might be signaling the next major upswing. It is typical for the market to find a bottom before consumer sentiment bottoms. By the time the average consumer feels the worst about the economy, the stock market has often already begun pricing in better conditions.
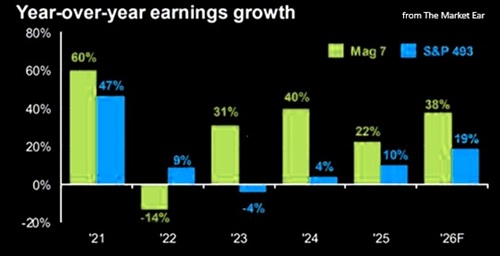
A significant concern—and perhaps a reason that many stocks have retreated despite incredible earnings reports—is that the bar is too high, i.e., expectations are enormous. EPS growth estimates keep rising, with the S&P 500 companies expected to see an aggregate of +21.6% YoY (recently revised down slightly) for full-year 2026 versus last year—and similarly great stuff next year. And the S&P MidCap 400 and S&P SmallCap 600 forward earnings have climbed to new record highs along with the S&P 500, as shown in the chart below from The Market Ear.
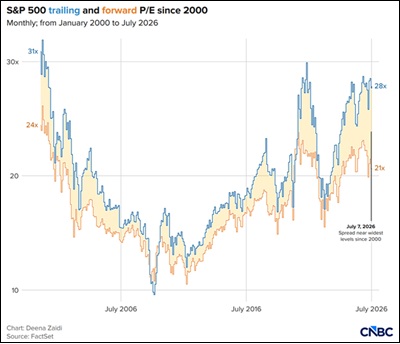
But as CNBC observed in the chart below, the spread between trailing and forward P/Es on the S&P 500 historically has only been this wide at market extremes. Although modest at around 21x, those forward expectations are lofty—and there isn’t much room for disappointment.
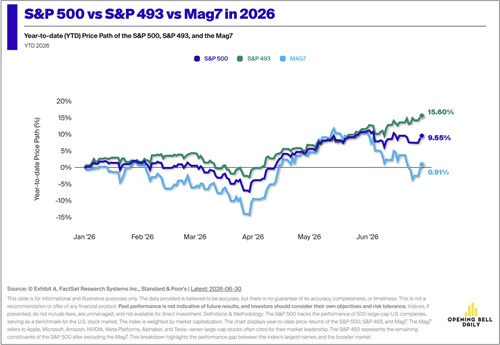
But rather than a major market correction, I expect we would see more broadening into those “S&P 493” large caps, S&P 400 mid-caps, and S&P 600 and Russell 2000 small caps, not to mention long-neglected value and quality stocks. The chart below from The Opening Bell Daily illustrates the recent relative outperformance YTD of the “S&P 493” versus the full S&P 500 and the MAG7.
AI capex and power demand:
Bank of America recently published a report highlighting two key drivers supporting stronger global growth expectations. First, an expanding AI capex cycle in the US continues to fuel unprecedented spending on computing infrastructure, semiconductor manufacturing, cloud platforms, and datacenters. Second, increased demand for AI hardware and industrial equipment has strengthened export activity throughout Asia, which is rippling across global supply chains. These drivers have become a macroeconomic force impacting corporate earnings, capex, productivity, international trade, and sustained economic growth. This AI expansion is being supported by tangible infrastructure investment rather than merely speculative software adoption alone, as in days of yore, suggesting the investment cycle still has plenty of room for expansion.
Furthermore, BofA points out that unlike the dot-com era in which businesses had to buy new physical hardware and re-engineered workflows, which took years to be reflected in the GDP metrics, today’s AI has the luxury of existing the cloud infrastructure that allows it to diffuse instantly throughout the economy. And while the dot-com era allowed for the automation of computation and data storage, today’s AI provides for the automation of cognition, including text/code/image generation, reasoning, and prediction.
AI pioneer Fei-Fei Li, founding co-director of the new Stanford Institute for Human-Centered Artificial Intelligence, says today’s AI conversation centers on two extremes: “total extinction, doomsday, machine overlord” versus “total utopia, post-scarcity, infinite productivity.” It likely will fall somewhere in between. To paraphrase the All-In Podcast team, there will be both pros and cons from AI, but “the ledger is stacked in favor of abundance rather than displacement.”
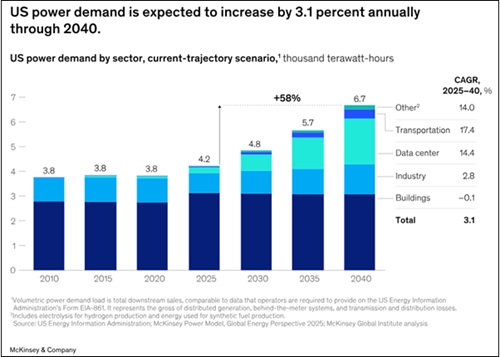
Still, President Trump is not sitting back to see how it shakes out (I mean, does he ever sit back and wait on anything for more than a few days?). Instead, he has been executing executive orders and bilateral deals, appropriating more than $3 trillion in capital (public and private) toward securing the physical foundation of AI, including critical minerals, chips, energy, and infrastructure. Indeed, surging datacenter power demand, as illustrated in the chart below from Katusa Research, is taxing our aging power grid, and it cannot be fulfilled by solar and wind—it requires dispatchable baseload power (i.e., reliable and always available on demand).
That means relying on natural gas in the near term and nuclear in the longer term (as I described in my special report, “The Future of Energy”)—or, if Elon has his way, it will come from orbital datacenters with collocated solar power generation (where unobstructed sunlight is abundant 24/7) that can be beamed back to Earth.
Tyler Flores of “Shortlysts” on Beehiiv observed, “The Trump administration announced $17.5 billion in conditional loans to jump-start a new wave of nuclear power construction across the United States. The funding will help utilities and energy companies purchase critical components needed to build large-scale nuclear reactors, including reactor vessels and steam generators that can take years to secure… According to the Department of Energy, the program could support up to five projects, with each site hosting two 1.1-GW Westinghouse AP1000 reactors. If fully utilized, the initiative would help advance the construction of 10 new reactors as the administration pursues its goal of having 10 large nuclear units under construction by 2030. Energy Secretary Chris Wright said the effort could accelerate that timeline by as much as three years… Federal officials say seven utilities have already expressed interest in participating.”
This push for nuclear power comes as electricity demand is expected to surge—and already has begun doing so—as illustrated in the chart below from a March 2026 report from McKinsey & Company. Already, the expansion of AI and associated datacenters is straining the power grid. The Trump Administration is seeking to reduce delays due to red tape for today’s much safer nuclear technologies, making nuclear energy projects more attractive to investors.
James Thorne of Wellington-Altus nicely summed up on X.com what I talk about regularly in my monthly post: “For years, the dominant corporate playbook was simple: keep capital expenditures lean, recycle excess cash into share buybacks, and let multiple expansion and shrinking share counts do the heavy lifting. Capex was treated as a drag; buybacks were hailed as shareholder discipline.” Indeed, back in 2017 during the first Trump Administration, the Tax Cuts and Jobs Act (TCJA) of 2017 slashed the corporate tax rate from 35% to 21%, but it was mostly used for investor-friendly share buybacks and enhanced dividends rather than expansion, capex, reshoring manufacturing, and new hiring.
Thorne goes on to say, “That framework is now colliding with a new political and strategic reality…a nation cannot remain prosperous, secure, and sovereign if it outsources the foundations of industrial power. That is also the logic of Trump’s America First economics. Reshoring supply chains, rebuilding manufacturing, expanding energy production, and accelerating permitting all push capital toward productive assets at home rather than paper gains on the balance sheet. The policy hierarchy is clear: national resilience, industrial capacity, and worker prosperity come before abstract efficiency…
“Trump has also long complained that buybacks reward executives more than workers. Whether one agrees with every formulation or not, the instinct captures something important about this moment. The old model favored balance-sheet management over capital formation. The emerging one rewards building…. The AI buildout makes the investment case obvious. Markets may punish rising capex and reduced buybacks, but that capital is not disappearing. It is moving into concrete, steel, copper, power, logistics, and machinery. The same is true of energy security, agricultural capacity, and domestic supply chains more broadly.”
It’s no wonder then that institutional investors are piling into the energy/power infrastructure that serves as the lifeblood for this secular trend in AI, which is reshaping the global economy. This includes the hard assets like pipeline operators, LNG terminals, processing facilities, grid assets, power plants, and the providers of gas turbines, fuel cells, closed-loop small modular nuclear reactors (SMRs), microreactors, Gen IV large-scale nuclear plants, fiber-optic cables, advanced battery storage systems. Also, industrial metals and critical minerals like copper, aluminum, silver, nickel, lead, zinc, titanium, lithium, cobalt, graphite, manganese, silicon, tungsten, gallium, germanium, platinum, scandium, iridium, palladium—plus of course the highly critical rare earth elements (REEs). These metals are used inside everything from your smartphone to an F-35 Lightning II fighter jet (watch this stunning video).
And yet China processes over 70% of these critical minerals. Brazil and Australia are two mineral-rich countries that might be able to help us bridge the gap and diversify supply chains.
On 7/1, Valar Atomics, one of 10 startups in the DOE's nuclear pilot program, in partnership with NVIDIA, commissioned the first AI datacenter powered by an SMR in Utah. The Ward 250 is a helium-cooled, TRISO-fueled, high-temperature gas microreactor. (Note: TRISO stands for TRIstructural-isotropic fuel, which is incapable of catastrophic meltdown in a reactor.) After achieving “criticality” on 6/18, the company successfully ascended to 10 KW of power, with output directly feeding a NVIDIA chip, and now the two companies are exploring a 30-MW, closed-loop-cooled (waterless, using circulating helium rather than massive amounts of evaporating water) datacenter powered exclusively by advanced nuclear energy. It was funded with a $450 million Series B round in April ($340 million in equity and $110 million in debt), implying an impressive $2 billion valuation—mostly due to speed, i.e., the technology’s ability to bypass custom site engineering in favor of a standardized supply chain and mass factory production (essentially treating the SMR like a smartphone or car).
Another high potential sector making a strong move is Healthcare, which should not be a surprise given its ability to capitalize on AI for drug, vaccine, and therapeutics development, including tailored precision medicine, genomics, and gene editing. Biotech in particular has been on fire, driven by favorable clinical trials, AI acceleration, and M&A optimism, and pulling the rest of the Healthcare sector along with it. The only surprise is that the move took so long to get going, finally breaking out of its sideways channel on 6/17, when many pundits had forecasted a good year for the sector at the start of the year. AI is turbocharging R&D by replacing years of trial-and-error with fast, data-driven workflows that can predict protein structures, design novel molecules, and simulate biological systems to optimize clinical trials.
Overall, I still think fundamental tailwinds outweigh headwinds such that stocks will resume their upward momentum based less on multiple expansion (i.e., rising forward P/E and PEG ratios) and more on:
1. Resilient consumer demand
2. Moderating event-driven supply chain disruptions and inflationary pressures, and a resumption in disinflationary trends
3. Lower interest rates, which would shore up housing, small business, and consumers
4. The OBBBA fully kicking in with its pro-growth policies like tax reform, deregulation, smaller government, and pro-energy protocols
5. Continued robust AI-driven capex and all its associated beneficiaries across industries, including expanding the electrical power grid
6. Diversification of global supply chains to avoid event-driven upsets
7. Reshored manufacturing, re-industrialization, and “duplicative excess domestic industrial capacity” (in the words of Treasury Secretary Scott Bessent) for both diversification and national security
8. Re-privatization and more efficient capital allocation and ROI than government programs
9. Strong growth in corporate margins, productivity, revenues, and earnings
10. Sufficient liquidity growth to sustain economic expansion, enhanced by the “shadow liquidity” of foreign capital flows into the US as well as rising velocity of money
However, a final resolution to the Iran conflict and supply shock (one way or another) could allow for some multiple expansion, with the S&P 500 potentially exceeding 8,000 by year end.
How is China impacted?
China, once the dominant exporter to the U.S., has slipped to fourth place behind Mexico, Canada, and now Taiwan, with exports to the U.S. down 29.9% in the first five months of 2026 compared to the same period last year. Accelerated demand for high tech equipment to fuel the massive AI investment stands out in the data with imports from Taiwan up 78.5% over the same period moving them a full 5 places higher from 8th to 3rd.
Geopolitical expert Peter Zeihan has been warning of China’s “house-of-cards economy” in a post-globalization world, as have I (like in this post of mine from 2023). Below are highlights of the several interconnected crises:
1. Demographic Collapse: China's population aging is accelerating faster than almost any other country, exacerbated by the long-term impacts of its One-Child Policy. The country is rapidly running out of the working-age population required to sustain its massive manufacturing base, which is pushing them to adopt automation and manufacturing.
2. Excessive Financial Leverage: Although its official government debt-to-GDP ratio is near 100%, this omits vast off-balance-sheet liabilities and state-owned enterprise obligations. Debt is rising while growth is slowing. China’s total debt-to-GDP ratio, excluding the financial sector, has doubled since 2010 and now tops 300% when factoring in the borrowing of households, non-financial corporations, and the broader public sector, with lots of regional off-balance-sheet borrowing.
3. Geographic Vulnerabilities: China lacks natural geographic integration; its internal river networks don't easily connect, making internal trade difficult. Furthermore, it relies on vulnerable coastal shipping routes that can be easily blockaded, and its population centers are deeply dependent on imported food and energy.
4. Economic Model Failure: China's entire mercantilist economic model relies on importing raw materials and energy while exporting finished goods to global consumers, largely in the Western Hemisphere. But as deglobalization, diversification of manufacturing and supply chains, and US reshoring and re-industrialization proceed—and if the US pulls back on its naval security for protecting shipping in the High Seas—China will lose reliable access to the foreign markets and resources its system depends upon.
In the words of economist Ed Yardeni, “Another factor explaining why oil prices never spiked as much as the closure of the Strait of Hormuz would historically have implied, and why they have since fallen so sharply, is the secular decline in Chinese crude oil demand. After three decades of near-uninterrupted growth, crude imports fell to just 4.6 million barrels per day in May, well below their 12-month average. Chinese demand was already being weighed down by rapid EV adoption, a prolonged property downturn, slower economic growth, and elevated oil inventories before the Middle East conflict. According to JPMorgan, China accounts for 74% of the recent decline in global crude imports.”
Taken together, a convergence of demographic collapse, excessive debt, a mercantilist export dependence, and a lack of secure international trade routes likely will cause the country to undergo severe economic desiccation, de-industrialization, and potential political fragmentation or collapse as a unified entity within the coming decade. This is why President Xi appears to be trying to consolidate power and purge his internal challengers. Although it seems that China always is able to come up with a band-aid to move forward, I still consider it a house-of-cards that should eventually collapse. Unfortunately, this would create great pain for our interconnected global economy.
Furthermore, according to Eric Peters of One River Capital, some long-time investors with deep knowledge of Asian markets believe China’s popular open-source AI models and emerging companies reflect deep inefficiencies such that the CCP likely will have to subsidize its losses, like it does for so many other industries (including EVs, solar, redundant refining, goods manufacturing, etc.). They have no equivalent to our powerhouse hyperscalers, so their models rely on US tech stacks. President Xi has big plans for AI and industrial development, but he may simply run out of money, particularly given that their secular decline in property prices has caused a depression in domestic consumption. This further opens the door for our friends in Taiwan, Korea, Singapore, and Hong Kong.
The SaaSpocalypse:
Despite having barely started to penetrate the global economy (particularly the highly regulated sectors like Financials and Healthcare), rapid advances in generative AI and autonomous AI agents have forced investors to rethink the long-term value of many traditional Software-as-a-Service (SaaS) companies. The concern is not that software demand will disappear, but that AI will increasingly perform many of the routine tasks once handled through dedicated applications. As a result, investors have become far more selective, rewarding companies with proprietary data, mission-critical workflows, and durable competitive advantages while compressing the valuations of businesses whose products are easier to replicate or displace with AI.
But rather than signaling the end of SaaS, this shift marks the beginning of a new phase in enterprise software. The winners are likely to be companies that successfully embed AI into their platforms, employ internal AI automation to reduce R&D costs, leverage proprietary enterprise data that startups can’t easily replicate, and deepen customer relationships. A successful transition could support margin expansion, growing free cash flow, and continued buybacks despite the disruption. On the other hand, weaker, undifferentiated vendors face growing competitive pressure and industry consolidation. Much like the transition from onsite software to the cloud ultimately produced a new generation of market leaders, the AI era is expected not to eliminate but to reshape the software industry, creating both risks and investment opportunities.
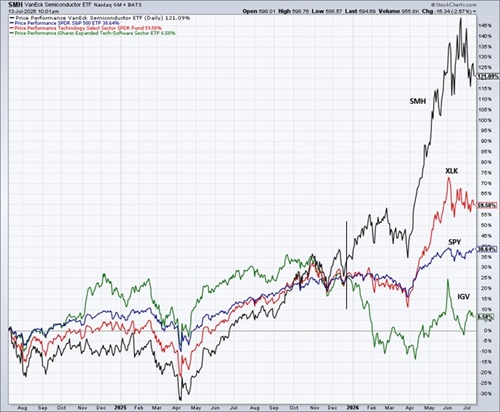
The 2-year chart below illustrates the massive performance divergence that began in late December (as marked)—and perhaps how AI-depressed software companies may be building a base and setting up for a rebound. Leaders in a software recovery might include Oracle (ORCL), Microsoft (MSFT), Snowflake (SNOW), Salesforce (CRM), ServiceNow (NOW), Crowdstrike (CRWD), Palantir (PLTR), AppLovin (APP), and Zscaler (ZS). (Check scores) Another way to play the rebound is through an ETF, such as iShares Expanded Tech-Software (IGV) or SPDR S&P Software & Services (XSW).
Global liquidity concerns:
One overarching concern about the health of the bull market is global liquidity growth, particularly when compared to the accommodative monetary policies and strong liquidity growth of the past 10 years. Liquidity matters because it provides the fuel that supports spending, investment, and risk-taking behavior throughout the economy. For now, measures of corporate and household cash relative to GDP have declined significantly, even as equity markets continue to advance. But historically, contracting liquidity has coincided with increased market volatility and weaker performance in risk assets. Economist and liquidity expert Michael Howell of CrossBorder Capital has asserted that “Market bubbles rarely end simply because valuations are high. They usually break when liquidity, funding conditions, leverage or collateral markets become unstable.”
For example, the squeeze could come from one or a combination of things like: 1) Fed rate hikes and balance sheet reduction, 2) China being forced to reduce its internal liquidity injections that have supported the yuan, 3) monetary tightening from the Bank of Japan that leads to an unwinding of the yen carry trade, 4) other forms of deleveraging, margin calls, and automated liquidations, 5) a surge in sovereign debt issuance to fund greater deficit spending that soaks up liquidity, 6) rising bond market volatility, or 7) a surging US dollar from any macro “flight to safety” or spike in oil prices (which creates both increased demand for the petrodollar to settle trades as well as a surge in inflation leading to central bank tightening).
But for now, the CBOE Volatility Index (VIX), sector correlations, S&P implied correlation, and credit spreads are all quite low, suggesting worry-free trading (aka complacency)—which forces volatility-controlled algo strategies to mechanically take on risk. This is despite elevated longer-term Treasury yields, which are likely driven more by hawkish signals from the Fed than from any actual concerns about structural inflation. Indeed, moderating event-driven supply chain disruptions and a resumption in disinflationary secular trends promise to help inflation metrics recede. All of this means that individual sectors, industries, and stocks are generally trading on their own fundamentals and technicals, rather than broad risk-on/risk-off behavior, which is healthy. Some would consider this to be a contrarian signal of impending market weakness, but I think it would take a significant macro catalyst to trigger a steep correction—including certain frightening events that I shudder to say out loud.
GDP, inflation, and interest rates:
The BEA reported Q1 2026 Real GDP increased at an annual rate of +2.1%, and looking ahead to Q2, the Atlanta Fed’s GDPNow forecast expects just +1.3%. But according to economist Ed Yardeni, the forecast is misleading due to expected net exports (i.e., exports minus imports), dragging down Q2 forecast the by 1.3 percentage points, as AI-related imports sharply increased even faster than the large increase in exports of crude oil and petroleum products. Below the headline GDP number, real final sales to private domestic purchasers, which strips out volatile trade and inventory metrics, is tracking at 2.9%, up from 1.7% in Q1; consumer spending growth is tracking at 2.0%, up from just 0.5% in Q1; and business fixed investment is running at an impressive 8.2%, up from 6.5% in Q1.
Bank of America recently revised its global GDP growth projections higher, reaching +3.2% for CY 2026 and +3.5% in 2027, citing the accelerating pace of AI investment across major economies.
The ISM Manufacturing Index came in at 53.3 in June, continuing to display expansion for the 6th straight month and reflecting the AI buildout, reshoring, and reindustrialization, given favorable business tax incentives under the OBBBA, like bonus capex depreciation. ISM Non-Manufacturing (Services) came in at 54.0 in June, marking 24 straight months of expansion, with the business activity and new orders indexes also up 12 straight months and the employment component swinging back into expansion mode at 51.2.
On the other hand, the June jobs report was ugly. After a stellar May report with upward revisions to prior months, June saw a miss on new jobs, and even worse, downward revisions to April and May. And yet the unemployment rate fell to 4.2%—because the labor force participation fell to just 61.5%. Also, ADP reported just 98,000 new private-sector jobs last month, down from 122,000 in May, with about half of gains in education and health services, which are largely government subsidized.
This week brings the CPI and PPI readings for June, following May’s readings of PPI +6.42%, CPI +4.17%, Core CPI +2.82%, and Core PCE +3.41%, and Kevin Warsh’s preferred Trimmed Mean PCE +2.78%. I discussed the complete set of May metrics and the encouraging trends they are displaying in a recent post. Notably, the latest real-time, blockchain-based, daily Truflation CPI metric shows just +1.93% YoY, as of 7/13. And the Cleveland Fed's Inflation Nowcasting projects that June's headline CPI should fall to +3.92%, and Core CPI and Core PCE stable at +2.85% and +3.43%, respectively—and with some further moderation expected in July.
Broad GDP growth has been mostly by AI-related capex spend, while broad segments of the economy—including lower-income/working-class consumers, small businesses, and housing—are struggling. Inflation has likely seen its peak. I continue to pound the table on the idea that we need rate cuts (not hikes!) and a more dovish bias in Fed monetary policy. Again, I believe elevated bond yields are likely being driven more by hawkish Fed talk about inflation than from any real concern about structural inflation getting embedded into the economy.
The US dollar has strengthened significantly this year and continues to make new 52-week highs against the euro and yen. This trend may continue under new Fed chair Warsh’s commitment to price stability. For us here at home, a strong dollar is disinflationary by increasing American purchasing power for imports. However, it also makes US exports more expensive overseas, pressuring the revenues of our large, multinational companies as foreign earnings in weaker local currencies are worth less when translated back into dollars. For our trading partners abroad, making payments on their dollar-denominated debt is more costly, as their earnings don’t buy as many dollars, acting much like an interest rate hike. Also, foreign capital tends to flow even more strongly into a strengthening dollar, like the oft-discussed yen carry trade (short yen, long dollar and US assets), which further reduces global liquidity and redirects even more capital out of foreign markets and into the US—in addition to the longstanding preference of foreign direct investment (FDI) to seek.
The dollar tends to get stronger in foreign exchange markets when: 1) US economic growth outpaces other developed markets, 2) the Fed tightens policy by pausing rate cuts, or 3) geopolitical concerns driven global investors into the safety of the US dollar and Treasuries. Sectors that benefit are those that have relatively limited forex risk, like domestically focused small caps and value stocks (like industrials and energy equipment & services companies) rather than large multinationals. Also, the major goods importers (like retailers and distributors) have increased purchasing power, which lowers their import costs and improves margins.
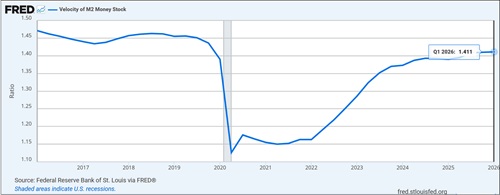
A stable or firmer dollar slows global liquidity growth, which inhibits global economic growth. But this has been partially offset by rising velocity of money (the number of transactions per dollar in circulation), which in the US is at its highest level since Q4 2019 and gradually rising, as shown in the chart below from the St. Louis Fed.
Also, the US has benefited from foreign capital inflows, the majority of which does not show up in our M2 money supply thus creating “shadow liquidity” that has helped inflate our capital markets—albeit at the expense of the rest of world (ROW). As inflation eases and central banks are more willing to cut interest rates, the US and select emerging markets (like India, Taiwan, South Korea, Philippines, Vietnam) will continue to drive global economic activity while Europe and China (among others) struggle to reinvigorate growth.
Final comments: Stanching the socialist wave
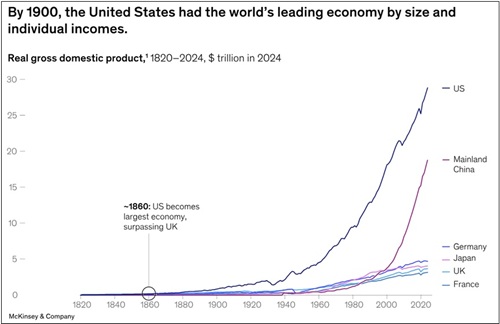
According to that March 2026 report from McKinsey I mentioned earlier, “At 250 years old, the United States is the world’s most competitive economy. [With just 4% of the global population], it generates 26% of global GDP and is home to 59 of the world’s [largest] 100 firms. In the past several years, accelerating US productivity growth and announced foreign direct investment inflows have sharpened its edge over other advanced economies.” Just look at the chart below comparing historical GDP growth among the largest economies of the world. The US went parabolic following WWII and the 1944 Bretton Woods Agreement (establishing the US dollar as the world's reserve currency), while China began to surge following Deng’s reform policies in 1978 and then went parabolic following its admittance into the WTO in 2001.
And yet, perhaps partly due to the extreme in consumer pessimism, we are seeing stunning momentum for the suddenly relevant Democratic Socialists of America (DSA), an openly subversive organization admittedly using the Democrat Party as a Trojan Horse to get on the ballot, take over the party, and ultimately to “overthrow our empire and tear it down from within” (their own words), in an unholy alliance with Islamists, and remake the country into some naive fantasy of a utopian society in which national borders, prisons, and police don’t exist, and the means of production and private property (as opposed to personal property) are confiscated and owned by the government (e.g., “social housing”).
I recently saw a video of a Muslim community leader in London say, “We’re not here to take part, we’re here to take over.” And that’s precisely the same sentiment of the DSA. Mainstream Democrats are welcoming DSA under their “Big Tent” in the belief it can help them take back control of Congress from Republicans, but DSA openly sneers at mainstream Democrats and wants to force them out of the party once they take control.
In their utopia, there are no ultra-wealthy, all necessary services and healthcare are free to all, and high tax rates are not punitive but rather something we should consider an “investment” that builds a safer, healthier, more educated, and more equitable society—enforcing roughly equal outcomes and living standards, as opposed to just a level playing field on which to compete.
So, allow me a moment to bring us back to reality.
Our two main political parties no longer offer two differ versions of Western capitalism. Unlike the moderate era of Bill Clinton in the 1990s characterized by “Third-Way Politics” and “triangulation” between the Left and Right, if you vote Democrat today you are increasingly voting for an entirely different system of government, trade, and international relations based on socialist principles, collectivism, and DEI rather than the American foundational principles of free enterprise, individualism, and meritocracy. As we have seen time and time again, socialism has failed (often miserably and disastrously) everywhere it has been tried.
To be sure, humans are inherently flawed, self-serving, and tribal. None of us is beyond reproach. We are all capable of prejudgment and intolerance. And so, we all must make a concerted effort to do better in our interactions with others. This country has made great strides in this way, and in fact most Americans want to be good towards others. But we don’t want to work hard to create value and accumulate wealth and then see much (if not most) of it confiscated by a bloated government for the “common good” for public programs that are rife with fraud, waste, and inefficiencies (however well-intentioned they might have started out to be). Socialism, communism, collectivism all require that its citizens prioritize the common good, even though it is not in our nature to do so—we all tend to give preference to our family, our friends, our “tribe.” This is why the Marxist maxim, “From each according to his ability, to each according to his need” must be coerced.
On the other hand, capitalism provides a path to shared societal success that is both the most efficient and the most moral, even as individuals pursue their own self-interest. It’s because sustained success in a free society necessitates win-win transactions between a willing buyer and a willing seller, or a willing employer and a willing employee. No overt altruism, empathy, or government intervention (or coercion) is required for a highly functional and thriving society. Government’s role is simply to protect individual liberty, safety, free speech, property rights, and the rule of law.
As Ronald Reagan once said, “[Our founders] brought to all mankind for the first time the concept that man was born free, that each of us has inalienable rights, ours by the grace of God, and that government was created by us for our convenience, having only the powers that we choose to give it.” Anyone, including legal immigrants, is free to come up with an idea, raise capital, and start a business, with no government-imposed limits on how much you can earn. As Paul Meany of the Cato Institute wrote, “No one crosses an ocean, leaves behind family, and begins again in a foreign country because they dream of being managed by a socialist bureaucracy. They come because America has promised something radically different: a free society in which talent, work, risk, and ambition can translate into a better life. The free market does not guarantee success, but it makes success possible without requiring permission from the state.” Birth does not determine destiny. If you can provide value to society, you will be rewarded.
Today’s focus on wealth inequality in our capitalist system is largely a red herring as more people continue to be lifted out of poverty and standards of living are rising across the board—i.e., the economic “pie” grows faster than inflation and allows each “slice of the pie” to grow larger. Of course, more can be done to allow the lower income and working classes to enjoy more of the spoils of our country’s successes and rising aggregate wealth (i.e., the speed at which each slice grows). But that doesn’t mean we should dismantle the very system that has created so much innovation, value, wealth, comfort, and good for this country and the world.
Tax cuts, deregulation, and incentives for investment encourage more work, savings, entrepreneurship, ROI, and capital formation, increasing the supply of goods and services by expanding productive capacity. As output rises, the economic “pie” grows without necessarily causing inflation. In contrast, socialists see the economy as a fixed “pie” that the rich are hoarding to themselves in a zero-sum game, so they demand punitive, growth-stunting taxation (up to 75% top marginal rates), national policies that prevent interstate capital flight, confiscation of private property, and redistribution of income—all of which simply shifts purchasing power from one group, i.e., the rich “oppressor” or bourgeoisie, to another group, i.e., the marginalized “oppressed” or proletariat—or more specifically, to the “benevolent” government that controls the bloated budgets and expanded, low-ROI entitlement programs of the growing Nanny State. Doing so may change demand and consumption patterns, but by itself it does not increase productive capacity; instead it reduces incentives to invest, innovate, and work, slowing long-term economic growth to the detriment of us all.
In the immortal words of former UK Prime Minister Margaret Thatcher back in 1976, "The problem with socialism is that you eventually run out of other people's money." She believed it destroys individual liberty, stifles innovation and wealth creation, and inevitably leads to economic ruin. Similarly, Friedrich Hayek of the Austrian School of Economics said, “If you agree to give up your liberty in exchange for the promise of prosperity, history shows you end up with neither liberty nor prosperity.” And Ayn Rand once wrote, “There is no difference between Communism and Socialism except in the same ultimate end: Communism enslaves men by force, Socialism by vote. It is like the difference between murder and suicide.”
According to NYC Mayor Zohran Mamdani, “We will replace the frigidity of rugged individualism with the warmth of collectivism.” And history shows that pursuing this utopian goal of “equality” means that everyone’s standard of living is brought down to the lowest common denominator. Sounds great, right? Just remember to set your summer A/C thermostat to 78 degrees so we can all be uncomfortable together. I guess that’s just part of the “warmth of collectivism.”
Notably, Claire Valdez is a DSA candidate who just won the Democrat primary in the deep-blue New York 7th congressional district, making her essentially a lock to win the general election in November. Notably, she won the more educated/wealthy precincts by around 35 percentage points and won among younger residents by 32 points…but she lost the majority-Hispanic precincts by 20 points, low-income precincts by 32 points, and majority-black precincts by a whopping 50 points. It’s shocking that the actual “marginalized” demographics rejected her, but she was buoyed by the young, white, and highly educated. Go figure.
It is infuriating to me to see affluent, middle-aged white people who profited nicely in our capitalist system, or their children who are new college graduates, suddenly advocating to dismantle it all (out of white-guilt or virtue signaling?). Or to see recent immigrants who fled oppressive socialist or theocratic regimes in search of opportunity, then realized that they don’t have the necessary education, skills, drive, industriousness, gumption, and/or grit to effectively compete and succeed in our society, so they vote for (or protest on behalf of) the same oppressive, parasitic policies from which they fled. Similarly, I see transplants from mismanaged US states vote in their new state for the same types of candidates and policies that made them flee those other states in the first place. It’s the very definition of insanity.
It seems to me that these new radicals leading a mini-wave of anti-American socialism (in the mold of Bernie Sanders) in some of the bluest cities and congressional districts are driven by six of Christianity’s Seven Deadly Sins—specifically:
1) pride (they are intelligent but largely unaccomplished “thinkers” and “ruminators” who are resentful that society doesn’t sufficiently value or reward their perceived self-worth; most being either lifelong students, professors, bureaucrats, activists, community organizers, or otherwise never having invented a product, built a business, or even held a job in the for-profit private sector)
2) envy (they believe successful entrepreneurs don’t deserve the spoils of their achievements and the risks they were willing to take, and resent their “rugged individualism”)
3) greed (like parasites, they feed on capitalist success by confiscating much of the wealth created by entrepreneurs, as if there is a fixed economic “pie” that the rich are hoarding)
4) wrath (emanating from their hurt pride, envy, and greed)
5) sloth (they prefer confiscation and redistribution over self-reliance, personal responsibility, industriousness, risk-taking, and value creation)
6) lust (for power, control, domination, and equity).
The last of the seven sins, gluttony, is the only one that might not apply here.
These aggrieved “takers” from society—focused on exacting money from the entrepreneurs, builders, producers, and “makers” to fund an ever-growing welfare state—is not taking anyone on a path to prosperity. In fact, it is quite the opposite. As an example, Florida, with a population of 23.7 million, operates a very successful economy and school system on a budget of $117 billion. Compare this to New York with a smaller state population of 20.0 million, which has a struggling economy and school system on a gigantic budget of $268 billion. New York City alone has a budget of $125 billion (including a $12 billion deficit) to serve a population of just 8.5 million. New York spends $36k/yr per student, double the national average, and $81k/yr per homeless person—compared to the median national income per capita of $45k and mean income of $66k.
Again, ultimately, socialism/collectivism only brings everyone down to the lowest common denominator of wealth and success. More money does not translate into better outcomes. It takes freedom, a strong work ethic, proper incentives, merit-based rewards, and high-ROI capital allocation, which an unleashed private sector is infinitely better at than Big Government (as I write about regularly). Indeed, history has proven time and again that the socialist welfare state like that espoused by the DSA suppresses freedom and individual liberty, removes the incentive structures for striving and achieving, and destroys the free-market mechanisms required to generate wealth—ultimately leading to widespread poverty and greater state coercion. For instance, after embracing a number of socialist policies, the UK’s GDP per capita today is lower than every US state.
Meanwhile, many Central and South American countries have had enough of their socialist experiments. Their citizens are increasingly voting for more conservative governance after years of failed big-government socialist tyranny, including places like Argentina, Chile, Bolivia, Colombia, Panama, El Salvador, and Peru—as well as Venezuela, although it has not yet transitioned to the conservative government it elected in 2024. Cuba might be next. Driven by public frustration over hyper-inflation, insecurity, corruption, and unfulfilled promises, voters across the region have embraced a wave of pro-market and nationalist politicians, while many here in the US seem bent on going the opposite direction—and learning this hard lesson on our own.
Outspoken Democrat-turned-Independent Alex Karp, CEO of Palantir, inveighed against Mayor Mamdani and the calamitous socialist agenda, “It’s time for [other CEOs] to speak up. Obviously, somebody who has no work experience ever, who has views that have never worked, should not be put in charge of the most important enterprise of its kind in the world—meaning New York City… We all have to become individual participants in creating our own destiny. Because the people who have the job of protecting your destiny are home asleep or imbibing an ideology that doesn’t work.” Well, I might not have Alex Karp’s level of CEO platform, but I’m speaking up here.
Lastly, in honor of our country’s 250th anniversary, and in light of the upcoming midterm elections, I’d like once again share a message from The Rational Optimist Society on Substack, which believes human progress and innovation consistently improve living standards. “Freedom leads to innovation and innovation leads to prosperity for all. People around the world are now wealthier, healthier, less violent, better fed, safer, and more literate than ever… But too many have forgotten what got us here. Prosperity is no accident. Its enemies—alarmism, ideology, and bureaucracy—are on the rise. We must defend our values, or risk slipping back into darkness and stagnation. Our near future will be incandescently bright, as long as we fight for it …[and] a better world is not only possible, but probable, as long as we celebrate and prioritize what’s brought us this far: freedom, innovation, science, and reason.”
Co-founder of the Rational Optimist Society Stephen McBride recently wrote a post in honor of America’s 250th anniversary, “America, You Saved My Life: A love letter from a Dublin kid.” It is a brief but inspiring essay about how most of the world’s amazing progress over the past 250 years originated in the USA and describes his “five frontiers” of life-sustaining/improving innovation today driven by American entrepreneurs.
Gain access to Sabrient’s proven models:
You can learn more about Sabrient’s process-driven, growth-at-a-reasonable-price active-selection methodology as revealed by Sabrient founder and former NASA engineer (Apollo Program) David Brown in his new book, Moon Rocks to Power Stocks: Proven Stock Picking Method Revealed by NASA Scientist Turned Portfolio Manager. You also get two Bonus Reports on the history and new opportunities for 1) Energy and 2) Space Exploration, including our top stock picks for each—all in PDF format. [Note: David’s book is also available in both paperback and eBook formats on Amazon (an international bestseller!).] The book teaches how to methodically and strategically build wealth in the stock market for four distinct investing styles—growth, value, dividend, and small cap.

Or if you just want to find out how to access the Sabrient Scorecard, an investor tool that provides access to our proprietary scores for all stocks to make the stock evaluation process easy for idea generation and portfolio monitoring, along with our Top 30 stocks each week for 4 distinct investing strategies—Growth, Value, Dividend, and Small Cap—I welcome you to visit: https://www.moonrockstopowerstocks.com/sabrient-scorecard
Latest Sector Rankings
Relative sector rankings are based on Sabrient’s proprietary SectorCast model, which builds a composite profile for each of over 1,500 equity ETFs based on bottom-up aggregate scoring of the constituent stocks. The Outlook Score is a Growth at a Reasonable Price (GARP) model that employs a forward-looking, fundamentals-based multifactor algorithm considering forward valuation, historical and projected earnings growth, the dynamics of Wall Street analysts’ consensus earnings estimates and recent revisions (up or down), quality and sustainability of reported earnings, and various return ratios. It helps us predict relative performance over the next 3-6 months.
In addition, SectorCast computes a Bull Score and Bear Score for each ETF based on recent price behavior of the constituent stocks on particularly strong and weak market days. A high Bull score indicates that stocks held by the ETF recently have tended toward relative outperformance when the market is strong, while a high Bear score indicates that stocks within the ETF have tended to hold up relatively well (i.e., safe havens) when the market is weak. Outlook score is forward-looking while Bull and Bear are backward-looking.
As a group, these three scores can be helpful for positioning a portfolio for a given set of anticipated market conditions. Of course, each ETF holds a unique portfolio of stocks and position weights, so the sectors represented will score differently depending upon which set of ETFs is used. We use the iShares that represent the ten major U.S. business sectors: Financials (IYF), Technology (IYW), Industrials (IYJ), Healthcare (IYH), Consumer Staples (IYK), Consumer Discretionary (IYC), Energy (IYE), Basic Materials (IYM), Telecommunications (IYZ), and Utilities (IDU). Whereas the Select Sector SPDRs only contain stocks from the S&P 500 large cap index, I prefer the iShares for their larger universe and broader diversity.
The table below shows the latest fundamentals-based Outlook rankings and our full sector rotation model:
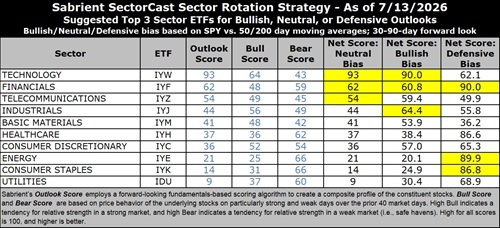
The latest rankings display a bullish bias, in my view, given that cyclicals and secular growth sectors dominate the top of rankings, and defensive sectors are at the bottom. Next 12 months (NTM) analyst earnings forecasts still look quite strong for most sectors, and investors seem optimistic that impacts from the Iran conflict and shipping blockade are either shrinking or being effectively worked around. Only Consumer Staples and Energy have seen reduced EPS estimates. Expected CY2026 EPS growth over CY2025 for the S&P 500 in aggregate is +21.6%. And the S&P MidCap 400 and S&P SmallCap 600 forward earnings have climbed to new record highs along with the S&P 500.
Technology (dominated by the mega-cap Big Tech titans and AI-driven highflyers) remains firmly at the top with a robust Outlook score of 93, reflecting the high quality of those juggernauts despite having the highest forward P/E at 28.0x, which is well below the 31x multiple it reached last fall. Moreover, the consensus NTM EPS growth estimate of +26.7% is rising faster than price, such that the forward PEG (ratio of P/E to EPS growth) for Tech is a modest 1.05. Tech also displays strongly positive sell-side analyst earnings revisions and by far the highest profit margins, return ratios, and insider buying. Keep in mind, investors tend to be quite willing to pay up for strong growth.
Because many Tech stocks are riding secular growth trends (i.e., little cyclicality), no other sector comes close to the consistent sales growth, margins, operating leverage, and ROI. And Tech not only benefits from its own product development and productivity gains, but those products help other companies with their product development, product delivery, and productivity—so Tech benefits also by helping all sectors grow and prosper. The main concern right now is whether spending of over 100% of hyperscalers’ massive cash flow on capex will generate sufficient ROI in the near term to placate investors.
Others with low forward PEGs include Energy (0.98), Basic Materials (0.96), and Financials (1.16). As for forward P/Es, Energy (11.7x) and Financials (14.6x) are by far the lowest.
After Tech, the next six sectors are Financials, Telecom, Industrials, Basic Materials, Healthcare, and Consumer Discretionary. At the bottom of the rankings are noncyclical defensive sectors Utilities and Consumer Staples. These two sectors have the lowest forward EPS growth rates (the only ones in single digits), among the lowest consensus analyst revisions to EPS estimates, and the least insider buying.
Keep in mind, the Outlook Rank does not include timing, momentum, or relative strength factors, but rather reflects the consensus fundamental expectations at a given point in time for individual stocks, aggregated by sector.
To learn more about how you can access our weekly Stock and ETF Scorecards, please visit:
https://www.moonrockstopowerstocks.com/sabrient-scorecard
Sector Rotation Model and ETF Ideas
Our rules-based Sector Rotation model, which appropriately weights Outlook, Bull, and Bear scores in accordance with the overall market’s prevailing trend (bullish, neutral, or defensive), switched from a defensive to a bullish bias when the S&P 500 leapt above both its 50-day and 200-day moving averages simultaneously in early April. The 50-day was tested multiple times in June, and actually closed below it one day on 6/26 but then quickly regained it the next day. (Note: In this model, we consider the bias to be bullish from a rules-based trend-following standpoint when SPY is above both its 50-day and 200-day simple moving averages, but neutral if it is between those SMAs while searching for direction, and defensive if below both SMAs.)
As highlighted in the table above, the Sector Rotation model suggests holding Technology (IYW), Industrials (IYJ), and Financials (IYF), in that order. Or, if you prefer to take a neutral stance, it suggests holding Technology, Financials, and Telecom (IYZ). However, if you prefer a defensive stance, it suggests holding Financials, Energy (IYE), and Consumer Staples (IYK), with Healthcare (IYH) close behind.
Here is an assortment of other interesting ETFs that are scoring well in our latest rankings: Aztlan Global Stock Selection DM SMID (AZTD), Columbia Select Technology (SEMI), Technology Trusector (TRUT), iShares MSCI Gold Silver and Metals Miners (SLVP), Invesco Dorsey Wright Technology Momentum (PTF), iShares US Tech Independence Focused (IETC), AXS Esoterica NextG Economy (WUGI), SP Funds S&P Global Technology (SPTE) VanEck Junior Gold Miners (GDXJ), iShares AI Innovation and Tech Active (BAI), Sprott Active Metals & Miners (METL), CapForce IBD 50 (FFTY), iShares Future AI & Tech (ARTY), QRAFT AI-Enhanced US Large Cap Momentum (AMOM), Global X PureCap MSCI InfoTech (GXPT), SonicShares Global Shipping (BOAT), Invesco S&P MidCap Quality (XMHQ), REX FANG & Innovation Equity Premium Income (FEPI), Alger Concentrated Equity Fund (CNEQ), Alger AI Enablers & Adopters (ALAI), AdvisorShares Hotel (BEDZ), First Trust Bloomberg Artificial Intelligence (FAI), Hartford Alpha Capture Growth (ACGO), and First Trust Active Factor Small Cap (AFSM). All score in the top decile (90-100) of Sabrient’s Outlook scores.
As always, I welcome your thoughts on this article! Please email me anytime. Any and all feedback is appreciated. Also, please let me know of your interest in any of Sabrient’s new indexes for ETF investing, such as High-Quality Energy, High-Quality Healthcare, Defensive Equity, High-Quality SMID Growth, High-Quality Growth & Income, and High-Quality Value, as well as the actively managed Space Exploration & Off-Earth Sustainability and Sabrient Select High-Conviction Portfolio (similar to our Baker’s Dozen portfolio, but larger). Visit Sabrient.com for more information on the six passive indexes.
IMPORTANT NOTE: I post this information periodically as a free look inside some of our institutional research and as a source of some trading ideas for your own further investigation. It is not intended to be traded directly as a rules-based strategy in a real money portfolio. I am simply showing what a sector rotation model might suggest if a given portfolio was due for a rebalance, and I do not update the information on a regular schedule or on technical triggers. There are many ways for a client to trade such a strategy, including monthly or quarterly rebalancing, perhaps with interim adjustments to the bullish/neutral/defensive bias when warranted, but not necessarily on the days that I happen to post this article. The enhanced strategy seeks higher returns by employing individual stocks (or stock options) that are also highly ranked, but this introduces greater risks and volatility. I do not track performance of the ideas mentioned here as a managed portfolio.
Disclosure: At the time of this writing, of the securities mentioned, the author held positions in SPY, FTLS, MU, bitcoin, silver, and gold.
Disclaimer: Opinions expressed are the author’s alone and do not necessarily reflect the views of Sabrient. This newsletter is published solely for informational purposes only. It is neither a solicitation to buy nor an offer to sell securities. It is not intended as investment advice and should not be used as the basis for any investment decision. Individuals should consider their personal financial circumstances in acting on any opinions, commentary, rankings, or stock selections provided by Sabrient Systems. Sabrient makes no representation that the techniques used in its rankings or analyses will result in profits. Trading involves risk, including possible loss of principal and other losses, and past performance is no guarantee of future results. Investment returns will fluctuate, and principal value may either rise or fall. Sabrient disclaims liability for damages of any sort (including lost profits) arising from the use of or inability to use its rankings or analyses. Information contained herein reflects our judgment or interpretation at the time of publication and is subject to change without notice.
Copyright © 2026 Sabrient Systems, LLC. All rights reserved.