Scott Martindale


  by Scott Martindale
  CEO, Sabrient Systems LLC
 

Quick note 1: Sabrient’s Q3 2026 Baker’s Dozen portfolio (13 top picks) will launch on 10/20. On that day, our Q2 2025 Baker’s Dozen will terminate, and it is up +37.2% gross total return vs. +24.4% for SPY as of 10/2. Also, our quarterly Small Cap Growth 52 portfolio launched on 9/15, with a mix of 44 small-cap stocks across 9 business sectors. SCG 47 terminates on 10/16 and is up +38.9% vs. +22.5% for S&P 600 Small Cap Growth (SLYG) as of 10/2. It followed the launch of Sabrient’s annual Forward Looking Value 14 portfolio on 8/26, having a diverse mix of 31 stocks across 9 business sectors and a large/SMID-cap mix. Last year’s FLV 13 terminates on 11/17 and is up +35.7% vs. +16.3% for S&P 500 Value (SPYV) and +21.2% for S&P 500 (SPY) as of 10/2.

Quick note 2: I was recently a guest on the “Biz Wiz” podcast to tell my humble career story from engineering school to the oil industry to investment research and eventually CEO of Sabrient Systems. Key takeaway from the 30-minute discussion is that an entrepreneurial mindset means adaptability, resilience, focusing on high-potential projects, avoiding rabbit holes, responding to customer needs, creating and scaling value, and advocating for yourself and your ideas. I’d love to hear your impressions!

Overview:

September saw the convergence of several big issues for investors, including: 1) oil price (WTI) and the diesel crack spread both surging above the $100 mark, 2) soaring bond yields and bond volatility (with the 10-year Treasury hitting 5.35%, its highest since 2002, and 30-year mortgages hitting 7.28%), 3) the first Fed rate hike since July 2023, and 4) sudden apocalyptic warnings that unbridled AI could “kill us all by the end of the decade.” And on top of it all, companies and funds with “AI” in their name may to have change it to “SI” (for super intelligence), at least according to our president. The bond market (and the so-called “bond vigilantes”) drove up longer-term rates too rapidly, and so the Fed seems to have decided it had to react to what the market was reflecting—even though jobs and wage growth are stagnant while core inflation is moderating.

Alas, after a one-day pullback, yields surged higher anyway. But I think this is simply a “blowoff top” that will soon put a cap on the 10-year, which suggests to me a buying opportunity for longer duration bonds. Just as the adage about inflation says, “the cure for high prices is high prices,” suggesting a self-correcting loop, similarly the cure for high yields is high yields, meaning that the guaranteed return of bonds becomes increasingly competitive with more-volatile equity returns, attracting demand. I also think oil prices have seen their highs given all the effective workarounds, which should further reduce inflationary pressures and help cap bond yields.

Regardless, I believe the Fed’s hawkishness is a policy mistake given our bifurcated K-shaped economy. We have soaring corporate profits and stock prices juxtaposed with stagnant labor and housing markets, negative real wage growth, a low personal saving rate, and surging high-yield spreads—not to mention softening core inflation and underlying structural disinflationary trends.

In my comprehensive commentary below, I discuss:

1. The sudden AI panic is just the latest in a long lineage of imminent existential doomerism
2. Bureaucrats blunder into the AI fray
3. Stock valuations and bond yields
4. National debt and de-dollarization debate
5. The “debasement trade”
6. Jobs, inflation, and the K-shaped economy
7. My Final Comments essay: Time to vote!
8. Sabrient’s sector rankings, positioning of our sector rotation model, and some top-ranked ETF ideas

The healthy improvement in market breadth we saw for much of the year ended in mid-August, at which time bitcoin surged, the S&P 500 went sideways, the Nasdaq 100 consolidated gains and then surged to new highs, while the equal-weight S&P 500 (RSP), mid-cap S&P 400 (MDY), and small-cap Russell 2000 (IWM) all sold off. And of course, all of September saw a surge in yields—which is correlated with the selloff in all those non-Tech, interest-rate-sensitive stocks.

It seems that the FOMC saw rising yields as a supply problem at its July meeting but a demand problem today. By that I mean a supply-driven rise in yields reflects global supply shocks that raise inflation and weaken economic growth, whereas a demand-driven rise in yields reflects stronger-than-expected economic activity such that markets expect the Fed to keep rates higher-for-longer and thus are demanding more term premium.

The Fed's earlier patience assumed the supply/energy shock would soon fade. But with relentless AI/SI spending driving strong demand, the supply/energy problem became a demand problem in the eyes of the FOMC. And when all you have is a hammer, every problem looks like a nail—thus the rate hike. Fed chair Kevin Warsh said, “Our decision comes at a time when the American economy appears to be strengthening. New hiring, private-sector earnings, business capital investment. Each of these markers has improved in recent months and is pointing in a good direction. Credit flows have been robust, particularly for businesses.”

Indeed, on 9/11, the Fed announced that US national household net worth surged to over $195.9 trillion in Q2 (604% of GDP), primarily driven by capital gains on stocks. Q2 saw the 11th straight quarterly increase and the largest in history at $12.8 trillion—which amazingly exceeds the total annual GDP of every country in the world except the US ($32.4 trillion) and China ($20.8 trillion) as well as the aggregate GDP of the EU ($23.0 trillion, led by Germany’s $5.4 trillion). It’s the 11th consecutive quarterly rise, and the current number is 2x our household wealth since 2020. In addition, the ratio of net worth to disposable personal income (DPI), a measure of households’ potential to finance consumption out of their wealth, reached a record high of 8.3x in Q2.

As for inflation, Trimmed Mean PCE inflation, Core CPI, all the 3-month annualized trends, the 5-year breakeven, and real-time, blockchain-based Truflation all put underlying inflation much closer to (or even below) the Fed’s 2.0% target, as I detail below. Once the energy/supply shock resolves, the structural disinflationary trends should take control once again, e.g., aging demographics, slowing global population growth, accelerating disruptive innovation, automation, rising productivity, and re-globalization of supply chains (“excess productive capacity”).

Last Friday’s disappointing jobs report seemed to trigger an oversold bounce in stocks on the expectation that the Fed will soften. The question is whether this is sustainable or whether it’s just a technical bounce that will be stymied by overhead resistance (aka the proverbial “dead cat bounce”).

Again, I think the Fed made a policy mistake by hiking. The problem is, interest rates impact the whole economy—they can’t be targeted—and monetary policy is clearly restrictive in the most rate-sensitive industries and demographics (despite what Warsh states in his official comments about the broader economy). And even if they could be targeted, the upper leg of the K-shaped economy is largely rate-insensitive, including 1) cash-rich hyperscalers and other equity-capitalized Tech companies that are driving record earnings growth in a powerful secular growth story, and 2) Baby Boomers who are now freely spending their wealth in retirement without taking on debt. But the struggling lower leg of the K (small businesses and lower-income and working-class consumers) is highly rate-sensitive, and yet it is being given the same bad medicine as the robust upper leg. Moreover, it’s bad for government borrowing, further raising out-of-control interest expense, with a massive debt maturity wall coming due for rollover.

Regardless, I expect to see—through the end of this decade and likely beyond—smaller government and less low-ROI government spending in favor of more high-ROI capital allocation from an unleashed private sector as the primary engine of organic economic growth through fiscal support like favorable tax policy, deregulation, and other supply-side incentives for reshoring/onshoring to increase productive capacity. And for now, global liquidity remains abundant, continuing to hit new highs.

As such, I still think the S&P 500 will reach 8,000 by year end. Of course, it largely depends on the upcoming Q3 earnings reports and forward guidance, which have been beyond stellar so far this year, but expectations are becoming challenging. We got the September pullback I expected, with the S&P 500 successfully testing support at its 50-day moving average. However, as the GMO Asset Allocation team observed, “For the first time in twenty years, with the brief exception of the Global Financial Crisis, we are seeing net dilution in the U.S. stock market (i.e., share issuance exceeding share buybacks) as the hyperscalers continue their capital expenditure spree.”

But assuming core inflation metrics continue to moderate and the Fed comes to its senses on tightening, I expect a resumption in the healthy market broadening beyond the AI trade, and I continue to see opportunities in active stock selection, equal-weight indexes, value stocks, cyclical sectors, small caps, and bond-alternative dividend payers.

Indeed, Sabrient’s quant-based, actively selected (“quantamental”), equal-weight Baker’s Dozen, Forward Looking Value, Dividend, and Small Cap Growth portfolios have been largely outperforming their benchmarks—several by substantial margins. And as a reminder, our Earnings Quality Rank (EQR) is licensed as a quality prescreen to the actively managed, low-beta First Trust Long-Short ETF (FTLS), which now holds more than $2.6 billion in AUM.

Sabrient employs a wide variety of fundamental financial factors in our quantitative multifactor models and portfolio selection process. Sabrient Scorecards for Stocks and ETFs are investor tools that provide access to several of our proprietary models for portfolio monitoring and for idea generation for four key investing styles—Growth, Value, Dividend, and Small Cap Growth. To learn more, visit this link: https://www.moonrockstopowerstocks.com/scorecard.

Here is a link to this full post in printable PDF format. As always, I’d love to hear from you! Please feel free to email me your thoughts on this article or if you’d like me to speak on any of these topics at your event.  Read on….

Scott Martindale


  by Scott Martindale
  CEO, Sabrient Systems LLC


Quick note: Sabrient’s annual Forward Looking Value 14 portfolio just launched last week on 8/26 with a diverse mix of 31 stocks across 9 business sectors and a 50/50 Large/SMID-cap mix. Think of it as a less-concentrated and more value-oriented version of Baker’s Dozen. Last year’s FLV 13 terminates 11/17 and is up +38.4% vs. +19.4% for S&P 500 Value (SPYV) and +20.2% for S&P 500 (SPY) as of 9/2. I personally like the UIT structure as a diversifier for a client’s equity portfolio because they are unmanaged—while most other products are managed to some extent, even quarterly rebalanced rules-based indexes—and most active managers tend to underperform their benchmarks. Also, value stocks tend not to be as volatile, so value or dividend portfolios tend to fit well with the unmanaged, buy-and-hold-for-15-months structure.

Overview:

The US economy is changing faster than the traditional macro indicators can explain it. On the one hand, Q2 GDP (just +1.5%) and jobs growth look sluggish, inflation is sticky, debt and bond yields are surging, and the bifurcated “K-shaped” economy is causing poor consumer sentiment and public dissatisfaction—to the point that socialism(!) is gaining traction. The top 10% by net worth own 87% of stocks and 68% of total net worth, while the bottom 50% own just 1% of stocks but carry 52% of consumer debt. Consumer debt is rising while the personal savings rate remains low to support spending. Real (inflation-adjusted) consumer spending was essentially flat in July, while the personal savings rate finally edged up slightly to 3.0% in July after a steady decline from 6.4% in January 2024 to as low as 2.6% in June 2026.

On the other hand, the official Q2 GDP reading was held down by high AI-related imports and inventory drawdowns, which actually reflect robust economic activity. Private domestic demand (considered a truer signal of underlying economic health) was quite strong in Q2 at +4.2% annualized rate, consumer spending was up +3.4%, business investment excluding housing was up +8.5%. Indeed, the Atlanta Fed’s GDPNow now forecasts Q3 GDP at 4.7% (as of 9/3). Corporate profits, productivity, margins, cash flow, and capex are massive. Jobless claims in our “low-hire, low-fire” labor market are near their lowest level in decades, which Fed chairman Kevin Warsh calls "an empirically robust real-time indicator” constrained only by flattening labor supply (a lack of willing workers).

Perhaps the low personal savings rate is to be expected as Baby Boomers retire and draw down their wealth, and household debt as a percentage of disposable personal income has stopped rising in Q1-Q2. Stocks are near all-time highs even though interest rates have become punitive (compared to what the broad economy had become accustomed to), and market breadth is improving.

While these data points might seem like contradictions, they may in fact be a predictable reflection of a structural transition toward a more capital-intensive, AI-driven, productivity-led economy.

Regarding inflation and Fed policy, Warsh stated in his Jackson Hole speech, “Certain sectors—like housing and agriculture—are showing strains. But, on balance, I would be hard pressed to describe broad financial conditions as restrictive…. We must be confident that underlying inflation is moving to our objective, clearly and at sufficient speed. Otherwise, we have work to do.” But you likely heard it paraphrased as simply, “Inflation is running too hot…financial conditions are not restrictive…we have work to do,” which is clearly more hawkish than his actual statement and seemingly a fait accompli that rate hikes are imminent. Fed funds futures now imply 2+ rate hikes over the next 12 months, with 50% odds of a 25-bp hike at the upcoming FOMC meeting this month.
 
However, I humbly disagree. I think Warsh’s actual statement cleverly balanced between sounding sufficiently hawkish to appease the “bond vigilantes” while leaving himself an opening to avoid hiking rates. Most of the non-supply-shock components of inflation are relatively subdued, and by some key metrics, underlying inflation is indeed moving toward the 2% objective—for example, Warsh’s preferred Trimmed Mean PCE has held steady at +2.3% in June/July, and the real-time, blockchain-based Truflation CPI is also +2.3% (as of 9/3). Meanwhile, all is not well in this K-shaped economy. The labor market is stagnant, the lower/working class consumer and wage earner is struggling, and monetary policy is clearly restrictive in the most rate-sensitive industries and demographics.

We can’t continue to rely solely on massive AI capex and retiring Baby-Boomer spending (neither of which are particularly rate sensitive) to power our economy while watching the lower leg of the K languish. All it takes is for one hyperscaler to announce a significant reduction in capex and we’ll likely see economic growth fall—along with the stock market.

So, I continue to believe a rate cut is appropriate—certainly not a hike (as fed funds futures and Polymarket confidently predict). A hike would only further hinder those struggling cash-poor segments (many of whom are warming up to the socialist “free stuff” rhetoric) while doing little to restrain the cash-rich AI trade or resolve the event-driven supply shock. I feel alone in the woods on this, but I see the neutral rate at 3.0-3.25%. Unfortunately, such an action apparently would be quite unpopular in the bond market and thus is unlikely to happen anytime soon, thus keeping the economy bifurcated. However, in speeches this week, Fed governor Christopher Waller and NY Fed president John Williams pumped the brakes on the tightening narrative (“Give disinflation a chance”).

Kevin Warsh has suggested in the past a preference for fulfilling his mandate of price stability through a combination of: 1) a lower fed funds rate, 2) continued balance sheet reduction to constrain money supply growth (including a revised Treasury-Fed relationship that gives the Treasury more say over balance-sheet decisions), and 3) structural reform of how inflation is measured (replacing the lagged and imputed components). This approach would ensure that liquidity is cheaper to access, preventing credit markets from locking up without flooding the entire financial system with inflationary liquidity. Less Fed demand for bonds might steepen the yield curve somewhat and keep 30-year mortgage rates elevated, but a lower fed funds rate reduces rates on short-term construction loans and adjustable mortgages.

According to global liquidity expert Michael Howell of CrossBorder Capital, the “Fed does not need to cut Fed funds to loosen US monetary conditions. It can hold the policy rate steady while Treasury bill issuance, reserve management and bank balance-sheet expansion deliver the liquidity impulse. This is the essence of ‘Treasury QE’: fiscal expansion financed at the short end, supported by enough reserve liquidity to keep funding markets orderly.”

By the way, regarding the sudden tariff flare-up with Canada, our neighbor’s retaliation could have targeted industrial inputs but instead it’s notable that they only apply to food and consumer products in an (admittedly) targeted effort to pressure Republican candidates in competitive US midterm election races in swing states like Pennsylvania, Michigan, and Wisconsin, and red states like Ohio, Indiana, and Kentucky.

In my full commentary below, I discuss:

1. Broadening continues as small caps, value, and the S&P 493 carry the baton
2. High earnings vs. high yields and the impact on valuations
3. The NVIDIA juggernaut and AI Phase II: proving the economy-wide ROI
4. Materials and power constraints on the AI buildout
5. K-shaped economy, inflation, and the Fed’s policy dilemma
6. Runaway Federal debt and the need to grow our way out of it
7. Crude oil inventory drawdown and oil company windfall profits
8. My Final Comments essay: Is AI opposition a nuclear power redux?
9. Sabrient’s sector rankings, positioning of our sector rotation model, and some top-ranked ETF ideas

According to Morgan Stanley, AI’s diffusion across the global economy is a $40 trillion opportunity that will rely on affordable compute. Indeed, there is so much demand for compute, some say it is becoming a new asset class—like stocks, bonds, commodities, real estate, private credit, crypto, collectibles, royalties, cash-flowing private businesses, or carbon credits. Pending regulatory review, CME Group and Silicon Data have announced plans to launch futures contracts on compute by tracking daily and hourly on-demand GPU rental cost indexes for NVIDIA's H100 and next-gen Blackwell B200 chips. This allows a company reliant on AI to lock in a future price and ensure delivery from a new datacenter that takes 2-3 years to build.

Some are worried about falling token prices hurting the projected ROI on capex. But at the Google I/O 2026 Conference, CEO Sundar Pichai said that AI is using 3.2 quadrillion tokens per month, which is up 7x YoY. Indeed, rapidly falling inference costs can create demand that didn’t exist at previous prices. This is largely due to Jevons Paradox, which says efficiency gains lower production cost, which gets passed on to customers, thus driving up demand, which increases total resource usage over time—i.e., demand for a product or resource rises as price falls (aka demand elasticity). So, if the hyperscaler can produce and sell compute tokens cheaper, usage surges, and the hyperscaler makes more money overall. It seems this trend can only be disrupted by misguided (or deliberately subversive) politicians hell-bent on obstructing this broad, multi-layered, truly all-in, capital-investment cycle, as I discuss further in my Final Comments essay below.

This is just one of the many reasons I expect to see, through the end of this decade and likely beyond, smaller government and less low-ROI government spending in favor of more high-ROI capital allocation from an unleashed private sector as the primary engine of organic economic growth through fiscal support like favorable tax policy, deregulation, and other supply-side incentives for reshoring/onshoring to increase productive capacity.

As such, I still think the S&P 500 could reach 8,000 by year end. However, I also think a further market pullback this month is likely, perhaps to test support at the 50-day moving average, and as a reminder, September is the only month since 1975 in which the S&P 500 has averaged a net loss (-0.8%). But assuming continued healthy market broadening beyond the Big Tech titans, and praying the Fed does not start tightening, I continue to see opportunities in active stock selection, equal-weight indexes, value stocks, cyclical sectors, small caps, and bond-alternative dividend payers. I also continue to believe the Healthcare sector, which finally came alive this year, offers tremendous growth opportunities as it leverages AI. Sector earnings for Healthcare Select SPDR (XLV) are projected to rise by 22% YoY in 2027, which is second only to Technology.

Sabrient’s quant-based, actively selected (“quantamental”) Baker’s Dozen, Forward Looking Value, Dividend, and Small Cap Growth portfolios have been largely outperforming their benchmarks—several by substantial margins. And as a reminder, our Earnings Quality Rank (EQR) is licensed as a quality prescreen to the actively managed, low-beta First Trust Long-Short ETF (FTLS), which now has more than $2.5 billion in AUM.

Here is a link to this full post in printable PDF format. As always, I’d love to hear from you! Please feel free to email me your thoughts on this article or if you’d like me to speak on any of these topics at your event.  Read on….

Scott Martindale  by Scott Martindale
  President & CEO, Sabrient Systems LLC

The New York Fed’s Global Supply Chain Pressure Index (GSCPI) for November was released today, and although it rose more than expected (likely due to disruptions from heightened global hostilities), it still suggests inflation will continue its gradual retreat, with a reading near the long-run average. But let me start by talking about October’s inflation indicators. Last week, the headline reading for Personal Consumption Expenditures (PCE) for October came in at 3.0% YoY, helped quite a bit by the fall in oil and gasoline prices (note: the US is producing an all-time high of 13.2 million barrels/day of crude oil). Core PCE, which is the Federal Reserve's preferred inflation metric, came in at 3.46% year-over-year. However, the month-over-month number for October versus September, which better reflects today's inflation trends and the lag effects of higher interest rates, came in at 0.16%, which annualizes to 1.98%. Keep in mind, the Fed's inflation target is 2.0%. But monthly data can be choppy, so looking at the rolling 3-month average, it annualizes to 2.37%.

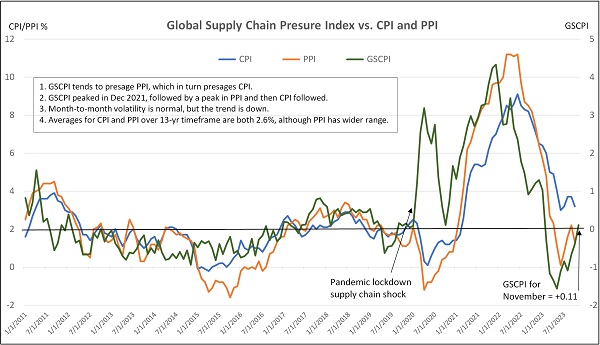
Earlier reports had shown October PPI at 1.3% YoY and CPI at 3.2%, with core PPI (excluding food & energy) was 2.4% YoY, and core CPI was 4.0%. All of this was presaged by the GSCPI, which measures the number of standard deviations from the historical average value (aka Z-score) and generally foreshadows movements in inflation metrics. It plummeted from a December 2021 all-time high of +4.31 down to the October reading of -1.74—its lowest level ever. However, that ultra-low October reading has been revised to -0.39 due to “a change in exchange rate weighting methodology,” according to the New York Fed. Nevertheless, the writing was on the wall for last week’s favorable PCE report. The chart below illustrates the correlation between GSCPI, PPI, and CPI.

GSCPI vs CPI and PPI

So, what to expect for November inflation? Well, as shown in the chart, GSCPI for November just came in today at 0.11. Although rising from its ultra-low levels, it still remains at the long-run average, and the chart illustrates that volatility is to be expected. All in all, I think it still bodes well for the next week’s CPI/PPI readings as supply chains continue to heal and diversify (albeit with occasional hiccups like we see today from heightened global hostilities), especially when you also consider that the consumer has become stretched with rising household debt and falling growth in job openings and wages, money supply growth is stagnant, and budget hawks are increasingly flexing their fiscal muscles in Congress. Thus, I believe the probability of a resurgence in either inflation or fiscal expansion is quite low.

Furthermore, although the second estimate for Q3 GDP was ultra-strong (the highest in 2 years), revised up to 5.2% annual rate (from previous 4.9%), the boost came from state and federal government spending, which was revised up to 5.5% from the prior estimate of 4.6% (i.e., more unsustainable deficit spending and issuance of Treasuries paying high coupons, mostly from an 8.2% increase in defense spending), while personal consumption was revised down to 3.6% from 4.0%. This tells me the “robust” GDP number was something of an illusion.

Indeed, looking ahead, the Atlanta Fed’s GDPNow forecasts only 1.3% GDP growth and 1.9% PCE growth for Q4 (as of 12/6). Moreover, the good folks at Real Investment Advice observed that Gross Domestic Income (GDI) for Q3 was reported at only +1.5%, displaying the widest gap below GDP in 50 years. (Note: GDP measures the value of goods and services produced, including consumption expenditures, investments and exports, while GDI measures incomes earned and costs incurred in production of GDP, including wages, profits, and taxes.) Also, last week’s Fed Beige Book showed that two-thirds of Fed districts reported slower economic activity over the prior six weeks, and the ISM Manufacturing Index came in at an anemic 46.7, showing continued contraction for the 15th straight month.

So, this all seems to be more “bad news is good news” when it comes to Fed policy moves, and investors will be eagerly watching Friday’s jobs report followed by next week’s CPI, PPI, and FOMC policy announcement. Stocks have been taking a healthy breather and consolidation in anticipation of it all, but so far, no major pullback. This year seems to be following the playbook of what economist Ed Yardeni has characterized as a series of “rolling recessions” (among sectors) and an “Immaculate Disinflation,” i.e., moderating inflation without a harsh recession or massive layoffs. As an aside, I have opined many times that it is ridiculous that we constantly find ourselves awaiting the edict of this unelected board of “wise elders” to decide our economic fate. Why can’t they take emergency measures only when absolutely necessary to avert economic cataclysm, and then once the crisis has passed, those emergency measures are quickly withdrawn so that the free market can get back to doing its productive, creative, wonderful thing? One can dream.

Regardless, in my view, the Fed is likely done with rate hikes and preparing for its eventual pivot to rate cuts—which I think will come sooner than most expect, likely before the end of H1 2024. Why? Because if inflation maintains its gradual downtrend while the Fed holds its overnight borrowing rate steady, the real (inflation-adjusted) rate keeps rising, i.e., de facto tightening. Indeed, Fed funds futures are projecting 98% chance for no rate change next week, and for 2024, 62% chance for at least one 25-bp rate cut by March, 97% for at least one 25-bp cut by June, and 89% chance of a full 1.0% in total rate cuts by December 2024, which would put the fed funds rate below 4.5%.

Accordingly, after kissing the 5% handle, the 10-year Treasury yield has fallen precipitously to below 4.2%—a level last seen at the end of August. So, I encourage and expect the FOMC to follow the message of the bond market and begin cutting the fed funds rate back towards the neutral rate, which I think is around 2.5-3.0% nominal (i.e., 2% target inflation plus 0.5-1.0% r-star), and hand back control of the economy to the free market. As of now, the Fed is on the verge of crushing the housing market…and by extension the broader economy. In addition, it must ensure money supply resumes a modest growth rate (albeit slowly), not continue to shrink or stagnate.

To be sure, the safe steadiness of bond yields was disrupted this year. After rising much faster than anyone anticipated, interest rates have fallen much faster than expected, especially considering that the Fed hasn’t made any dovish policy changes. Nevertheless, if rates are going to generally meander lower, investors might be expected to lock in sustainable yield with capital appreciation potential through longer-duration securities, including long-term bonds, “bond proxies” like dividend-paying equities (e.g., utilities, staples, and REITs), and growth stocks (like high-quality technology companies).

I also like oil, gold and uranium stocks, as well as gold, silver, and cryptocurrency as stores of value in an uncertain macro climate. Notably, gold is challenging its highs of the past few years as global investors and central banks are both hedging and/or speculating on a weaker dollar, falling real interest rates, rising geopolitical tensions, and potential financial crisis, and the World Gold Council reported robust demand among central banks, which purchased a record 800 tons during the first three quarters of the year. Similarly, Bitcoin is catching a bid on speculation of broader investor access (through spot-price ETFs) and dollar debasement (if debt and deficit spending continue to spiral).

Keep in mind that, when valuations get lofty within a given asset class, volatility and performance/valuation dispersion among stocks often increases while correlations decrease. For stocks, active selection strategies that can exploit the dispersion to identify under-the-radar and undervalued companies primed for explosive growth become more appealing versus passive index investing. Sabrient’s actively selected portfolios include the Q4 2023 Baker’s Dozen (launched on 10/20), Small Cap Growth 40 (launched on 11/3), and Sabrient Dividend 46 (just launched on 11/29, and today offers a 4.7% dividend yield).

In today’s post, I further discuss inflation, the US dollar, Fed monetary policy implications, and relative performance of asset classes. I also discuss Sabrient’s latest fundamentals based SectorCast quantitative rankings of the ten U.S. business sectors (which is topped by Technology and Industrials), current positioning of our sector rotation model (which turned bullish in early November and remains so), and some actionable ETF trading ideas.

Click here to continue reading my full commentary … or if you prefer, here is a link to this post in printable PDF format (as some of my readers have requested).