Sector Detector: Investors weigh US policy uncertainty versus high valuations and low risk premia
 by Scott Martindale
President & CEO, Sabrient Systems LLC
Overview:
The stock market continues to chop around within a 2-month sideways trend, as uncertainty about fiscal and monetary policies confront elevated (some might say extreme) valuations, risk premia, and market cap concentration (with the top 10% of stocks by market cap now accounting for about 75% of the total), as well as slowing growth among the MAG-7 stocks. Uncertainty ranges from DeepSeek’s implications on the massive capex spending plan for AI, to DOGE’s rapid discovery of the shocking array of wasteful spending and corruption, to President Trump’s starling proposals regarding Gaza, Greenland, and Canada, to the frantic protests of Democrats and injunctions from federal judges on his dizzying array of executive orders.
Nevertheless, investors seem broadly optimistic about Trump 2.0 policies in the longer term but are concerned about near-term pain (which he has warned them about) from things like tariffs, trade wars, widespread job cuts across the federal government (from DOGE), and civil unrest and political dysfunction from those pushing back on the new policies—and the near-term impact on geopolitical tensions and the trajectories of GDP, the budget deficit, federal debt, inflation, the dollar, interest rates, and new issuances of Treasuries. As a result, gold has gone parabolic and seems determined to challenge the $3,000 mark. Bond investors may be rewarded handsomely when economic fundamentals normalize and the term premium fades. Until then, sentiment rather than data has been the key driver of bond yield rates.
Since the Fed started its rate cutting cycle, the fed funds rate is 100 bp lower while the 10-year Treasury yield jumped as much as 100 bps mostly due to short-selling “bond vigilantes,” although it has receded quite a bit of late. But more important than the fed funds rate is bringing down the 10-year Treasury yield, which has a much greater impact on long-term borrowing costs—like home mortgages—but is primarily driven by market forces and sentiment. So, other than direct intervention via QE (buying longer-term Treasuries and MBS on the open market), all the Fed and Trump administration can do is try to shore up investor confidence and expectations for economic growth, jobs, inflation, deficits, interest rates, productivity, and earnings.
Indeed, new Treasury Secretary Scott Bessent says the president believes, “if we deregulate the economy, if we get this tax bill done, if we get energy down, then [interest] rates will take care of themselves.” To that end, Bessent has espoused a “3-3-3” economic plan to increase GDP growth to 3%, reduce the budget deficit to 3% of GDP, and boost oil production by 3 million bbls/day (and according to Ed Yardeni, you might throw in 3% productivity growth as a fourth “3”). In Bessent’s view, we have “a generational opportunity to unleash a new economic golden age that will create more jobs, wealth and prosperity for all Americans.”
The recent uptick in US inflation has not been due to supply chain disruptions, as the Global Supply Chain Pressure Index (GSCPI) is negative (below its long-run average) at -0.31 (Z-score, or number of standard deviations from the mean). Instead, it seems to be more about: 1) money supply and velocity both rising in tandem, and 2) heavy foreign capital flight into the US (much of which remains outside of our banking system and is not captured by M2 money supply metrics) and interest payments on US debt (which goes primarily to wealthy individuals and sovereign governments) going toward asset purchases, which creates a consumer "wealth effect." This surge in foreign capital into the US is driven by our strong dollar, innovative public companies and start-ups, higher bond yields, desirable real estate, property rights, and business- and crypto-friendly policies.
Many commentators have called current stock valuations “priced for perfection.” Much like China’s mercantilist economy facing falling growth rates—as it has become so large it simply can’t find enough people to sell to maintain its previous trajectory—the MAG-7 stocks also seem to be hitting limits to their growth rates from sheer size. In fact, according to the The Market Ear, the “big four” richest executives (Musk, Bezos, Zuckerberg, Ellison) have seen their combined wealth explode from $74 billion in 2013 to $1.1 trillion today—nearly as much as the total US trade deficit ($1.2 trillion), or our total annual imports from China, Canada and Mexico ($1.3 trillion). Insane. But because of the extreme level of market concentration among the market juggernauts that distort the valuation multiples of the broad market indexes, I believe there are still many smaller “under-the-radar” stocks offering fair valuations for attractive growth, which is what Sabrient’s models seek to identify. I discuss this further in my full commentary below.
For 2025, my view is that, after a period of digestion and adjustment to this current flurry of activity (and likely a more significant market correction than most investors expect), we will see the stimulative and transformational impacts of: 1) business-friendly fiscal policies and deregulation, 2) less anti-trust enforcement and lawfare, 3) massive cuts to wasteful/unproductive government spending (including on illegal migrants and foreign wars), 4) tame supply chain pressures and labor, oil, and shelter costs all stabilizing, and 5) supportive monetary policy and a steepening yield curve (through normalization in interest rates and the term premium). Collectively, this promises to unleash our private sector and recharge economic growth.
Furthermore, I think recent signs of resurgent inflation and fears of a ballooning deficit will both recede, as I discuss in greater depth in my full post, which will allow the Fed to make two-to-three 25-bp rate cuts on its path toward what I believe is a terminal (aka neutral) rate around 3.50%...and the 10-year yield likely settling into the 4.25-4.50% range (i.e., a term premium of 75-100 bps)—particularly given that many of our global trading partners likely will be forced to cut rates to stave off recession (in Europe) and deflation (in China). Of course, what happens outside our border impacts us. China’s deflationary economy is still slowing and the CCP remains reluctant to use broad stimulus, but rate cuts have been signaled. Japan finally decided to increase its policy rate from 0.25% to 0.50% (still quite low), which strengthened the yen, as it tries to stave off stagflation. Europe is a basket case, especially the manufacturing sector, with recession expected in its largest economies, Germany and France. The ECB will likely cut rates several times and further weaken the euro.
Keep in mind, Treasury yields tend to be self-correcting in that as they rise investors become more defensive and drawn to the higher yields, which increases demand for bonds and brings yields back down. Of course, fiscal policy, deficit spending, inflation, and corporate earnings all come into play as well. But regarding interest rates alone, as long as the Fed is not raising the fed funds rate or tightening liquidity, the environment for stocks is supportive.
Overall, I think this all bodes well for banks, mortgage services, and indeed the whole financial sector, as well as for IPOs/M&A (after a steep downtrend over the past 4 years), small-mid-cap stocks, solid dividend payers, and longer-duration fixed income. Top-ranked sectors in Sabrient’s SectorCast rankings include Technology, Healthcare, and Consumer Discretionary. However, other market segments that don’t rank very high right now but may gain traction in the Trump 2.0 economy include oil & gas, nuclear, and transports, as well as industrials and utilities involved in building out the AI infrastructure and power grid. I also think there is turnaround potential in the beaten-down homebuilders and REITs. And I continue to like gold, silver, and cryptocurrencies as uncorrelated asset classes, market/dollar hedges, and stores of value.
So, rather than the high-valuation MAG-7 stocks, investors are advised to focus on high-quality, fundamentally strong companies displaying a history of consistent, reliable, and accelerating sales and earnings growth, positive revisions to Wall Street analysts’ consensus forward estimates, rising profit margins and free cash flow, solid earnings quality, and low debt burden. These are factors Sabrient employs in selecting our portfolios and in our SectorCast ETF ranking model. And notably, our Earnings Quality Rank (EQR) is a key factor in each of these models, and it is also licensed to the actively managed, absolute-return-oriented First Trust Long-Short ETF (FTLS).
Sabrient founder David Brown describes these (and other) factors and his portfolio construction process in his new book, How to Build High Performance Stock Portfolios, which is available on Amazon for investors of all experience levels. David describes his path from NASA engineer on the Apollo 11 moon landing project to creating quant models for ranking stocks and building stock portfolios in 4 distinct investing styles—growth, value, dividend, or small cap growth. You can learn more about David's book and the companion subscription product we offer (that does most of the stock evaluation work for you) by visiting: https://DavidBrownInvestingBook.com
As a reminder, our research team at Sabrient leverages a process-driven, quantitative methodology to build predictive multifactor models, data sets, stock and ETF rankings, rules-based equity indexes, and thematic stock portfolios. As you might expect from former engineers, we use the scientific method and hypothesis-testing to build models that make sense—and we do that for growth, value, dividend, and small cap strategies. We have become best known for our “Baker’s Dozen” growth portfolio of 13 diverse picks, which is packaged and distributed quarterly to the financial advisor community as a unit investment trust, along with three other offshoot strategies for value, dividend, and small cap investing.
Click HERE to continue reading my full commentary (and to sign up for email delivery). I examine in greater detail the DeepSeek and DOGE shocks, AI spending, equity valuations, GDP, jobs, inflation, tariffs, and what lies ahead for 2025. I also discuss Sabrient’s latest fundamental-based SectorCast quantitative rankings of the ten U.S. business sectors, current positioning of our sector rotation model, and several top-ranked ETF ideas. Also, here is a link to this post in printable PDF format.
Market Commentary:
So far this earnings season (Q4 2024), S&P 500 companies have been beating estimates by enough to support investor confidence in strong earnings growth throughout 2025. In addition, corporate credit spreads remain tight, and the high yield bond index has moved back above its 20-day and 50-day moving averages, which suggests investor confidence and an appetite for risk. Bitcoin has pulled back about 10% from its all-time high after its post-election surge but still looks solid for further upside, while the US Dollar Index remains strong after pulling back about 2% from its January high to a strong support level. Even the healthcare sector and China stocks are enjoying a nice rally.
Regional banks, natural gas, and utilities each moved back above their 20-day and 50-day moving averages. Natural gas has surged as much as 50% since the election, which reflects its desirability as a relatively clean and abundant energy source for AI datacenters, and utilities are being driven by higher energy demand for those datacenters. Our Department of Energy (DOE) forecasts that the US energy grid will need to double in size between 2020 and 2050 to service rapid expansion of AI, hyperscale, Big Data, cloud computing, quantum computing, electric vehicles, and blockchain, which illustrates the current power constraints and the need for innovative solutions. This bodes well for engineering & construction companies.
Of course, markets were briefly roiled by the DeepSeek news out of China that caused much consternation and gnashing of teeth among investors, given its apparent cost and resource efficiency and ability to democratize AI applications by creating innovative algorithms that use existing hardware, last-generation chips, and less energy—and thus less need for hyperscale datacenters. Given the massive capex invested by US Big Tech, this called into question all expectations of profitability and the value of new IP—particularly given DeepSeek’s open-source approach to development.
But the sudden hype around DeepSeek’s David versus the Goliaths of Google’s DeepMind and privately held OpenAI, which is owned by Microsoft and a group of private investors and employees, seems to have been overblown. In fact, the concept of “Jevons Paradox” has resurfaced to explain the phenomenon of increased efficiency leading to greater overall consumption of the resource—or in this case, increased adoption and market expansion. In other words, higher volume overcomes reduced margins, like Walmart (WMT). As Apple CEO Tim Cook stated, “Innovation that drives efficiency is a good thing.” Indeed, despite the sudden concern about over-investment in AI by the companies that build the foundational large language learning models and hyperscale datacenters, investors quickly refocused on the big picture of AI’s promise.
For example, the Q4 earnings release from Meta Platforms (META) proved its ability to implement AI to juice its advertising sales at a lower cost, with Q4 2024 revenue reaching $48.4 billion (21% higher than Q4 2023) and earnings hitting $20.8 billion (64% higher than Q4 2023). CEO Mark Zuckerberg plans to continue investing heavily in AI, targeting $60 billion in capex for 2025 (compared to $41.5 billion in 2024, including $17 billion in AI). He also said he expects “2025 will be the year when it becomes possible to build an AI engineering agent that has coding and problem-solving abilities of around a good mid-level engineer.” Similarly, Alphabet (GOOGL) CEO Sundar Pichai said he expects to spend $75 billion on capex in 2025. Collectively, the four largest hyperscalers—Amazon (AMZN), Microsoft (MSFT), GOOGL, and META—reportedly intend to spend $325 billion in 2025 (up 43% over 2024) to buy land and build data centers and infrastructure close to reliable power sources.
However, GOOGL has not been able to demonstrate solid returns from its massive capital spending like META has. Indeed, META’s surging profitability in ad sales illustrates that it is the companies that can create AI applications that will enjoy the biggest gains in productivity, efficiency, margins, and profitability—particularly firms that don’t also need to invest massive capex in foundational model training and hyperscalers. As we are seeing today, while many of the formerly high-flying AI “builder” stocks struggle a bit, many of the AI application-focused stocks are soaring. After all, the proof is in the pudding, so the real transformational impacts on the economy, business processes, and productivity come from the firms that can effectively leverage AI applications in the products and services they provide—including some of the cybersecurity, cloud networking, and SaaS names like Palantir (PLTR), Fortinet (FTNT), F5 (FFIV), Dynatrace (DT), Pegasystems (PEGA), AvePoint (AVPT), and Freshworks (FRSH) that have been scoring highly in Sabrient’s weekly Scorecard (you can download a free sample).
Now, this says nothing about valuations of these well-positioned companies, so pick your spots and wait for pullbacks. For example, AppLovin (APP) has been the top performer in our Q1 2024 Baker’s Dozen (which launched 1/20/2024), but after an 800% gain (over the past 13 months), it doesn’t score nearly as well today for selection in current portfolios, which are focused on growth at a reasonable price (GARP).
DOGE shakes things up:
Another esoteric concept (besides “Jevons Paradox” discussed above) that everyone is suddenly talking about is the “Overton Window,” which is the range of acceptability of topics and opinions that don’t cross the line into being considered “radical” by current societal norms. For example, at one point in history, it was heretical to suggest the earth was round. Today, the concepts of Artificial General Intelligence (AGI), in which machines can think and reason like a human, or quantum entanglement, in which the state of multiple particles can be linked to each other despite being separated by large distances, or DOGE, in which President Trump is attempting the monumental task of reversing the ever-expanding size, scope, and corruption of government bureaucracy and spending, are each examples of shifting the Overton Window of possibilities.
Many fear that Trump’s DOGE initiative to cut federal spending will raise unemployment and hinder GDP growth. But in fact, it might actually reduce unemployment and boost GDP growth…leading to what some are calling a “small business renaissance.” The Cato Institute argues that cutting federal deficit spending (and its massive debt load that must be serviced by over $1.1 trillion/year) can alleviate the “crowding-out effect” in which government borrowing drives up interest rates and hampers private-sector investment leading to lower wages and productivity as well as reduced competitiveness.
Reducing wasteful/unproductive government spending frees up those resources for private investment, fostering job creation and higher incomes. In fact, the Hoover Institution suggests that fiscal discipline (including cutting entitlement spending) may boost GDP growth by up to 10% in the short term and 7% in the long term. As Cato’s Adam Michel said, “Fiscal discipline through spending cuts could act like supply-side tax reform and turbocharge other pro-growth tax cuts and deregulation.”
The timing is crucial. According to the Financial Times, "US corporate bankruptcies have hit their highest level since the aftermath of the global financial crisis as elevated interest rates and weakened consumer demand punish struggling groups. At least 686 US companies filed for bankruptcy in 2024, up about 8 per cent from 2023 and higher than any year since the 828 filings in 2010, according to data from S&P Global Market Intelligence." Indeed, many businesses are in urgent need of policy support—mostly by government getting out of the way through less spending, lower taxes, deregulation, and lower interest rates.
By the way, an X.com post from The Kobeissi Letter and a LinkedIn post from Eric Peters of One River Capital provide great insights into both the growing debt and the furious pushback against DOGE’s sudden and drastic disruptions.
Valuations are still high:
Several metrics suggest valuations are stretched and pricing in lofty expectations. For instance, the so-called “Buffett Indicator” (Warren Buffett’s preferred market valuation metric), which is simply the ratio of total stock market capitalization to GDP, now stands at around 207%, which is considered “significantly overvalued.” It exceeds the 200% level leading into the 2022 bear market, and while it is slightly below the pandemic-recovery peak in 2021, it is well above 175% of 1999 and the 20-year average of 120%.
Also, according to Yardeni Research, "Over the past three months, foreigners purchased US equities at a record pace of $76.5B…[but] their buying has a record of being a contrary indicator. They tend to be big buyers right before bear markets." And according to InsiderSentiment.com, the percentage of net buying from corporate insiders hasn’t been this low in over a decade, likely due more to perceived high valuations than to pessimism about business conditions overall. And as Bloomberg reported, "The insider buy-sell ratio, at 0.22, is currently on track to be the lowest in data going back to 1988, according to the Washington Service [a leading provider of insider trading data, news and analytics]."
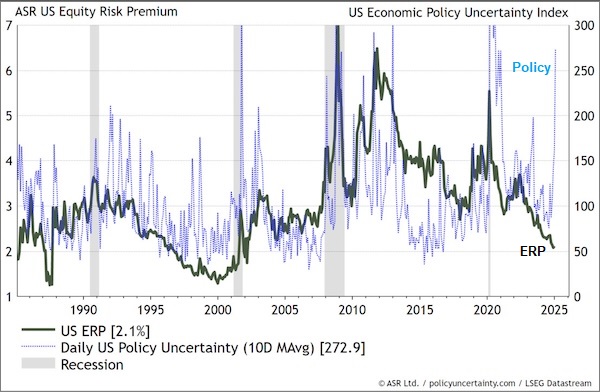
As a reminder, valuations are dependent on earnings, interest rates, and the equity risk premium (ERP, i.e., earnings yield minus the risk-free rate), and today we have robust corporate earnings, rising forward guidance, persistently low interest rates, a dovish Fed, and a low ERP. How low? Well, let’s examine the P/Es of the cap-weight S&P 500 (SPY), equal-weight S&P 500 (RSP), and S&P 600 SmallCap (SPSM) of 22.6x, 17.2x, and 15.5x, respectively. Their inverses imply earnings yields of 4.42% for SP, 5.81% for RSP, and 6.45% for SPSM. Comparing those versus the current 10-year Treasury yield of 4.54% reflects a slightly negative equity risk premium (ERP) for SPY but 1.3% for RSP and 1.9% for SPSM—still low but not ridiculously so. Obviously, the mega-cap market titans (e.g., MAG-7) distort the valuation multiples of the broad market indexes, but you don’t have to look too far to find better valuations.
The low ERP suggests that inflation and interest rate expectations are much lower than current CPI and bond yields would suggest. ASR macro strategist Ian Harnett posted the chart below displaying today’s ultra-low ERP despite elevated uncertainty about US government policies.
Regarding small caps, their Q4 reports have been beating on earnings and revenue estimates at a higher rate than large caps, and yet SPSM continues to trade at a 30% discount on forward P/E versus SPY and a 10% discount on forward PEG (P/E divided by expected EPS growth rate). Given their cyclical bias versus the secular growth bias of SPY, small caps just need an “all clear” signal regarding policy uncertainty.
GDP, jobs, inflation, and tariffs:
Of course, the FOMC focuses on economic growth (i.e., fending off recession), jobs, and inflation metrics. The final estimate for Q4 GDP from the Atlanta Fed’s GDPNow model had fallen from a high of 3.4% to as low as 2.3%. And indeed, the actual first estimate from the BEA indeed came in at an annualized rate of 2.3%, which is satisfactory but uninspiring—certainly in the eyes of President Trump. The WSJ survey of economists raised its US GDP forecasts to well over a 3% annual rate (and falling inflation) in their latest survey. And the Atlanta Fed’s GDPNow forecast sees 2.9% annualized GDP growth for Q1 2025 (as of 2/7).
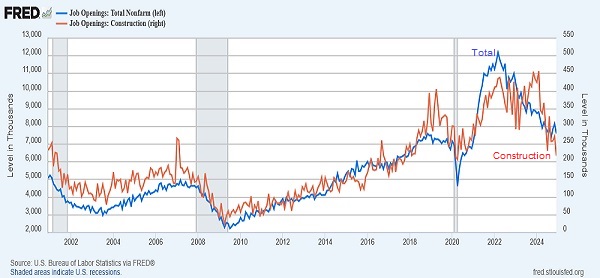
The December JOLTS report (released on 2/4) showed that job openings fell from a March 2022 peak of 12.18 million to 7.60 million (vs. consensus estimate of 8.0 million), which is the second lowest reading since the pandemic lockdowns. Likewise, all-important construction jobs have been plummeting in a recessionary pattern from a peak in February 2024 of 456,000 to just 217,000. Openings in both construction and manufacturing are around their pandemic-lockdown lows. However, it’s hard to know what to believe with these surveys as response rates have fallen to around 33%.
The BLS jobs report for January was mixed, with fewer than expected new jobs but upward revisions to November-December, and so the unemployment rate fell a tenth to 4.0% while average hourly earnings increased 0.5% in January and are up 4.1% YoY. (Notably, the Census Bureau finally decided to pass along to the BLS that the adult civilian non-institutional population increased by 2.9 million, including 2.0 million in the workforce.) Government hiring continued as a major source of new jobs. In fact, outside of the large and unyielding segment of largely government-paid jobs in government, healthcare, and education, the private sector added just 14,000 new jobs.
I have often written about my dismay with our bloated and rapidly expanding federal government along with my skepticism about the official, government reports that create the illusion of a robust economy and jobs market when the reality is they are overly reliant on massive government deficit spending and hiring rather than the fostering and nurturing of true organic growth by unleashing a vibrant private sector. Of course, this is the aim of the Trump 2.0 economy.
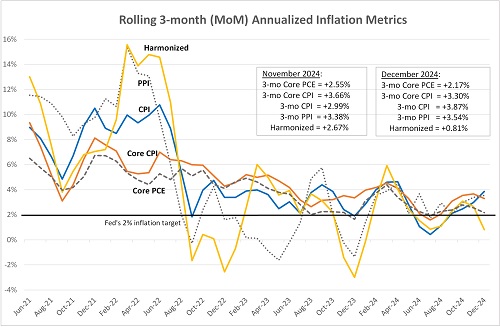
As for inflation, for Q4 2024 the GDP price deflator came in at an annualized rate of +2.2% and was up +2.4% from Q4 2023. For December, the overall PCE deflator increased 0.3% MoM in December and was up 2.6% YoY. The Core PCE deflator, which excludes food and energy, rose 0.2% in December and was up 2.8% YoY.
I prefer to monitor annualized 3-month averages for a better handle on the current trend. So, with all the December metrics posted, although the annualized 3-month averages for CPI and Core CPI are above +3%, we find the Fed’s preferred Core PCE at +2.17%. Also, the European method Harmonized Index of Consumer Prices (HICP) has essentially flatlined at just +0.81%, as shown in the chart below.
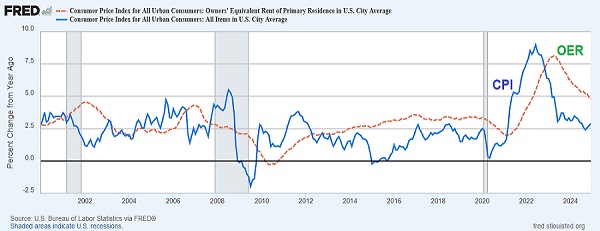
Because shelter cost accounts for 36% of the CPI calculation, and the Owner’s Equivalent Rent (OER) component of shelter alone accounts for 25% of CPI, it deservedly commands attention and scrutiny. As shown in the chart below, OER has been steadily falling from +8.1% in April 2023 to +4.8% in December, and yet it still may be overstating real-time inflationary pressures due to its long lag time in reflecting current trends in rent.
For example, although the All Tenant Regressed Rent Index (ATRR) was +3.23% YoY in Q4, New Tenant Rent Index (NTR) was down -2.40% YoY (the first negative quarter since 2010) and -5.39% vs. Q3, which should soon show in CPI and PCE shelter costs. Because only about 5% of leases are renewed each month, there is a lag of several quarters before it shows up in a significant way in ATRR, so the New Tenant Rent Index leads OER. According to property data analytics firm CoreLogic, growth in single-family annual rents slowed in November to about +1.5%, its lowest in 14 years. This all suggests that CPI and PCE may actually be running cooler than the latest metrics reflect. The folks at MacroStrategy Partnership UK assert that lagging indicators are still high while leading indicators are pointing down, and they calculate CPI x-shelter to be running about +1.6%.
Lastly, I suggest all readers follow the real-time, blockchain-based “Truflation” metric, which is published daily based on 30 million data points and has historically presaged CPI. It was low last summer, and indeed CPI readings weakened. And more recently it got closer to 3%, and indeed CPI resurged. But most recently it has fallen to +2.07% YoY (as of 2/12), which suggests CPI and other inflation metrics will soon recede.
As for the tariffs that have outraged Democrats and the MSM, they don’t add to either inflation or GDP, in my view. Inflation arises from sustained excess demand. Case in point is Trump 1.0 in 2017. Tariffs are a price shock that can be offset by relative currency depreciation. When they increase the price of one item, it leads consumers to make tradeoffs for their money, absent a corresponding increase in money supply. As for GDP, tariffs discourage imports in favor of domestic production, but imports are already part of the GDP computation, so there is no net change in value-add.
Besides, I don’t think Trump truly loves tariffs as much as he often likes to suggest. I have come to understand that there is a method to his madness. As he said himself, “we may have short term some pain, but people understand that.” I find it humorous that he runs on his stated plans, the people vote for him and his stated plans, and then when he implements said plans all the MSM talking heads act as though they are so much smarter than he and that the sky is falling. It’s like Groundhog Day every day.
But my view is that he doesn’t really want a protracted trade war with escalating tariffs. Instead, tariffs are all about quickly cudgeling recalcitrant trading partners into submission. Fleeting pain for US consumers, but major pain for those misbehaving countries. He plays a game of chicken with other nations who are ill-positioned to win. Trudeau is driving a Prius straight into Trumps’ 18-wheeler. There is no doubt who would win, so of course it ended (so far) before it even got started. It’s just a short waiting game—quite short when it comes to our immediate neighbors who depend on us buying the bulk of their exports. In this latest case, the goal is slashing illegal border crossings by criminals, traffickers, terrorists, and covert drug shipments—but usually the goal is “fairer trade" when the US typically accepts the short end of the stick. Trump loves to gin up a kerfuffle among his detractors, opponents, and anyone on the other side of the negotiation. Rather than calm, tactful diplomacy that might take months or years (if ever) to complete, he puts an outrageous position on the table with apparent earnestness and intention—and usually gets a deal done within weeks or days (if not hours).
Any new inflationary surge would require an economic disruption that causes a massive supply/demand imbalance from either a supply shock and/or a demand shock. Otherwise, disinflationary trends will likely continue to moderate inflation metrics. And because most federal spending is typically unproductive spending like entitlements and interest on the debt, Stuart Sparks of Deutsche Bank opined, “Spending must be designed to raise productive capacity, potential growth, and r*. Absent true investment, public spending can lower r*, passively tightening for a fixed monetary stance.”
So, rather than worrying about the inflationary effects of QE, tariffs, and debt, the Fed should be more concerned about the hinderances on economic growth from tightening monetary conditions like declining liquidity, elevated interest rates, and a strong dollar. According to economist Michael Howell of CrossBorder Capital, our hyper-financialized global economy means that liquidity has essentially become the ability to refinance debt, i.e., the balance sheet capacity of the banking system. And as Warren Pies of 3Fourteen Research has opined, the federal deficit has been narrowing since Trump’s inauguration which combined with tax payment season will likely negatively impact liquidity. And the small uptick in bank loans is not likely to be enough to offset it unless and until loan rates fall a good bit. This might hold back asset prices.
And keep in mind, rising productivity can help to not only boost GDP and corporate profits but also pacify inflation. For Q4 2024, productivity growth (aka output per hour) rose at an uninspiring 1.2% annualized rate, and for full-year 2024 it was a modest 1.6%. But economist Ed Yardeni expects productivity gains in 2025 to accelerate, ultimately reaching 3.5%, which keeps unit labor costs down—and by extension overall inflation as well. He says, “If productivity were to grow 3.5% with hours worked up 1.0%, real GDP would grow 4.5%. Is that conceivable? It is in our Roaring 2020s scenario.”
As opposed to the traditional Phillips Curve model, which suggests an inverse correlation between unemployment and inflation, Yardeni observes an inverse correlation between unemployment and productivity. He says, “Tight (loose) labor markets will drive up (down) wage inflation, but that pressure on prices tends to be offset by rising (falling) productivity. In the current productivity growth boom, we expect that the tight labor market will stimulate more productivity growth.”
Latest Sector Rankings:
Relative sector rankings are based on Sabrient’s proprietary SectorCast model, which builds a composite profile of each of over 1,400 equity ETFs based on bottom-up aggregate scoring of the constituent stocks. The Outlook Score is a Growth at a Reasonable Price (GARP) model that employs a forward-looking, fundamentals-based multifactor algorithm considering forward valuation, historical and projected earnings growth, the dynamics of Wall Street analysts’ consensus earnings estimates and recent revisions (up or down), quality and sustainability of reported earnings, and various return ratios. It helps us predict relative performance over the next 3-6 months.
In addition, SectorCast computes a Bull Score and Bear Score for each ETF based on recent price behavior of the constituent stocks on particularly strong and weak market days. A high Bull score indicates that stocks held by the ETF recently have tended toward relative outperformance when the market is strong, while a high Bear score indicates that stocks within the ETF have tended to hold up relatively well (i.e., safe havens) when the market is weak. Outlook score is forward-looking while Bull and Bear are backward-looking.
As a group, these three scores can be helpful for positioning a portfolio for a given set of anticipated market conditions. Of course, each ETF holds a unique portfolio of stocks and position weights, so the sectors represented will score differently depending upon which set of ETFs is used. We use the iShares that represent the ten major U.S. business sectors: Financials (IYF), Technology (IYW), Industrials (IYJ), Healthcare (IYH), Consumer Staples (IYK), Consumer Discretionary (IYC), Energy (IYE), Basic Materials (IYM), Telecommunications (IYZ), and Utilities (IDU). Whereas the Select Sector SPDRs only contain stocks from the S&P 500 large cap index, I prefer the iShares for their larger universe and broader diversity.
The table below shows the latest fundamentals-based Outlook rankings and my full sector rotation model:
I would call the rankings neutral given that secular growth, cyclicals, and defensives are mixed throughout. Bullish rankings would entail cyclical and economically sensitive sectors dominating the top half of the rankings with scores well above 50 and defensive sectors in the lower half. In the immediate wake of the Fed rate cut and dovish pivot, the rankings were more bullish, but with the market’s persistent strength in excess of earnings growth rates, valuation multiples remain at extremes, pushing Financials and Industrials down to the middle of the rankings.
Technology (dominated by the Big Tech titans and AI-driven highflyers) remains at the top with a strong Outlook score of 91, despite having by far the highest forward P/E (29.2x). However, because of its EPS growth estimates (19.1%), its forward PEG (ratio of P/E to EPS growth) is a relatively modest 1.53 (the third lowest, which is good), so investors have been happy to “pay up” for strong growth. Tech also displays relatively stable Wall Street analysts’ net earnings revisions (only slightly negative), by far the highest return ratios, and continued insider buying.
Because many Tech stocks are riding secular growth trends (i.e., little cyclicality), and no other sector comes close to the consistent sales growth, margins, operating leverage, and return on capital. For example, the three largest US Tech companies—Apple, NVIDIA, and Microsoft—average net profit margins of over 40% and ROE of around 90%. How do you compete with that? And Tech not only benefits from its own product development and productivity gains, but those products help other companies with their product development, product delivery, and productivity—so Tech benefits by helping all sectors grow and prosper.
Rounding out the top 5 are Healthcare, Consumer Discretionary, Telecom, and Financials, followed by Industrials and Utilities (led by those companies involved in the buildout of AI infrastructure and power grid). Notably, 7 of the 10 sectors have seen either flat or negative net revisions to EPS estimates from the analyst community, with only Financials, Energy, and Telecom solidly positive.
At the bottom of the rankings are Materials and Consumer Staples, mainly due to having the largest negative revisions to earnings estimates, low projected EPS growth rates, and mediocre return ratios. Notably, Telecom, Energy, and Financials display the lowest (most attractive) forward P/Es at 14.7x, 15.1x, and 15.1x, respectively.
Energy has shown some recent attempts to rise in our SectorCast rankings. After a prolonged period of underinvestment, oil & gas companies increased capex by 53% over the past 4 years, according to Deloite’s 2025 industry outlook, with forward focus on capital discipline and efficiency, shareholder payouts (dividends and buybacks), as well as ongoing digital transformation, M&A and integration, strategic partnerships, innovation, enhanced productivity, and cost reduction. Additionally, some companies are engaging in increased investments in low-carbon technology projects to help balance the risks associated with the traditional oil and gas market. So, perhaps we will start to see increased sales and earnings projections for the Energy sector as the year progresses.
Keep in mind, the Outlook Rank does not include timing, momentum, or relative strength factors, but rather reflects the consensus fundamental expectations at a given point in time for individual stocks, aggregated by sector.
Sector Rotation Model and ETF Trading Ideas:
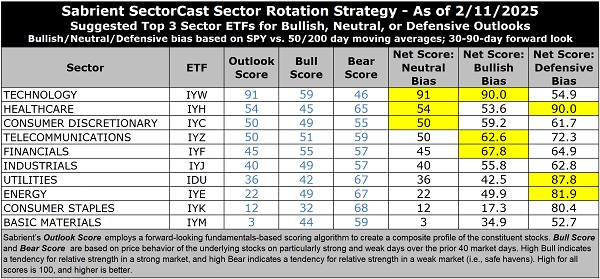
Our rules-based Sector Rotation model, which appropriately weights Outlook, Bull, and Bear scores in accordance with the overall market’s prevailing trend (bullish, neutral, or defensive), returned to a bullish bias in mid-January when the SPY closed solidly back above its 50-day moving average while also staying above its 200-day. (Note: In this model, we consider the bias to be bullish from a rules-based trend-following standpoint when SPY is above both its 50-day and 200-day simple moving averages, but neutral if it is between those SMAs while searching for direction, and defensive if below both SMAs.)
Thus, it suggests holding Technology (IYW), Financials (IYF), and Telecommunications (IYZ), in that order. However, if you prefer a neutral stance, the Sector Rotation model suggests holding Technology, Healthcare (IYH), and Consumer Discretionary (IYC), in that order. Or, if you prefer to take a defensive stance, it suggests holding Healthcare, Utilities (IDU), and Energy (IYE), in that order.
An assortment of other interesting ETFs that are scoring well in our latest rankings include: Invesco Dorsey Wright Healthcare Momentum (PTH), iShares Global Tech (IXN), SP Funds S&P Global Technology (SPTE), AdvisorShares Hotel (BEDZ), Alger 35 (ATFV), First Trust Innovation Leaders (ILDR), Concentrated Equity Fund (CNEQ), Hartford Large Cap Growth (HFGO), BNY Mellon Innovators (BKIV), Cambria Tax Aware (TAX), US Global Technology and Aerospace & Defense (WAR), First Trust Natural Gas (FCG), RiverFront Dividend Advantage (RFDA), Burney US Factor Rotation (BRNY), Invesco S&P SmallCap 600 Pure Growth (RZG), AXS Esoterica NextG Economy (WUGI), Invesco Biotech & Genome (PBE), iShares Technology Opportunities Active (TEK), Invesco Building & Construction (PKB), Goldman Sachs Future Consumer Equity (GBUY), Neuberger Berman Disrupters (NBDS), and Inspire Fidelis Multi Factor (FDLS). All score in the top decile (90-100) of Outlook scores.
As always, I welcome your thoughts on this article (whether supportive or critical)! Please email me anytime. Any and all feedback is appreciated. Also, please let me know of your interest in any of Sabrient’s new indexes for ETF investing, such as High-Quality Growth (similar to our Baker’s Dozen model), Quality Growth & Income, SMID-Cap Quality Plus Momentum, High-Quality Technology, High-Quality Energy, Quality Legacy & Green Energy, or Defensive Equity.
IMPORTANT NOTE: I post this information periodically as a free look inside some of our institutional research and as a source of some trading ideas for your own further investigation. It is not intended to be traded directly as a rules-based strategy in a real money portfolio. I am simply showing what a sector rotation model might suggest if a given portfolio was due for a rebalance, and I do not update the information on a regular schedule or on technical triggers. There are many ways for a client to trade such a strategy, including monthly or quarterly rebalancing, perhaps with interim adjustments to the bullish/neutral/defensive bias when warranted, but not necessarily on the days that I happen to post this article. The enhanced strategy seeks higher returns by employing individual stocks (or stock options) that are also highly ranked, but this introduces greater risks and volatility. I do not track performance of the ideas mentioned here as a managed portfolio.
Disclosure: At the time of this writing, of the securities mentioned, the author held positions in SPY, QQQ, FTLS, gold, and bitcoin.
Disclaimer: Opinions expressed are the author’s alone and do not necessarily reflect the views of Sabrient. This newsletter is published solely for informational purposes only. It is neither a solicitation to buy nor an offer to sell securities. It is not intended as investment advice and should not be used as the basis for any investment decision. Individuals should consider their personal financial circumstances in acting on any opinions, commentary, rankings, or stock selections provided by Sabrient Systems. Sabrient makes no representations that the techniques used in its rankings or analyses will result in profits. Trading involves risk, including possible loss of principal and other losses, and past performance is no guarantee of future results. Investment returns will fluctuate, and principal value may either rise or fall. Sabrient disclaims liability for damages of any sort (including lost profits) arising from the use of or inability to use its rankings or analyses. Information contained herein reflects our judgment or interpretation at the time of publication and is subject to change without notice.
Copyright © 2025 Sabrient Systems, LLC. All rights reserved.