Sector Detector: Expect more upside for stocks this year, but different leadership

by Scott Martindale
CEO, Sabrient Systems LLC
Overview
Last year nearly brought a third straight 20+% total return for the S&P 500, but alas it fell just short. Looking ahead, the ducks seem to be lining up for more upside in 2026, although leadership should see some rotation. I believe the tailwinds far outweigh the headwinds, and investors seem to be positioning for a strong year for both GDP growth and stocks on continued AI optimism, robust/aggressive capex (led by the MAG7) for AI infrastructure as well as onshoring of strategic manufacturing, looser Fed monetary policy, rising global liquidity, full enactment of the One Big Beautiful Bill Act (OBBBA), tax and interest rate cuts, smaller government, deregulation, re-privatization, re-industrialization, and a potential “peace dividend.”
This should continue to attract foreign capital into the US (“shadow liquidity,” much of which is not counted in M2), cut the deficit-to-GDP ratio, and unleash organic private sector growth, with stock valuations driven by rising earnings rather than multiple expansion. Indeed, January is off to a hot start, led by small caps, and the January Barometer would suggest another solidly positive year for stocks (when the first five trading days of the year are positive, the S&P 500 has historically finished the year higher 85% of the time with an average gain of +15%).
However! This is no guarantee that the S&P 500 necessarily ends the year higher. Valuations on the broad indexes remain stretched (some might say “priced for perfection”), so a lot must go right in a year littered with landmines. Not the least of which, while global liquidity is still rising, its growth rate is slowing—although this is partially offset by rising velocity of money (transactions per dollar in circulation), which in the US is at its highest level since Q4 2019. Furthermore, uncertainties persist regarding trade deals and tariffs, the intractable Ukraine/Russia war, Venezuela invasion and upheaval in Iran (both of which impact China, Russia, and oil markets broadly) rising federal debt, civil strife in US cities, political polarization, midterm elections, Fed policy uncertainty, a weak jobs market, signs of consumer distress, and a government shutdown redux threat.
Nevertheless, stock and bond market volatility remains subdued, forecasts for GDP growth and corporate earnings growth are strong (as the private sector retakes its rightful place as the primary engine of growth, with much more efficient capital allocation and ROI than government), and credit spreads remain near historic lows. In fact, the Financial Times reports that in the first full week of January, corporations secured more than $95 billion in 55 IG bond deals, making it the busiest start to a year on record. Real GDP in Q3 2025 came in at 4.3% annualized growth, and for Q4 2025, the AtlantaFed GDPNow is projecting a whopping 5.3% (!) as of 1/14/26 (yes, that’s a real not nominal number). For Q1 2026, the OBBBA is now fully kicking in.
In addition, the New York Fed’s Global Supply Chain Pressure Index (GSCPI) continues to hover at or below the zero line (i.e., its historical average) and disinflationary trends have resumed, such as the buildout and implementation of Gen AI, automation, and robotics, rising productivity (Q3 2025 came in at a whopping 4.9% growth), falling shelter and energy costs, peace deals (war is inflationary), a deflationary impulse on the world from China (due to its domestic struggles and falling consumer demand), low inflation in Europe (hitting the ECB’s 2% target), increased domestic productive capacity (i.e., “duplicative excess capacity,” in the words of Treasury Secretary Scott Bessent), and a firmer dollar. Also, money market funds (aka cash on the sidelines or “fuel”) now exceed $8 trillion, the highest ever.
Valuations for the broad market indexes have pulled back from their extreme highs but remain elevated, with the forward P/E on the S&P 500 finishing the year at 22.9x and the Nasdaq 100 at 26.3x. DataTrek Research observed that the S&P 500 P/E multiple has increased by +4.2% over the course of the year while the price index gained +16.4%, so the difference of 12.2% is primarily due to rising earnings growth expectations, with analysts now expecting 15% earnings growth for the S&P 500, which would be the highest annual growth rate since 2021. Moreover, the firm observed that the Technology and Financials sectors in particular saw their forward P/E multiples decline while beating earnings growth estimates and performing well. They conclude, “One need not argue for ever-higher PE multiples to be bullish on US large caps. A strong earnings story is more than enough to support an optimistic view.” And it’s not just equities reflecting investor optimism as corporate bond spreads ended the year near historical lows.
It’s been several years of relentless headwinds for small caps, but the fiscal and monetary policy setup is finally looking sufficiently supportive for a mean reversion/catchup. Favorable tax policies, less red tape, cooling inflation, a less aggressive if not yet friendly Fed, and improving credit conditions (including lower rates and tight credit spreads) all bode well especially for small caps, particularly given their domestic focus, higher debt levels, and interest rate sensitivity (with about 65% of their debt being floating rate versus 15% for large caps). According to Oren Shiran of Lazard Asset Management, "The big difference going into 2026 is that we finally are seeing earnings growth come back into small caps."
However, here are some words of caution. While it is historically common for the second year of a presidential term to show strong earnings growth, we may well see some consolidation of gains and rotation into value and cyclical sectors like Industrials and Financials, as well as fields like biotech/biopharma that are successfully leveraging AI for discovery and innovation. But whether the broad indexes finish solidly positive this year may depend upon: 1) liquidity growth, 2) the relative strength of the dollar, 3) the steepness of the yield curve (could the 2-10 spread rise above 100 bps?), 4) the status and outlook on capex for AI and onshoring, and 5) the midterm elections and whether Republicans retain the House.
After the S&P 500’s terrific bull run over the past three years in which the MAG7 accounted for roughly 75% of the index’s total return, I think this year might see the equal-weight RSP outperform the cap-weight SPY, with the SPY gaining perhaps only single-digit percentage. This scenario also might favor strategic beta and active management. So, rather than the broad passive indexes (which are dominated by growth stocks, Big Tech, and the AI hyperscalers), I think 2026 should be a good year for active stock selection, small caps, and bond-alternative dividend payers—which bodes well for Sabrient’s Baker’s Dozen, Forward Looking Value, Small Cap Growth, and Dividend portfolios.
According to economist Michael Howell of CrossBorder Capital, this stage of the liquidity cycle (slowing liquidity growth) is correlated with falling bond term premia and flattening yield curve—which means Treasury notes and bonds may perform well later in the year. Indeed, given where we are with stability in real interest rates and inflation expectations, bonds seem ready to return to their historical role as a portfolio diversifier. Notably, there is record level of short positioning in the 20+ Year Treasury Bonds ETF (TLT) entering the new year, and as Mark Hulbert for MarketWatch opined, “Contrarian investors now believe bonds may outperform both stocks and gold because sentiment toward bonds is unusually pessimistic while optimism for stocks and gold is near historical highs, and history shows markets often rally after extreme pessimism and struggle after peak optimism, suggesting bonds could be a better bet in the months ahead despite strong 2025 performance in stocks and gold.”
In addition, this may favor dividend payers, and industrial metals (like copper, aluminum, cobalt, lithium, platinum, palladium), as well as gold, silver, and bitcoin as hedges against monetary inflation. (This is distinct from CPI and is caused by governments “printing money” to monetize their debt—not to fund new spending but to reduce debt service costs and the debt/GDP ratio.) I also think natural gas and energy stocks could perk up this year.
I go much further into all of this in my full post below, including a review of 2025 relative performance of asset classes, caps, and styles; current valuations, the AI bubble narrative, corporate earnings, GDP, jobs, inflation, and Fed policy. Overall, my recommendation to investors remains this: Don’t chase the highflyers and instead focus on high-quality businesses at reasonable prices, hold inflation and dollar hedges like gold, silver, and bitcoin and be prepared to exploit any market pullbacks—such as by buying out-of-the-money protective put options in advance while VIX is low and then accumulating those high-quality stocks as they rebound, fueled by massive capex in AI, blockchain, infrastructure, energy, and factory onshoring, leading to rising productivity, increased productive capacity (“duplicative excess capacity,” in the words of Treasury Secretary nominee Scott Bessent, would be disinflationary), and economic expansion.
And regarding “high-quality businesses,” I mean fundamentally strong, displaying a history of consistent, reliable, resilient, durable, and accelerating sales and earnings growth, positive revisions to Wall Street analysts’ consensus estimates and a history of meeting/beating estimates, rising profit margins and free cash flow, high capital efficiency (e.g., ROI), solid earnings quality and conservative accounting practices, a strong balance sheet, low debt burden, competitive advantage, and a reasonable valuation compared to its peers and its own history.
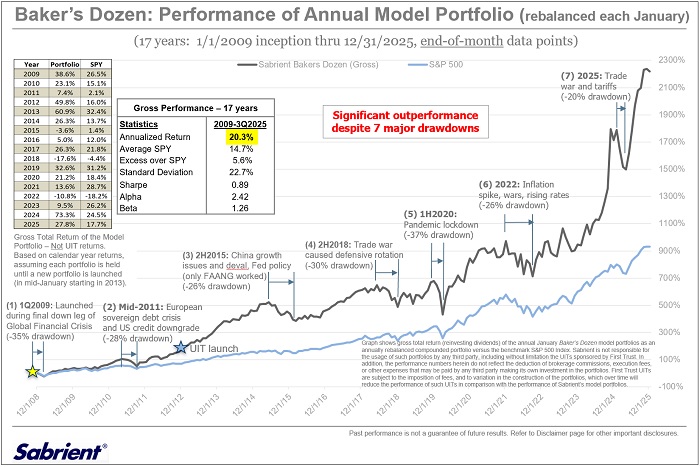
These are the factors Sabrient employs in our quantitative models and portfolio selection process. As former engineers, we use the scientific method and hypothesis-testing to build models that make sense. We are best known for our Baker’s Dozen growth portfolio of 13 diverse picks, which is designed to offer the potential for outsized gains. We have been tracking a Baker’s Dozen Annual Model Portfolio, rebalanced each January since 2009 (during the final stages of the Global Financial Crisis when I first proposed the idea of publishing an annual “Top Picks” list). In mid-January 2013, it began to be packaged and distributed to the financial advisor community as a unit investment trust (UIT) by First Trust Portfolios—along with three other offshoot strategies for value, dividend, and small cap themes—and today it is issued quarterly as a 15-month UIT. In fact, the new Q1 2026 Baker’s Dozen portfolio will launch on 1/20/2026. Until then, the Q4 2025 portfolio remains in primary market.
Below is the 17-year chart comparing the theoretical gross total return of the annual model portfolio versus the S&P 500 from 2009 through 2025. As shown in the table, it reflects an average annual gross total return of +20.3% versus +14.7% for SPY. For calendar year 2025, the Model Portfolio was up +27.8% vs. +17.7% for SPY, following a 2024 gross total return of +73.3% vs. +24.5% for SPY.
Also, because small caps tend to benefit most from lower rates and deregulation, and high dividend payers become more appealing as bond alternatives as interest rates fall, Sabrient’s quarterly Small Cap Growth and Sabrient Dividend (a growth & income strategy) might be timely investments. And notably, our Earnings Quality Rank (EQR) is a key factor in each of our strategies, and it is also licensed to the actively managed, low-beta First Trust Long-Short ETF (FTLS) as a quality prescreen.
Sabrient founder David Brown reveals the primary financial factors used in our models and his portfolio construction process in his latest book, Moon Rocks to Power Stocks: Proven Stock Picking Method Revealed by NASA Scientist Turned Portfolio Manager, which is available on Amazon (Kindle or paperback) for investors of any experience level. David describes his path from NASA engineer in the Apollo Program to creating quantitative multifactor models for ranking stocks and building stock portfolios for four distinct investing styles—growth, value, dividend, or small cap.
Here is a link to this post in printable PDF format, as well as my latest Baker’s Dozen presentation slide deck and my 3-part series on “The Future of Energy, the Lifeblood of an Economy.” As always, I’d love to hear from you! Please feel free to email me your thoughts on this article or if you’d like me to speak on any of these topics at your event! Read on….
Market Commentary
I began my January 2025 post one year ago, “Investors enter a transitional year with a mix of hope, angst, and optimism,” by saying:
Strong US stock market performance has been driven, in my view, by the combination of: 1) a dovish Fed, money supply growth and global capital flight to the US (“shadow liquidity”), 2) expectations of lower energy costs and falling inflation, 3) AI exuberance and capex and the promise of massive productivity gains, and 4) growing optimism about technologies like nuclear energy, blockchain, quantum computing, robotics, autonomous vehicles, and genomics. But after two consecutive years of 20%+ gains in the S&P 500 for the first time since 1998 (and even greater gains for the Tech-dominated Nasdaq 100)—greatly outperforming all prominent forecasts—investors are looking ahead to a year that arguably brings even greater uncertainty and a wider range of expected outcomes, ranging from a recession and bear market to a continued bull run within a Roaring ‘20s-redux decade….
The bull case sees an economy and stock market driven by business-friendly fiscal policies under Trump 2.0 including deregulation, lower corporate tax rate, and restoration of civil liberties and constitutional freedoms should also be stimulative and might fuel disinflation (as opposed to the inflation that many critics expect). Trump’s energy policies are also likely to be disinflationary. Also, bulls see capital flight into the US (most of which stays outside our banking system and therefore is not captured by M2), huge corporate capex, less deficit spending (and politburo-style “malinvestment” and mandates), and strong productivity growth, and rising velocity of money that offsets any tightening in money supply growth…. The incoming administration…is suggesting a new tack characterized by smaller government and the unleashing of animal spirits in the private sector, with the goal of achieving GDP growth north of 4%....
So, for 2025, I expect strong fiscal and monetary policy support for economic growth (albeit with some pains and stumbles along the way as government spending is reined in) as well as moderating inflation as shelter costs recede, military conflicts are resolved (war is inflationary), and deflationary impulses arrive from struggling economies in China and Europe. I also expect stocks and bonds will both attain modest gains by year end (albeit with elevated volatility along the way)….
If I am right and the bottom in 10-year Treasury price (i.e., peak yield) is nigh…we likely would see the dollar decline, gold rally, and bond yields fall, which would be a tailwind for growth stocks. Ultimately, I expect the terminal fed funds rate will be around 3.50% (from today’s 4.25-4.50%)…and I think the 10-year will gradually settle back below 4.25%.
Indeed, for full-year 2025, the dollar declined -9.4%, gold rallied +63.7%, the 10-year yield fell -9.0% to close the year at 4.16%, the FFR fell to 3.50-3.75%, S&P 500 Growth rallied +20.3% (versus +11.1% for S&P 500 Value). So, my expectations were right on the money. And looking ahead, much of what I said last January about the economy and markets under the new administration is still valid and unfolding as expected. The one exception might be the dollar, which seems to have firmed up (despite the broad debasement of all fiat currencies).
2025 stock market in review:
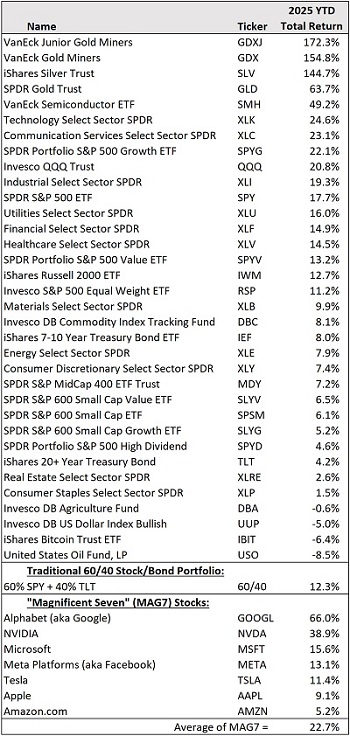
Total return for the S&P 500 missed the 20% threshold, falling back during the last few days of the year to hit +17.7% (+16.4% on the price index) for the year—still quite respectable of course after exceeding 20% in both 2023 and 2024. The Nasdaq 100 did manage to achieve a +20.8% total return, and the traditional 60/40 stock/bond allocation returned +12.3%—assuming SPDR S&P 500 ETF (SPY) for stocks and iShares 20+Year Treasury Bond ETF (TLT) for bonds. Notably, the top performers included VanEck Junior Gold Miners (GDXJ), VanEck Gold Miners (GDX) +154.8% iShares Silver Trust (SLV) +144.7%, and SPDR Gold Trust (GLD) +63.7%—so, the miners substantially outperformed the metals. Here is a table of ETF proxies for the 2025 performance of various asset classes, caps, and styles:
No doubt, precious metals were the big story of 2025. Gold opened the year near $2,624 per ounce and closed around $4,340, delivering one of the strongest calendar-year performances of any major asset ever. This pushed gold to the center of advisors’ portfolio conversations. However, looking back on history, from 1980 through the end of 2019 (pre-pandemic), gold showed about 200% total return, or 2.7% average annual return, while the S&P 500 delivered roughly 8,200%, compounding at 12.2% average annual return. Of course, gold is much more cyclical, having seen a handful of large, macro-driven surges rather than the steady-Eddy compounding of stocks. Its main role has capital preservation when confidence in the global economy or financial system is low. Silver is both a precious and industrial metal, and its extraordinary performance has been driven by a mix of booming industrial demand, constrained mine supply, safe-haven accumulation, and speculative momentum trading.
In contrast, bitcoin (and crypto broadly) took the year off. Cryptocurrencies have a similar role providing diversification and capital protection in the face of the gradual debasement of fiat currencies. But as crypto market structure, regulatory clarity, broadening use cases, and institutional adoption continue to advance, the potential for both compounded returns and asymmetric upside should help differential crypto from gold as an investment rather than just a portfolio hedge.
For equities, although the major indexes posted solid returns, they continued to display narrow breadth, with large caps and growth stocks greatly outperforming small-mid caps and value stocks given relatively tight financial conditions and slower earnings growth in those segments. Breadth showed sporadic signs of improving but peaked in the summer and then diverged from price thereafter, with non-Tech sectors and dividend payers largely priced with skepticism. However, the MAG7 stocks showed markedly lower correlations than typical, ranging from top performers Alphabet (GOOGL) +66.0% and NVIDIA (NVDA) +38.9%, to bottom performers Apple (AAPL) +9.1% and Amazon.com (AMZN) +5.2%.
According to Goldman Sachs, “The past few months have seen the stock prices of AI hyperscalers diverge: Investors have rotated away from AI infrastructure companies where operating earnings growth is under pressure and where capex is being funded via debt. At the same time, investors have rewarded companies demonstrating a clear link between capex and revenues, such as some of the world’s biggest cloud platform operators.”
The good news in all this is that Q4 saw a more sustained broadening of leadership, with small caps leading the way, after years of underperformance, finally eclipsing their November 2021 highs and continuing higher into the new year. Cyclical sectors like Industrials and Financials benefited from this shift, while value-oriented names narrowed the performance gap with growth.
Sector leadership also diversified. Technology and Communication Services have been winners in this AI cycle, while Financials benefited from improved credit conditions and a steeper yield curve. Basic Materials enjoyed soaring prices in both precious metals and industrial metals, but Energy lagged as oil prices declined over the year. Utilities rode the coattails of the AI datacenter capex and its rapidly growing thirst for power generation, pushing up valuations despite still-modest near-term earnings growth rates. Looking ahead, the large-cap value-to-growth ratio may have bottomed with a valuation discount near an historic level. Historically, accommodative monetary policy supports value stocks, particularly if the Fed is not reacting to a recession.
As for foreign capital flow, any foreign investor will tell you there is no other place in the world to invest capital for the innovation and expected returns than the US (aka “American exceptionalism”) given our entrepreneurial culture, rule of law, defense of property rights, strong focus on building shareholder value, disruptive innovation, low interest-rate exposure, global scalability, wide protective moats, and our reliable and consistently strong earnings growth, free cash flow, margins, and return ratios, particularly among the dominant, cash flush, Big Tech titans, which continue to use their piles of cash to seed AI startups and other disruptive technologies. Notably, the US boasts more than 50% of the world’s privately owned late-stage start-ups valued at over $1 billion (aka “unicorns”) and leads in R&D spending and patent applications.
However, it’s not just the Technology sector. As BlackRock wrote in their Q2 2025 Equity Market Outlook, “Commentators will often cite the prevalence of a large number of tech companies in the U.S. as the driver of U.S. equity dominance. But our analysis points to wider breadth in U.S. quality. Current return on tangible invested capital (ROTIC), a proxy for a company’s ability to allocate capital for optimal profitability, is significantly higher in the U.S. than elsewhere in the world, suggesting quality exists not in pockets but across sectors.”
Stock valuations:
The Buffett Indicator is famed investor Warren Buffett’s preferred market valuation metric. It is simply the ratio of the total stock market capitalization to GDP, without regard to changes in productivity, margins, or interest rates. It is now approaching 230%, which is considered “significantly overvalued.” It now exceeds pandemic recovery peak of 200% in 2021 and is well above 140% of the Internet Bubble peak in 2000. According to The Motley Fool, this is the fourth time in the past 60 years that the indicator sits two standard deviations above its historical trendline, and all three previous such instances were followed by declines of at least 25%.
The US stock market capitalization now makes up roughly 60% of the world index, the 50 largest companies in the US account for over half of total US market cap, and the MAG-7 stocks represent about a third of total US market cap. The mega-cap cohort now boasts ten members of the $1 trillion market-cap club encompassing the MAG7 companies NVIDIA (NVDA), Alphabet (GOOGL), Apple (AAPL), Microsoft (MSFT), Amazon.com (AMZN), Meta Platforms (META), and Tesla (TSLA), plus newcomers Broadcom (AVGO), Taiwan Semiconductor Manufacturing (TSM), and Berkshire Hathaway (BRK-B). Lilly & Co (LLY) briefly broke above the $1 trillion mark but has pulled back (for now).
However, because many Tech titans tend to have some combination of high earnings growth, free cash flow growth, profit margins, and productivity, “asset light” business models (focused on intangible assets like IP, software, data), outsized cash balances, low debt, global market penetration, persistent secular growth (rather than cyclicality), and wide economic moats (pricing power, brand loyalty, recurring revenue streams, and competitive advantage), they are generally looked upon as defensive “safe haven” stocks rather than risky plays, even at what traditionally would be considered elevated P/E multiples. And according to DataTrek Research, incredibly strong profit margins and ROE among the mega-cap Tech leaders has pushed the S&P 500 to a structural net margin (income after tax divided by revenue) increase from 10% to 12% over the last 10 years, which serves to support the rise in the index’s forward P/E over that timeframe from roughly 16x to 23x today.
This is why I don’t put much validity in comparing index P/Es through history, or using the Shiller Cyclically Adjust P/E (CAPE), because the composition of the index has evolved greatly. Today, the indexes are dominated by companies with the qualities listed above, as opposed to the industrial conglomerates and oil companies in days of yore, which were asset-heavy, capital intensive, cyclical, slower growth, and value-oriented, paying solid dividends. In 1980, the five largest companies were IBM, AT&T, Exxon, Standard Oil of Indiana, and Schlumberger, and 7 of the top 10 were oil companies. By 2000, at the height of the dot-com bubble, the five largest were Microsoft, GE, Cisco Systems, ExxonMobil, and Intel, but by 2002, the five largest were GE, ExxonMobil, Microsoft, Walmart, and Pfizer. In 2000, the aggregate forward P/E and ROE for the Big Tech dominators were around 70x and 30%, while today they are around 30x and 75%.
But even if the mega-caps are poised to maintain their valuations during market uncertainty or turmoil, that doesn’t necessarily mean they will provide the best upside in a rising market going forward. After the S&P 500’s terrific bull run over the past three years in which the MAG7 accounted for roughly 75% of the index’s total return, I think this year might see the equal-weight RSP outperform the cap-weight SPY.
If you compare the equal-weight versions of the major indexes to take away that dominance of the MAG7 mega-caps, the valuations appear to be much more attractive. Forward P/E for the cap-weight S&P 500 (SPY) is 23.2x and Nasdaq 100 (QQQ) is 26.6x, but the cap-weight S&P 500 (RSP) is 17.9x and Nasdaq 100 (QQQE) is 23.0x. In addition, the S&P 400 MidCap (MDY) is 17.5x, the Russell 2000 (IWM) is 16.7x, and the more quality-oriented (profitability required for admission in the index) S&P 600 SmallCap (SPSM) is 15.7x.
Interestingly, DataTrek Research observed that, “Every US Big Tech stock trades more on prospective future earnings growth than these companies’ current profitability. The average breakdown is 67% ‘Future Value’ and just 33% ‘Present Value’… [But] the S&P 500 ex-Big Tech trades for 74% Present Value, with only 26% related to expected future earnings improvement.”
Notably, the Energy sector—and particularly oil price—has lagging badly for quite some time. To illustrate the extent of the divergence, Robert Armstrong in the Financial Times created the following chart:
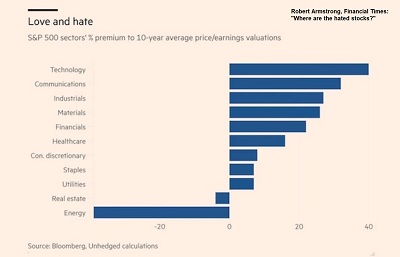
Looking ahead, laggard Energy (and perhaps Real Estate) may be an opportunity for outperformance, particularly given the evolving macro landscape in addition to potential mean reversion. Also, it seems the case for small caps includes mean reversion from its historic divergence from large caps, more attractive valuations, tight credit spreads (suggesting low default risk), and a move toward greater portfolio duration (which would also benefit Treasury bonds and growth stocks beyond the low debt, “safe haven” Tech titans). However, you can’t just throw a dart to choose small caps since many are debt-ridden and unprofitable (40% of the Russell 2000). Quality really matters in this cohort.
AI Bubble talk:
The WSJ wrote in November (after another blowout earnings report) that when it comes to NVIDIA (NVDA), “The law of large numbers hasn’t seemed to catch up to NVIDIA yet. [CEO Jensen] Huang projected $500 billion in sales for just two generations of the company’s AI chips over a two-year period ending next year…[and] suggested that such an aggressive target could actually prove conservative…. And the recent haircut to its stock price after hitting a $5 trillion market cap milestone has put its stock price at just about 29 times projected earnings for the next four quarters—about 19% below its three-year average, according to FactSet.” The company controls more than 90% of the AI accelerator market and has expanded across the full stack (chips, networking, software, services).
Huang said, “Blackwell sales are off the charts, and cloud GPUs are sold out. Compute demand keeps accelerating and compounding across training and inference—each growing exponentially. We’ve entered the virtuous cycle of AI. The AI ecosystem is scaling fast—with more new foundation model makers, more AI startups, across more industries, and in more countries. AI is going everywhere, doing everything, all at once.” (Wait, wasn’t that a movie title?) Matt Britzman of Hargreaves Lansdown opined, “There are certainly pockets of the AI space where valuations needed to take a breather, but NVIDIA is not in that camp.”
And as the inevitable encroachment of eager competitors progresses, such as Advanced Micro Devices (AMD)—whose CEO Lisa Su proclaimed her belief that the datacenter market will be worth $1 trillion by 2030—NVIDIA still retains a wide moat. At the Annual CES show in Las Vegas, Huang again regaled the huge demand for memory and storage. He also unveiled production-ready next-gen AI hardware, described open AI models in areas like healthcare, climate, robotics, and autonomy (and NVDA as a full-stack provider), and how AI generally is moving beyond computer screens into the physical world of robots, automation, and systems that can perceive, plan, and act—reaching far beyond conventional computing.
Looking back to the 1990s Internet Bubble, there was a similar surge in capital spending, investor optimism, equity valuations, and leverage. However, profitability and balance sheet strength declined while market volatility and credit spreads rose in a sustained way, which is not yet the case today. Famed economist and NY Times columnist Paul Krugman famously wrote in the midst of the Internet Bubble, “The Internet’s impact on the economy has been no greater than the fax machine.” And in 1987, Nobel-winning economist Robert Solow famously opined, “You can see the computer age everywhere but in the productivity statistics.” At the time, US productivity growth was just +0.5% and averaged just +1.4% during 1987–1995, but it soon kicked into gear with the Internet buildout, and indeed the latest reading for Q3 2025 came in at a robust +4.9% annualized. Such is often the mindset of “expert” naysayers—who lack the entrepreneurs’ optimistic vision—when capex and valuations seem to be well beyond what anyone can imagine justifying the eventual impact of a new technology on the economy and society at large.
In refuting today’s AI bubble theory, Jensen Huang sees three main use cases for AI: 1) transitioning of older compute infrastructure (like data processing, ad, and search), 2) the many new applications that continue to emerge, and 3) the proliferation of “agentic AI” applications that mainly run autonomously. But perhaps the biggest obstacles to NVIDIA’s continued trajectory (and by extension, the entire AI investment theme) are: 1) the ability of key customers like startups OpenAI and Anthropic to scale their revenues and cash flows and produce ROI, and 2) the speed of the electricity generation infrastructure buildout for all those power-hungry datacenters.
In fact, AI-related earnings growth has been hampered by capacity constraints rather than a lack of demand, given that every chip that comes off the assembly line has an immediate buyer—in contrast to the surplus bandwidth of the Internet Bubble comparison. This imbalance of constrained capacity vs. eager demand is driving the massive capex in AI infrastructure. Still, at some point, AI applications will have to prove out all this investment, i.e., when it becomes a cost center for companies rather than simply a growth driver from plant and equipment construction and purchases.
In addition, there has been much attention on famed short-seller Michael Burry’s view that the hyperscalers are artificially boosting stated earnings by massively understating depreciation expense for datacenter equipment by stretching the useful life estimates of their hardware (servers, GPU clusters, etc.) to perhaps 6 years whereas the actual product/asset cycles are more like 2-3 years. But, the All-In Podcast crew of tech-entrepreneur billionaires countered that while GPUs and servers indeed evolve rapidly, the broader infrastructure (e.g., datacenters, networking, power, racks, etc.) are being used in various capacities beyond the first few years of “training” by employing them for other workloads (e.g., inference, storage, networking), with little risk of hardware being written off prematurely. They insist there is no compelling evidence that hyperscalers are systematically and significantly employing deceitful accounting practices.
While strong corporate earnings have been driven more by margin expansion than sales growth, it bodes well that net margins for the S&P 500 tied the record high of 13.1% (from Q2 2021) and were well diversified, with 7 of the S&P 500’s 11 sectors posting better net margins than their 5-year averages. Indeed, the Big Tech juggernauts have demonstrated how to use operating leverage to scale revenues while expanding margins to earn their higher P/E multiples. Overall, the Tech sector’s free cash flow margin is nearly 20% (which is more than double its late-1990s level), so record high profit margins and rising earnings estimates (like net margins, also exceeding 13%) may indeed justify today’s high valuations and tight credit spreads.
Roundhill Investments recently observed, “…highly profitable companies are commanding premium prices from investors. Within the S&P 500, the companies with the highest next-twelve-month price/earnings ratios [NTM P/E] also have the highest expected profit margins, with an average of 21.1%. The lowest multiple S&P 500 stocks have an average NTM profit margin of 14.6%, a difference of 6.5%. With such a disparity between the most and least profitable S&P 500 stocks, investors appear to be incentivized to pay up for high margin stocks…. For investors, the focus should shift from hoping for higher multiples to identifying firms with real earnings power and efficiency.”
Finally, regarding the prevailing narrative that Gen AI will eliminate far more jobs than it creates, I am in the camp of entrepreneur and Trump Administration AI & Crypto Czar David Sacks, who believes AI will increase demand for knowledge workers (despite some early job losses) in accordance with “Jevons Paradox,” in which increasing efficiency and falling costs of a resource lead to increasing demand, rising profitability, and more hiring as use cases broaden and become more viable and economic.
GDP, jobs, and corporate earnings:
The latest trade deficit (for October) came in extraordinarily low—$29.4 billion, the lowest since June 2009—due primarily to rapid onshoring of pharmaceuticals manufacturing (thus reducing imports) and large exports of non-monetary gold and precious metals. Over the past year, exports have risen 12.1% while imports have fallen 3.6%. Of course, President Trump has targeted a lower trade deficit and less dependence on tenuous global supply chains, adding redundancy and diversification, primarily for national security purposes.
The initial BEA estimate for real GDP in Q3 2025 came in at an impressive 4.3% annualized growth. With the federal government shrinking and the private sector taking the reins, the economy is no longer overly reliant on low-ROI government deficit spending, earmarks, and boondoggles and instead is prospering from a greater focus on organic growth and efficient capital allocation from a vibrant private sector. Under the previous administration, the private sector contributed only around 2% to GDP growth and was heavily influenced by spending bills (picking & choosing winners) rather than organic growth. But it is being reinvigorated by the new administration’s policies and incentives. Looking ahead to Q4 2025, the Atlanta Fed’s GDPNow model is forecasting a robust 5.3% (as of 1/14/26).
The BLS nonfarm payrolls report for December was interesting. It showed 268,000 fewer government jobs vs. year-end 2024 (the largest annual decrease since 1990), but also the civilian employment metric (which includes small business startups) showed an increase of 2.4 million for full-year 2025. That’s impressive, and those two numbers (falling government jobs and rising civilian employment) are reflective of the Trump Administration’s goal of deemphasizing Nanny-State government spending and letting the private sector retake its rightful place as the primary engine of growth, which is expected to create more private sector jobs than are lost in the government. This trend of falling federal employment follows the large number of “deferred resignations” that finalized in October when federal payrolls fell by 162,000. Moreover, the labor force participation rate (people either working or looking for work) has continued to expand despite strict immigration enforcement.
Impressively, US productivity growth accelerated at a +4.9% annualized rate, and output per hour is rising faster than total hours worked. Notably, according to the National Association of Manufacturers, every $1 spent creates a total impact of $2.65 to the US economy, and every new factory worker leads to 4.8 workers added to the economy. That’s the kind of high ROI the private sector brings (compared to low-ROI government spending (on entitlements and boondoggles).
Look no further than China for an example of how excessive reliance on government reduces ROI. Famed futurist and economist George Gilder recently wrote, “China’s national return on capital has declined materially since Chairman Xi has been in power. Under Xi, investment has been redirected toward state-owned and state-favored enterprises with persistently lower returns. In the industrial sector, private firms earned returns on assets of roughly 9-11% in the 2000s, compared with about 4-6% for state-owned firms (SOEs); by the mid-late 2010s, those figures had fallen to roughly 7-8% and 3-4%, respectively. Yet capital investment continued to shift toward the state’s pets…. Under Xi, China has required 50-100% more investment to generate a unit of growth than it did a decade earlier.”
Also, the November BLS Job Openings and Labor Turnover Survey (JOLTS) report was recently released showing that the number of government workers collapsed to the lowest level since early 2021, which is good, but it also showed that we now have a 0.9 ratio of job openings to unemployed workers, which is the first sub-1.0x print in four years. However, the ADP National Employment Report for December was also released reflecting a hiring recovery. In the words of ADP’s chief economist, “Small establishments recovered from November job losses with positive end-of-year hiring, even as large employers pulled back.” So, perhaps the December JOLTS report (due out on 2/3/26) will do so as well.
For now, the jobs market remains stagnant in a “no hire, no fire” balance, as layoffs remain relatively low but finding a new job is harder. The New York Fed Survey of Consumer Expectations illustrated that respondents are more pessimistic than ever about quickly finding a new job. As economist Ed Yardeni pointed out, this jobs market along with the affordability crisis has depressed consumer confidence. New Federal Reserve governor and FOMC member Stephen Miran believes Fed policy remains overly restrictive as it is lulled to sleep by the “boring” jobs data; he is advocating for an additional 100 bps of rate cuts this year.
As we begin Q4 2025 corporate earnings reporting season, FactSet estimates S&P 500 EPS of $70.34, an earnings growth rate at a solid +8.3% YoY (led by InfoTech at +16.5% and Financials at +12.3%), a revenue growth rate of +6.1% YoY, net profit margin of 12.4%. Not bad. It would mark the 10th consecutive quarter of earnings growth for the index. But looking ahead to full calendar year 2026 (CY2026), projections reflect an aggregate of $311.30/share and a whopping +15.3% earnings growth for the S&P 500, with the MAG7 projected to grow earnings by +22.7% and the other 493 companies combining for +12.5%. All 11 sectors are expected to show positive YoY earnings growth for CY2026. Impressive.
Inflation and Fed policy:
I like to look at alternative metrics to get a better sense of the current trend rather than rather than comparing today’s price index with where it was 12 months ago. They include annualized 3-month rolling averages of PPI, CPI, Core CPI, and Core PCE (the Fed’s preferred metric). I also like the Harmonized Index of Consumer Prices (HICP), which is a European methodology, but for some reason the BLS has stopped publishing it. Of course, the lengthy government shutdown has put the timing of data gathering and reporting out of kilter. Nevertheless, the two charts below show the latest YoY inflation metrics and rolling 3-month (MoM) annualized.
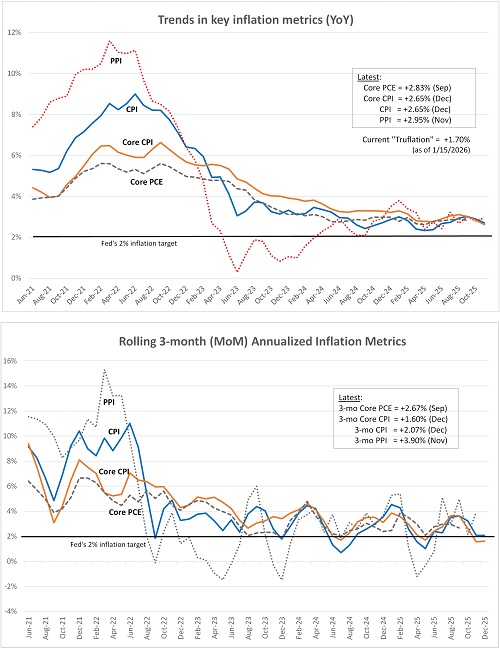
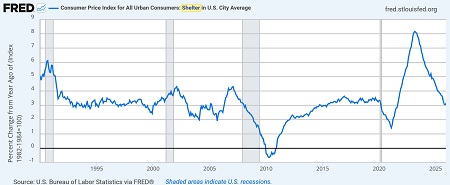
It looks to me like the gyrations are back to normal, although still slightly more elevated than most policymakers want. The most recent of the metrics is December CPI and Core CPI, which came in at 2.65% YoY and a 3-month rolling average annualized trend of 2.07% for CPI, and 2.65% YoY and 3-month trend of 1.60% for Core CPI. The latest reading for PPI is November, which came in at 2.95% YoY and 3-month trend of 3.90%, largely driven by the biggest surge in energy prices in two years. December PPI will be released on 1/30. As the chart illustrates, PPI tends to be more volatile month-to-month, but the amplitude seems to be settling down. Both CPI and PPI have averaged around 2.6% over the past 15 years, and they seem destined to convergence near that 2.6% level or even lower. Notably, although New Tenant Rents have been falling for some time, it’s finally starting to show up in the long-lagged and high-impact Shelter cost component of CPI, which is back down to pre-pandemic levels (3.15%), as shown in the chart below.
A corroborating metric is the real-time, blockchain based Truflation metric, which is updated daily based on 30 million data points and tends to presage CPI by several months—and is much better at reflecting current housing costs than CPI or PCE. As of 1/15, it has fallen to 1.70%. On 1/13, the firm wrote, “Truflation's real-time US index is already at 1.74% YoY…driven by the Housing sector cooling faster than the BLS surveys can capture… The gap between the real price data from Truflation and household surveys from the BLS persists. October and November MoM data are missing due to the government shutdown. November data has been extrapolated to some extent….”
So, I expect CPI to continue to gradually recede. And as mentioned earlier, the GSCPI supply chain pressure index has settled around the zero line since early 2023, and secular disinflationary trends and productivity improvements have resumed.
The stable/firmer dollar and slowing liquidity growth are inhibitors of global economic growth. But this has been partially offset by rising velocity of money (transactions per dollar in circulation), which in the US is at its highest level since Q4 2019, as displayed here by the St. Louis Fed. Also, the US has benefited from foreign capital flight, the majority of which does not show up in our M2 money supply thus creating “shadow liquidity” that has helped inflate our capital markets—albeit at the expense of the rest of world (ROW). As inflation eases and central banks cut interest rates, the US and India (the world’s fastest growing major economy) continue to drive global economic activity while Europe and China (among others) struggle to reinvigorate growth.
Of course, the FOMC is trying to find a balance between the stagnant jobs market and sticky inflation. “Affordability” has become the political term du jour. To help address affordability, the president just recently announced his intentions to: 1) have Fannie Mae and Freddie Mac purchase $200 billion in mortgage-backed securities, 2) restrict private equity firms from buying single family homes (typically all-cash buyers, which crowds out individuals who need to carry mortgages), and 3) put a 10% cap for one year on the interest rate credit card companies can charge (this will be a tough one to implement). Regardless, home affordability has been improving, with 30-year mortgage rates trending lower and now sitting near 6.16% (as of 1/8/26)—rates haven’t been below this level in a sustained way since September 2022—and the median price of an existing home is up only around 1.2% versus a year ago.
I have spoken in the past about yield curve control (YCC) and manipulation by the Treasury by having virtually all new issuances in short-dated T-bills, which kept supply low on the long end, thus driving down bond yields and creating a maturity mismatch. Going forward, though, short-term supply will need to be more limited to drive down rates (through open market operations), and the yield curve should steepen further—although I expect it will be driven by lower short-term rates and a slight rise in term premium (reflective of investor concerns about high debt and deficits and perhaps some “bond vigilantes,” i.e., investors who don’t think the Fed should be cutting).
Some commentators insist that inflation is required to achieve economic growth and rising living standards, which seems to imply that the inflation rate equates to the nominal growth rate. But I disagree. The often-used Keynesian demand-side government stimulus has never been a durable solution for growing real productive capacity. Indeed, real economic growth certainly occurs without inflation. Think of those many low inflation years of the pre-pandemic past. If greater value of goods and services are produced per worker through higher productivity, better quality, and more choices, it doesn't have to mean higher prices.
In fact, rising productivity through improved technology tends to be disinflationary, as we have seen in so many consumer products (like TVs and electronics). As economist Ed Yardeni likes to say, “Productivity is like fairy dust. It makes everything better. When its growth increases, that boosts real GDP’s growth rate, moderates inflation, allows real hourly compensation to rise faster, and lifts profit margins. That’s what the Roaring 2020s is all about.”
The AI buildout is boosting productivity, and deregulation and incentives for oil & gas development have contained oil prices, all of which has helped constrain inflationary pressures. And hopes for progress in the Russia-Ukraine conflict drove oil prices lower, reinforcing the broader disinflation narrative. And yet, electricity prices continue to rise. This is not simply due to rising demand from AI, much of which will be fulfilled by collocated/dedicated power sources. Rather it will be due to the disproportionate reliance on wind, solar, and battery storage capex, which is unreliable and non-dispatchable compared to fossil fuels and nuclear. Such projects not only allow the utility companies to take advantage of the lucrative Biden-era subsidies for wind and solar that are set to phase out in the next five years.
As for energy prices, “Doomberg” on Substack opined, “It has been nearly two years since we first published 'Peak Cheap Oil Is a Myth,' an article that created some controversy among die-hard true believers who are convinced a catastrophic decline in oil production is perpetually just around the corner…. As we have consistently argued, a superior mental model is to assume that there is an infinite supply of hydrocarbon resources, that oil and gas companies are technology superpowers that just happen to produce energy, and that the long-term real price of all commodities is therefore lower.”
Final comments:
Allow me to repeat my “Final Comments” section from January 2025. Although they were written exactly one year ago, they are very much still valid today:
Economic revitalization—through much lower dependency on government spending, supportive fiscal policy, and a normalization in interest rates—would reduce the hyper-financialization of our economy and lead to a renaissance among small businesses and our vast middle class….
The problems with Trump 1.0 included: 1) a lot of the freed-up cash from tax cuts went to stock buybacks rather than new capital investments and hiring, and 2) there was insufficient rollback of government overreach to stimulate productive investment. Government…is an Angry Beast that seeks more size, power, and control.
So, I believe the path to sustainability under Trump 2.0 will require an earnest 3-pronged attack: 1) "inflate away" the debt with somewhat elevated inflation (perhaps in the 2.5 to 3% range), 2) "cut away" government waste and spending..., and 3) "grow away" the debt by truly stimulating real organic, private-sector-led, productivity and economic growth with lower tax rates and deregulation. Capital tends to flow to where it is most welcome and earns its highest returns.
Tolerating somewhat elevated inflation can be acceptable if we are simultaneously incentivizing and nurturing strong growth through supportive monetary policy (modest interest rates and gradual money supply growth in line with GDP growth) and fiscal policy (lower tax rates and less red tape) while slashing our bloated federal (and state) government would return precious capital to consumers and the private sector for wise, high-return investments in projects that create robust organic growth in GDP, jobs, wages, free cash flow, and earnings…and, by extension, tax receipts—because as DataTrek Research has observed, “Regardless of individual and corporate tax rates, Federal receipts have averaged 17% of GDP since 1960. Economic growth is the only reliable way to increase government revenues.”
So, tax cuts can pay for themselves if they can help supercharge real economic growth—and by extension, productivity, margins, corporate earnings, wages, and tax receipts. A productivity growth boom boosts real GDP growth, keeps a lid on inflation, drives up real labor compensation, and widens profit margins. So, the [deficit] problem is not the tax cuts per se, but the lack of sufficient complementary support for economic growth.
Cato Institute study, which supports Trump’s proposed 15% corporate tax rate, concluded: “Because corporate taxes are so economically destructive, lowering or eliminating the tax altogether may not have the fiscal consequences some fear. Trump and Congress should build on the success of the TCJA by repealing targeted subsidies, like those in the Democrat’s Inflation Reduction Act, and replace them with broad-based business tax cuts that will make America the most attractive place in the world to do business.”
Indeed, if we get out of own way, as they say, and stop the malinvestment of wars, boondoggles, and unwinnable battles against a changing climate, we can allow the magic of an unleashed private sector to do its thing in creating disruptive innovation and productivity gains from so many amazing and previously unthinkable but now rapidly advancing technologies, including generative AI, artificial general intelligence (AGI), quantum computing, blockchain and cryptocurrency, 5G, IoT, Big Data, Web 3.0, cloud computing, digitization, ecommerce, video conferencing, augmented/virtual reality (AR/VR), computer vision (CV), gaming, networks, sensors, 3-D printing, robotics, automated manufacturing, autonomous vehicles, horizontal drilling & fracking, clean fuels, green/renewable energy, nuclear fusion, electric/hydrogen transportation, space exploration, cybersecurity, decentralized finance (DeFi), fintech, nanotech, biotech, telehealth, precision medicine, computational biology, genomics, genetic sequencing, biologics, and the rapid development of diagnostics, therapeutics, and vaccines that may render future pandemics obsolete.
Again, I think these comments still ring true for 2026.
Our massive public debt has led the federal government to enact policies that juice economic growth, streamline permitting and cut red tape, boost productivity, curb energy prices, control inflation, reduce interest rates, and loosen monetary conditions, with little in the way of dreaded austerity (except for shrinking the size of government itself). To that end, the AI buildout is boosting productivity, while deregulation and support for oil & gas development have contained energy prices, and all of this has helped constrain inflationary pressures, while “financial repression” has helped lower government debt servicing costs. Financial repression is a set of government policies that artificially lower the cost of borrowing and help government to reduce its debt, including interest rate ceilings, capital controls, yield curve control (refinancing federal debt mostly on the short end of the curve), and directed lending (to support industrial policy). Of course, some worry that all the economic stimulus could lead to a “blow-off top” in stocks and other risk assets like in 1999. But as I discussed in the Stock Valuations section, we seem to be far away from that as the comparison falls short in many ways.
History shows that debt used for funding productive assets, like infrastructure, innovation, and education, can sustain growth and even pay for itself over time. But borrowing to finance unproductive entitlements and debt service does not. Unfortunately, the political and demographic realities make it nearly impossible to reverse course without severe economic fallout. Unless policymakers redirect fiscal priorities toward investment in productive capacity, the economy will remain trapped in a cycle of rising obligations, low growth, and declining returns. Fortunately, private sector-led “disruptive innovation” offers a way out, most notably the AI transformation. If leveraged wisely, including targeted investment and smart policy, AI can lift productivity, restore growth, and ease the fiscal strain.
As the full slate of rules under the OBBBA kick in (many of which are retroactive to 1/1/25), big tax refunds will be issued, and more money will be left in the pockets of individuals and businesses. For instance, we now have a higher standard deduction (plus an additional deduction for seniors aged 65 and older), no tax on tips, overtime, and Social Security (means-tested), US-made new car loan interest deduction, permanent extension of existing individual income tax brackets (under the TCJA of 2017 that were set to expire) and higher thresholds for some of those tax brackets, expanded Child Tax Credit structure, higher SALT deduction cap, and full first-year expensing for corporate purchases of new equipment/R&D (rather than multiyear depreciation).
From an investor standpoint, I think the core of an equity portfolio still should be US Big Tech stocks, given the entrepreneurial culture of US, disruptive innovation, and world-leading ROI that attract foreign capital, as well as Big Tech’s huge cash stores, wide moats, global scalability, resilient and durable earnings growth, free cash flow, margins. But a broadening market should also offer other (and likely better) opportunities among the AI infrastructure builders (datacenters and networking equipment) and power generators (beyond the giants and hyperscalers) from Industrials, Utilities, and Energy sectors, as well as small/mid-caps, value, quality, cyclicals, and equal-weight indexes. In addition, you might consider high-quality homebuilders, regional banks, insurers, energy services, and healthcare/biotech/biopharma companies. Also, falling interest rates and rising liquidity suggest bond-proxy dividend stocks. Select small caps can offer the most explosive growth opportunities even if the small-cap indexes continue to lag the S&P 500—but ever since the market low on 11/20, small and micro-cap indexes have greatly outperformed.
Historically, small caps tend to outperform during periods of rising economic growth and cooling inflation. Indeed, analysts are expecting a rebound in earnings (in excess of the S&P 500’s) for the Russell 2000 this year. Keep in mind, while the cap-weight large cap indexes are dominated by Technology, small cap indexes tend toward Industrials, Materials, and Financials (including regional banks), which should benefit from broad-based economic activity, infrastructure spending, and reshoring of supply chains. Moreover, a dovish Fed should support the earnings of the more interest rate-sensitive market segments (like small caps) as well as mortgage lenders, credit card issuers, high-quality regional banks, property & casualty insurers (who hold bonds as claim reserves), homebuilders and suppliers, home improvement firms, title insurance firms, REITs, and automakers/dealers.
Regarding inflation and dollar hedges, historically under “normal” economic conditions, gold and bonds are both defensive plays and show positive price correlation with each other and inverse correlation with stocks. In other words, gold goes up as bond prices go up (and yields and stock prices fall), and conversely, gold often struggles as bonds fall (and yields and stocks rise, particularly since gold doesn’t pay a dividend). However, when the “fear trade” kicks in, gold serves as a hard-asset hedge against financial disruption. Other such hedges might include silver, bitcoin, ethereum, and Energy stocks (which did quite well during the 2022 bear market).
Other expectations of mine for 2026 include prolific (perhaps record-setting) M&A activity. Already, Netflix is on track to acquire Warner Bros Discovery for $82.7 billion. Constellation Energy (CEG) announced a $26.6 billion acquisition of Calpine Corporation in the nuclear and clean energy sector, while private equity firm Blackstone is acquiring TXNM Energy for $11.5 billion for its utility infrastructure—both acquisitions seek to serve the power needs of AI datacenters. Regarding IPOs, in December, medical supply company Medline raised roughly $6.3 billion in its stock offering, making it the biggest US IPO since Rivian in 2021.
Analysts believe 2026 could be the biggest year ever for IPOs, particularly after just 90 IPOs in 2025 and given several highly anticipated (but unconfirmed) names like SpaceX, Anthropic, Kraken, OpenAI, Fannie Mae and Freddie Mac. Notably, the Government Sponsored Enterprises (GSEs) have been increasing their balance sheets of mortgages and MBS, which would be expected to translate into higher IPO valuations, which would be a bigger windfall for the government. India might see some big IPOs this year, as well. Lastly, global venture funding reversed its downtrend in 2025, and that new uptrend is expected to continue this year. As you might expect, AI-related deals absorbed about 50% of total funding last year, and the US accounted for 64% of it.
WSJ says, “Some bankers and fund managers worry the stock market might struggle to handle the barrage of expected new issuance next year… If SpaceX were to go public, some bankers estimate it could sell well over the nearly $30 billion sold by the largest IPO on record, the Saudi Arabian Oil Company, commonly known as Aramco.” Because SpaceX is a private company, the best way for an individual investor to get exposure to it is through either Ark Venture Fund (ARKVX) or ERShares Private-Public Crossover ETF (XOVR). However, be mindful that some rumors suggest that Elon Musk might absorb it in a reverse merger into a holding company along with Tesla.
In addition, I think the odds are good for a Russia/Ukraine war resolution in 2026, which seems way overdue given that both sides are fatigued by stasis, death, out of pocket costs, and opportunity costs. Also, I think the US and China may find some common ground on AI, semiconductor design and manufacturing (which may impact the Taiwan situation). However, for now, China continues to pursue reunification aggressively even as Taiwanese national identity grows (as described in a recent WSJ article), China is struggling on many fronts, not the least of which is its oil supplies, which are dependent upon the likes of Iran, Russia, and Venezuela—all of whom are in some form of turmoil.
By the way, I recommend listening to this 45-minute on-stage interview with Energy Secretary Chris Wright at the Goldman Sachs Energy, Cleantech & Utilities Conference in Miami last week. He discusses Venezuela, AI, nuclear, and the future of the oil & gas industry. As he says, “The energy industry makes the world go ‘round”…or as I put it in my 3-part series on energy, it is “the lifeblood of an economy.” On Venezuela’s oil infrastructure situation, Wright says, “Decades of underinvestment, decades of corruption just degrades infrastructure…confidence…expertise…. So, yes, the challenges are large. 25 years of a narco-terrorist kleptocracy is not good for a society, which again is why the gentle nudges, the paper tiger approaches of the past just haven’t worked. So, yes, we are trying something radically different.”
In closing, as rates fall and the market broadens away from Big Tech, we might see rotation into value stocks, small-mid caps, cyclicals, dividend payers, bonds, and industrial metals (like copper, aluminum, cobalt, lithium, platinum, palladium), as well as equal-weight indexes, strategic beta ETFs, and active selection. On that note, Sabrient’s process-driven, growth-at-a-reasonable-price active-selection methodology is revealed by Sabrient founder David Brown in his new book, Moon Rocks to Power Stocks: Proven Stock Picking Method Revealed by NASA Scientist Turned Portfolio Manager.
It is available in both paperback and eBook formats on Amazon for investors of all experience levels. It teaches how to methodically and strategically build wealth in the stock market. David describes his path from NASA engineer in the Apollo Program to creating quant models for ranking stocks and building portfolios in four distinct investing styles—growth, value, dividend, and small cap. To learn more about David's book and the companion subscription product we offer that does most of the stock evaluation work for you, visit: https://DavidBrownInvestingBook.com (Note: if you get a malware warning, we are working on the problem, so please check back again soon.)
Latest Sector Rankings
Relative sector rankings are based on Sabrient’s proprietary SectorCast model, which builds a composite profile of each of roughly 1,500 equity ETFs based on bottom-up aggregate scoring of the constituent stocks. The Outlook Score is a Growth at a Reasonable Price (GARP) model that employs a forward-looking, fundamentals-based multifactor algorithm considering forward valuation, historical and projected earnings growth, the dynamics of Wall Street analysts’ consensus earnings estimates and recent revisions (up or down), quality and sustainability of reported earnings, and various return ratios. It helps us predict relative performance over the next 3-6 months.
In addition, SectorCast computes a Bull Score and Bear Score for each ETF based on recent price behavior of the constituent stocks on particularly strong and weak market days. A high Bull score indicates that stocks held by the ETF recently have tended toward relative outperformance when the market is strong, while a high Bear score indicates that stocks within the ETF have tended to hold up relatively well (i.e., safe havens) when the market is weak. Outlook score is forward-looking while Bull and Bear are backward-looking.
As a group, these three scores can be helpful for positioning a portfolio for a given set of anticipated market conditions. Of course, each ETF holds a unique portfolio of stocks and position weights, so the sectors represented will score differently depending upon which set of ETFs is used. We use the iShares that represent the ten major U.S. business sectors: Financials (IYF), Technology (IYW), Industrials (IYJ), Healthcare (IYH), Consumer Staples (IYK), Consumer Discretionary (IYC), Energy (IYE), Basic Materials (IYM), Telecommunications (IYZ), and Utilities (IDU). Whereas the Select Sector SPDRs only contain stocks from the S&P 500 large cap index, I prefer the iShares for their larger universe and broader diversity.
The table below shows the latest fundamentals-based Outlook rankings and our full sector rotation model:
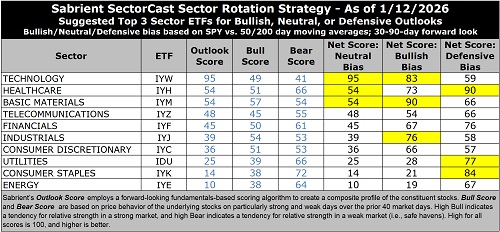
The latest rankings display a neutral bias, in my view, given that cyclicals, secular growth sectors, and defensive sectors are interspersed across the rankings, and only three sectors score above 50 on Outlook score.
Technology (dominated by the mega-cap Big Tech titans and AI-driven highflyers) remains at the top with a robust Outlook score of 95, despite having by far the highest forward P/E—a lofty 28.6x (although somewhat lower than the 31x it hit several months ago). However, because of its rising EPS growth estimate of 22.1%, the forward PEG (ratio of P/E to EPS growth) of 1.29 remains reasonable. Keep in mind, investors are quite willing to “pay up” for strong growth. Tech also displays solidly positive sell-side analyst earnings revisions (along with Financials), the highest profit margins and return ratios, and the best insider sentiment (open market buying). Because many Tech stocks are riding secular growth trends (i.e., little cyclicality), no other sector comes close to the consistent sales growth, margins, operating leverage, and return on capital. And Tech not only benefits from its own product development and productivity gains, but those products help other companies with their product development, product delivery, and productivity—so Tech benefits by helping all sectors grow and prosper.
Rounding out the top 7 are Healthcare, Basic Materials, Telecom, Financials, Industrials, and Consumer Discretionary, followed by a significant drop-off to the bottom 3. Telecom displays the lowest forward P/E of 14.7x, while Basic Materials has by far the lowest forward PEG of 0.83 given its moderate forward P/E of 18.3x couple with a strong and rising projected EPS growth rate of 22.0%.
At the bottom of the rankings are Energy and defensive sectors Consumer Staples and Utilities. Consumer Staples has the highest forward PEG of 2.51 due to its low projected EPS growth rate of just 6.9%. Because of the capital spending going into building out the power grid and infrastructure, Utilities has been a solid performer this year, even though the sector is typically considered to be a defensive “bond proxy” dividend play, but that has driven up its valuation, with a forward P/E of 18.2x for only modest projected EPS growth over the next 12 months (9.0%) and so a high forward PEG of 2.02—but its growth projections should rise with the datacenter buildout and associated ramp-up in power demand. Although US electricity consumption has been increasing only gradually over the past few years, ICF International forecasts a 25% increase by 2030 and 78% by 2050, driven largely by AI-related initiatives.
Keep in mind, the Outlook Rank does not include timing, momentum, or relative strength factors, but rather reflects the consensus fundamental expectations at a given point in time for individual stocks, aggregated by sector.
Sector Rotation Model and ETF Trading Ideas
Our rules-based Sector Rotation model, which appropriately weights Outlook, Bull, and Bear scores in accordance with the overall market’s prevailing trend (bullish, neutral, or defensive), returned to a bullish bias on 11/25 after briefly dropping to neutral when the S&P 500 fell below its 50-day moving average during November. (Note: In this model, we consider the bias to be bullish from a rules-based trend-following standpoint when SPY is above both its 50-day and 200-day simple moving averages, but neutral if it is between those SMAs while searching for direction, and defensive if below both SMAs.)
As highlighted in the table above, the Sector Rotation model suggests holding Basic Materials (IYM), Technology (IYW), and Industrials (IYJ), in that order. However, if you prefer a neutral stance, it suggests holding Technology, Healthcare (IYH), and Basic Materials. Or, if you prefer to take a defensive stance, it suggests holding Healthcare, Consumer Staples (IYK), and Utilities (IDU).
Here is an assortment of other interesting ETFs that are scoring well in our latest rankings: iShares MSCI Global Silver and Metals Miners (SLVP), VanEck Gold Miners (GDX), VanEck Junior Gold Miners (GDXJ), AXS Esoterica NextG Economy (WUGI), Sprott Active Gold & Silver Miners (GBUG), Global X PureCap MSCI InfoTech (GXPT), Technology Trusector (TRUT), Abacus FCF Innovation Leaders (ABOT), Global X Brazil Active (BRAZ), First Trust Nasdaq ABA Community Bank (QABA), Amplify SILJ Covered Call (SLJY), Janus Henderson Global Artificial Intelligence (JHAI), Touchstone Sands Capital US Select Growth (TSEL), Baron Technology (BCTK), SPDR S&P Pharmaceuticals (XPH), iShares MSCI USA Quality GARP (GARP), iShares Technology Opportunities Active (TEK), iShares AI Innovation and Tech Active (BAI), First Trust Active Factor Small Cap (AFSM), Fidelity Blue Chip Growth (FBCG), First Trust Small Cap BuyWrite Income (FTKI), Invesco Next Gen Media and Gaming (GGME), First Trust Indxx Critical Metals (FMTL), Virtus Silvant Growth Opportunities (VGRO), Invesco KBW Regional Banking (KBWR), and Invesco Nasdaq Biotech (IBBQ). All score in the top decile (90-100) of Sabrient’s Outlook scores.
As always, I welcome your thoughts on this article! Please email me anytime. Any and all feedback is appreciated. Also, please let me know of your interest in any of Sabrient’s new indexes for ETF investing, such as High-Quality Growth (similar to our Baker’s Dozen model), High-Quality Growth & Income, SMID-Cap Quality Plus Momentum, High-Quality Energy, Quality Legacy & Green Energy, Defensive Equity, Space Exploration & Off-Earth Sustainability, and the Sabrient Select High-Conviction Portfolio (actively managed).
IMPORTANT NOTE: I post this information periodically as a free look inside some of our institutional research and as a source of some trading ideas for your own further investigation. It is not intended to be traded directly as a rules-based strategy in a real money portfolio. I am simply showing what a sector rotation model might suggest if a given portfolio was due for a rebalance, and I do not update the information on a regular schedule or on technical triggers. There are many ways for a client to trade such a strategy, including monthly or quarterly rebalancing, perhaps with interim adjustments to the bullish/neutral/defensive bias when warranted, but not necessarily on the days that I happen to post this article. The enhanced strategy seeks higher returns by employing individual stocks (or stock options) that are also highly ranked, but this introduces greater risks and volatility. I do not track performance of the ideas mentioned here as a managed portfolio.
Disclosure: At the time of this writing, of the securities mentioned, the author held positions in SPY, IWM, FTLS, NVDA, gold, silver, palladium, copper, bitcoin.
Disclaimer: Opinions expressed are the author’s alone and do not necessarily reflect the views of Sabrient. This newsletter is published solely for informational purposes only. It is neither a solicitation to buy nor an offer to sell securities. It is not intended as investment advice and should not be used as the basis for any investment decision. Individuals should consider their personal financial circumstances in acting on any opinions, commentary, rankings, or stock selections provided by Sabrient Systems. Sabrient makes no representation that the techniques used in its rankings or analyses will result in profits. Trading involves risk, including possible loss of principal and other losses, and past performance is no guarantee of future results. Investment returns will fluctuate, and principal value may either rise or fall. Sabrient disclaims liability for damages of any sort (including lost profits) arising from the use of or inability to use its rankings or analyses. Information contained herein reflects our judgment or interpretation at the time of publication and is subject to change without notice.
Copyright © 2026 Sabrient Systems, LLC. All rights reserved.