Sector Detector: Investing in the “new normal” economy and stock market
 by Scott Martindale
President & CEO, Sabrient Systems LLC
Optimism reigns for the pandemic slowing and the economy reopening. And because stocks tend to be several months forward looking (and remarkably predictive, at that), April saw the best single-month performance for the S&P 500 in 33 years (+12.7%), while the Nasdaq saw its best month in 20 years (+15.4%). The S&P 500 Growth Index recorded its highest ever monthly return (+14.3%). In addition, gold and bitcoin have been rising as a hedge against all sorts of outcomes, including geopolitical instability, trade wars, de-globalization, unfettered monetary & fiscal liquidity (i.e., MMT), inflation, a weakening dollar, a “toppy” bond market, etc. (plus the periodic bitcoin “halving” event that occurs this week).
This impressive rally off the lows seems justified for several reasons:
- the coronavirus, as bad as it is, falling well short of the dire lethality predictions of the early models and our ability to “flatten the curve”
- massive monetary and fiscal policy support and the associated reduction in credit risk
- low interest rates driving retirees and other income seekers into the higher yields and returns of stocks
- household income holding up relatively well, as the main impact has been on lower wage workers who can’t work remotely (and government support should cover much of their losses)
- escalation of tensions with China seems to be “all hat and no cattle” for now, with a focus on economic recovery
- massive short covering and a bullish reversal among algorithmic traders
- the growing dominance and consistent performance of the secular-growth Technology sector plus other “near-Tech” names (like Facebook and Amazon.com)
- the steepening yield curve, as capital has gradually rotated out of the “bond bubble”
What the rally doesn’t have at the moment, however, is a strong near-term fundamental or valuation-based foundation. But although the current forward P/E of the S&P 500 of 20x might be overvalued based on historical valuations, I think in today’s unprecedented climate there actually is room for further multiple expansion before earnings begin to catch up, as investors position for a post-lockdown recovery.
In any case, it has been clear to us at Sabrient that the market has developed a “new normal,” which actually began in mid-2015 when the populist movement gained steam and the Fed announced a desire to begin tightening monetary policy. Investors suddenly become wary of traditional “risk-on” market segments like small-mid caps, value stocks, cyclical sectors, and emerging markets, even though the economic outlook was still strong, instead preferring to focus on mega-cap Technology, long-term secular growth industries, and “bond proxy” dividend-paying defensive sectors. And more recently, investor sentiment coming out of the COVID-19 selloff seems to be more about speculative optimism of a better future rather than near-term earnings reports and attractive valuation multiples.
In response, Sabrient has enhanced our forward-looking and valuation-oriented Baker’s Dozen strategy to improve all-weather performance and reduce relative volatility versus the benchmark S&P 500, as well as put secular-growth companies (which often display higher valuations) on more equal footing with cyclical-growth firms (which tend to display lower valuations). Those secular growth trends include 5G, Internet of Things (IoT), e-commerce, cloud computing, AI/ML, robotics, clean energy, blockchain, quantum computing, nanotechnology, genomics, and precision medicine. So, we felt it was necessary that our stock selection strategy give due consideration to players in these market segments, as well.
As a reminder, you can find my latest Baker’s Dozen slide deck and commentary on terminating portfolios at http://bakersdozen.sabrient.com/bakers-dozen-marketing-materials.
In this periodic update, I provide a market commentary, discuss Sabrient’s new process enhancements, offer my technical analysis of the S&P 500, and review Sabrient’s latest fundamentals-based SectorCast rankings of the ten US business sectors, and serve up some actionable ETF trading ideas. In summary, our sector rankings now look defensive, and our sector rotation model maintains a neutral posture as it climbs from the depths of the selloff. Meanwhile, the technical picture remains bullish as it continues to gather speculative conviction on a better future, although with elevated volatility amid progress/setbacks as the economy tries to gradually reopen in the face of an ongoing coronavirus threat. Read on....
Market Commentary:
It seems like we are constantly experiencing all sorts of “unprecedented” events: 100-year floods and other extreme weather events; the deadliest pandemic since the Spanish Flu; from record low to record high unemployment in the blink of an eye; record levels of government debt and negative real interest rates; the fastest-ever selloff (with multiple days triggering limit-down circuit breakers) recovery suddenly becoming the shortest-ever bear market; from oil futures crashing to as low as -$37.63 (yes, sellers had to pay buyers to accept May delivery) to an historic recovery in oil. And don’t forget about the Asian “murder hornets” (say what?!). And now we have the once-unthinkable Modern Monetary Policy (MMT) and socialist-style government allocation of investment capital – even in the absence of the presumed prerequisite of a Far-Left takeover. Most of these are once-in-a-generation or even once-in-a-lifetime events that seem to be happening in rapid succession.
But we just deal with whatever comes before us, and at the moment it is balancing the fallout of both the disease and the cure. The longer the shutdown goes on, the more difficult will be the recovery, the more likely it is that many businesses never will reopen, and the more likely is an economic depression. So, with signs of progress in battling the coronavirus pandemic, several states have begun to reopen their economies and schools. In response, many people are angry and of the mind that “one more death is one too many.” But we must keep in mind that it was never the intention to prevent all further deaths, but rather it was to “flatten the curve” to avoid overwhelming the healthcare system – not necessarily to save lives or reduce infections, but to simply spread them out and ultimately achieve herd immunity. We knew that many people would still become infected and some would die, like from a seasonal flu “on steroids.” After all, if global society demanded a truly fail-safe life with “not one more death” from accidents or transmissible disease, there would be no economy at all. As someone once said, “Don’t let a fear of dying prevent you from living,” or alternatively, “If you are afraid of living then you’re already dying.” There are plenty of precautions healthy individuals can take, and those at greatest risk can choose to remain isolated. Moreover, as Treasury Secretary Steven Mnuchin has warned, not lifting lockdown measures could lead to “permanent economic damage."
Investors are looking beyond the immediate economic and health carnage to better days ahead, and they are gathering believers, including a fear of missing out (FOMO) sentiment. Notably, TD Ameritrade (AMTD), E*Trade (ETFC), and Charles Schwab (SCHW) all saw record numbers of new retail accounts opened during Q1. Some have called this bull run a “junk rally” or “short-covering rally,” and no doubt this description applies to many of the stocks that have bounced. But there also have been many strong companies from cyclical sectors that were the proverbial “baby being thrown out with the bathwater,” as their industries were sold off in fear of a prolonged recession, and such stocks have made impressive (and warranted, in my view) comebacks.
The rally might have been even stronger if not for President Trump’s threat of new tariffs to punish China over its handling and coverup of the coronavirus outbreak. The market has shown us before its distain for trade wars, so starting up a new one at this precarious moment seems ill-advised. But both sides are insisting that the Phase 1 deal is still on track, and I think in the short term, the president’s desire to resurrect the paralyzed economy ultimately will win out over his desire to punish China, and the priority will be removing obstacles to recovery, with trade wars and investigations held at bay (for now).
Moreover, some industries found themselves particularly well-positioned for the work-from-home mandate (which might become permanent for many workers going forward) – and they are thriving in this crippled economy. Examples include videoconferencing like Zoom Video (ZM), home fitness equipment like Peloton Interactive (PTON), virtual healthcare like Teledoc (TDOC), subscription streaming like Netflix (NFLX), and e-commerce led of course by Amazon.com (AMZN). Even Soylent Green…uh, I mean Beyond Meat (BYND)…has been rallying hard, at least partly due to shortages and rationing of beef, chicken, and pork from supply chain disruptions.
The economy, federal spending, corporate earnings:
The overall federal fiscal package is expected to top $3 trillion, and the Federal Reserve’s monetary stimulus likely will inject $4-5 trillion into the financial system – with some estimates as high as $6-8 trillion. Moreover, it is being injected straight into the M2 money supply rather than as excess reserves. The already-bloated federal budget deficit has ballooned to $1.9 trillion, and the CBO forecasts that it will quadruple to $3.7 trillion and that Q2 GDP will shrink by -40% (and by -5.6% for full-year 2020). As JPMorgan strategist Marko Kolanovic said in a recent note to clients, "We estimate the impact of Fed easing in both rates and credit more than compensate for the temporary hit to corporate earnings when valuing the US market via discounted earnings.”
Furthermore, although I have written quite a bit on the long-term challenges governments around the world (especially China and the US) face in unwinding massive debt loads and balance sheets, Fed chair Jerome Powell asserted his view that Congress need not worry right now about excessive debts, “This is not the time to act on those concerns. This is the time to use the great fiscal power of the United States to do what we can to support the economy and try to get through.” And in this low-interest-rate, low-inflation environment, many federal debt hawks seem to agree, especially for countries that borrow in their own currencies.
The U3 unemployment rate hit 14.7% (versus the generational low of 3.5% in February). But Oxford Economics estimates that a third of workers who have been laid off are not looking for work and thus are not being counted in the figures, pushing the labor participation rate below 60% (which hasn’t occurred in over 50 years) – so actual unemployment could be much higher, perhaps as high as 21%. Meanwhile, U6 unemployment (a broader measure that adds to U3 discouraged workers and part-timers who want full-time work) hit 22.8%, and Goldman Sachs expects it to reach a record 29%.
However, 78% of those that lost their job in April said they were furloughed rather than fired, which implies it’s only temporary. Moreover, most of the lost jobs paid lower wages, so the total impact on median household income is modest (especially after government policy offsets kick in) compared with the higher-wage job losses during the Financial Crisis. Thus, according to Tom Lee of Fundstrat, a 26% unemployment rate likely would create a 10% reduction in household income (and even less than that when policy offsets are accounted for), whereas during the Financial Crisis, 10% unemployment created a 16% hit to household income.
As for US corporate earnings, according to FactSet, with 86% of the S&P having reported Q1 2020 through 5/8/20, EPS is down about -13.6% versus Q1 2019 on flattish revenue growth of +0.6%. Analyst consensus has slashed the S&P 500’s Q2 forward estimates by a record -28% (note that the previous record quarterly revision was -21% during Q1 2009), with recovery forecasted to be more of a U-shape than V-shape. And for the balance of 2020, a record number of US companies have suspended near-term earnings guidance due to the coronavirus disruption – although the longer term still looks good. Nevertheless, sell-side consensus for 2020 expects -40.6% earnings and -10.9% for Q2; -23.6% earnings and -5.2% revenues for Q3; -11.4% earnings and -1.2% revenues for Q4; and -19.7% earnings on -3.4% revenues for full-year 2020, while achieving 88% of pre-pandemic earnings during H2.
Obviously, we are in unprecedented territory with this pandemic. But comparing today versus the days of Spanish Flu over 100 years ago, the biggest difference is the Internet, which has made it so that many of us can continue to work remotely in isolation, and scientists around the world can collaborate toward developing a vaccine and effective treatments. We can only guess as to when things will be “back to normal,” if ever, and even the opinions of experts are all over the map. This has made it impossible for companies to plan for the future, including how long to continue WFH and social distancing, how badly their various customers will be impacted, and how to plan for capex budgets, hiring, and buyback programs. Many companies and in fact entire industries likely will be crippled for a very long time – most notably travel/leisure/hospitality. Therefore, I don’t see a return to normalized earnings until well after there is both a vaccine and effective treatments, which could take years.
Keep in mind, however, that as companies adopt technological innovations and other cost-cutting and productivity boosters, operating leverage continues to expand, which means that they can achieve higher bottom lines (earnings) on lower top lines (revenues) despite rising wages.
On the other hand, the longer term likely will bring structural changes that squeeze margins. The outsized impact of the pandemic on the “little guy” once again has highlighted why there is such disillusionment with our institutions, leading to growth in populism and protectionism in a backlash against globalism and interventionism. After an initial period of price deflation as the economy gets back on its feet, we finally may see rising inflation driven by a restructuring of global supply chains, onshoring of manufacturing, and a commensurate decline in global trade as a percentage of GDP (which has been in an apparent topping pattern in recent years at about 60% globally and 28% in the US). Thus, wealth inequality may have seen its peak.
Moreover, some economists think this all likely suggests a peak and gradual decline in the “Debt Supercycle” – a term coined by BCA Research in the 1970s to describe the condition in which financial imbalances aren’t allowed to fully unwind as they would in a normal economic cycle – given that the Federal Reserve and US Treasury are working in concert to juice inflation and “inflate away” our massive debts, and assuming that overly-leveraged households will now look to pay down debt and boost savings.
As of 5/11/20, the 30-year Treasury yield sits at 1.414%, while the 10-year T-note is 0.707%, the 2-year T-note 0.177%, and the 3-month T-bill 0.119%. So, the 3-month/10-year spread is about +59 bps, while the more closely followed 2-10 spread is +53 bps, as the Fed is essentially controlling the yield curve. Looking ahead, Fed Funds Futures give 99.4% probability that zero interest rate policy (ZIRP) will remain through March 2021.
As for the weakness in oil prices, they are a mixed blessing. On the one hand, low prices are stimulative by leaving extra money in the pockets of consumers (i.e., a de facto tax cut). On the other hand, many E&P companies are highly leveraged and could go bankrupt – taking down much of the high yield credit market and some regional banks along with it.
Technology taking over the cap-weighted indexes:
Tom Lee of FundStrat thinks, based on his research, that it is quite possible the current 26.5% tech weighting in the S&P 500 could rise to 50% over the next few years. As DataTrek has pointed out, the five FAAAM juggernauts [Facebook (FB), Apple (AAPL), Amazon.com (AMZN), Alphabet (GOOG), and Microsoft (MSFT)] now make up nearly 20% of the S&P 500 and over 40% of the NASDAQ. Looking back to 2000, the dominant market caps were in MSFT, Cisco Systems (CSCO), General Electric (GE), Intel (INTC), and Exxon-Mobil (XOM). According to DataTrek, in 2009, the Energy sector allocation in the S&P 500 was as high as 15% but only around 3% today, while Technology was as high as 19% then but about 31% today (if you include “near-Tech” mega-caps like FB, AMZN, and GOOG). Moreover, the 3% aggregate weighting of Energy stocks is less than the individual index weightings of MSFT, GOOG, AMZN, or AAPL; and without AAPL, MSFT and GOOG, S&P 500 returns over the past 10 years would have been 23% lower.
So, Tech is overvalued, right? This has become another Tech bubble like in 2000, right? Well, not so fast. The reality is that these market leaders can be considered relatively cheap today compared to 2000. Most of the Tech juggernauts not only dominate their space but are also cash machines with superb profitability and cash flow generation. Also, the cost of capital is much lower today. Thus, Tech sector profitability, cash flow generation, and cash balances are much higher while the cost of capital is much lower, all of which bolster valuations. This allows for a higher valuation multiple for the S&P 500 because these names are not dependent upon the unpredictable moves in commodity prices nor are they as capital intensive.
US-China relations:
Remember the Brady Bunch TV series? Jan would get so exasperated with all the attention given to her sister, “Marcia, Marcia, Marcia!” Well, similarly it seems we are constantly hearing about “China, China, China!” Ever since it was admitted into the WTO (with the fervent backing of Bill Clinton and the US government), they have been a dynamo in taking maximum advantage of their good fortune, while adhering to the rules that further its interests and unapologetically ignoring the ones that don’t, with no repercussions. Today, this global power is challenging the US technologically, economically, politically, and militarily. The world has transitioned from the US-dominated unipolar system since the Cold War ended to a bipolar system of order and influence – and this transition was accelerated by the West’s failure to confront China’s trade transgressions, as forced technology transfer, flouting of IP rights, and cybertheft allowed it to catch up rapidly, until President Trump decided it was time to confront it through tariffs. As China began to feel the economic pain, as if on cue, the coronavirus was unleashed upon the world (however unintentional it may have been), with the US absorbing the greatest pain from it. In response, Trump is seeking to punish China over its handling and coverup of the outbreak.
But no matter what happens in the short term with new tariffs and investigations, it is likely that the fallout from COVID-19 will be greater for China than any other country, given the precarious state it was already in – especially its debt-fueled economic growth often with little ROI (e.g., “bridges to nowhere”) and non-performing loans held by its banks and its “shadow banking” system, including massive non-financial corporate debt, local government financing vehicles, and “wealth management products (WMPs). As it pursues fiscal stimulus measures and capital outflow restrictions, China is also driving a deeper wedge by pursuing a predictable disinformation campaign in Western social media to push a narrative that the coronavirus was a US plot (further distancing itself from the West’s good graces).
Indeed, longer term, the coronavirus coverup and distraction may have been the final straw for China and the world’s willingness to continue looking the other way with respect to its unscrupulous trade practices, oppressive totalitarian rule, and grand plan to take over the world (e.g., Belt & Road Initiative and Made in China 2025) and prove the superiority of its system of state capitalism. As such, China’s role as the center of global manufacturing is likely to take a significant hit over the coming years as supply chains are diversified or onshored.
Final thoughts:
First the trade war and now the coronavirus has laid bare the vulnerabilities of our global supply chains. Moreover, the rapidly growing recognition of the threat posed by China’s aggressive goals appears to be one of the only unifying themes in our hyperpolarized American society, which further suggests a reversal in the globalization trend. Eric Peters of One River Asset Management opined that as our economy had become increasingly optimized with complex global supply chains to maximize productivity, just-in-time inventory, efficiency, leverage, and return on capital, we effectively traded redundancy (and a safety cushion) for optimization and maximum profitability, and as a result, we also traded resiliency for fragility. Thus, we look to government each time to bail out our critical businesses when calamity arrives.
But in my view, rather than choking off the entrepreneurial spirit of capitalism, we must trust that American industriousness, ingenuity, and innovation will always find an answer to any crisis we face, as opposed to greater government control, direction, regulation, and oversight. As such, we must resist the short-term security and long-term shackles of a growing Nanny State, while incentivizing industry behaviors that lead to greater resiliency and equality.
Furthermore, I must say that I am greatly concerned to see our constitutionally-protected individual liberties trampled or unapologetically suspended by local politicians and social media platforms in the name of “emergency measures” and “the collective good” – most notably the First Amendment, as freedom of speech and assembly have been overridden by shelter-in-place mandates, arrests for lawful assembly (e.g., church worship and protests), and removal of internet content deemed “misinformation” by the self-anointed thought police.
“Helicopter money” is intended to placate the masses while their livelihood and freedom is cut off. Most worrisome to me is the heavy hand of government and the loss of liberties. You may have heard about Elon Musk’s rant during the Tesla conference call, and I feel his frustration. There is growing censorship in social media, where Facebook and YouTube, among others, are shutting down people who don't follow their prescribed line of thinking, with any deviation of opinion deemed “dangerous misinformation.” It is a serious problem.
Looking ahead, even as the economy reopens and corporate earnings begin to recover from the shutdown, I don’t envision a full reopening and a return to “normalized” earnings until well after there is both a COVID-19 vaccine and an effective treatment, which could take years. Moreover, I expect the Fed will maintain low rates and accommodative policies until the average worker is seeing benefits – and there will be more stimulus to come if necessary. Unfortunately, this essentially means that Modern Monetary Theory (MMT) is here to stay, no matter which party controls the federal government.
As for the stock market’s V-shaped rise in patient anticipation of a U-shaped economic recovery, Société Générale strategist Sophie Huynh believes stocks have likely gotten ahead of themselves because the rebound has focused on Technology, Healthcare, and Consumer Staples sectors that benefit from low interest rates, monetary stimulus, and work-from-home trends. She thinks, “…we would need to see a rotation out of those long-duration stocks into more cyclical ones like discretionary, energy, industrial, reflective of growth actually picking up….” Likewise, Guggenheim CIO Scott Minerd thinks the S&P 500 could fall below 1500, “The market at this level based upon where earnings are doesn’t represent any kind of intrinsic value…It is being entirely propped up by liquidity.”
True enough, for the short term. However, although the current forward P/E of the S&P 500 of 20x indeed seems overvalued based on historical valuations (as prices rise while EPS estimates are cut), I think in today’s unprecedented climate there is room for further multiple expansion to perhaps 23-25x or even more, before earnings begin to catch up. Why? Because of: 1) the far-reaching monetary and fiscal stimulus and massive liquidity injections (aka investment capital) searching for returns (as Minerd lamented), 2) negative real interest rates that favor long duration (essentially infinity) on a discounted cash flow basis, and 3) investor optimism/speculation on a strong recovery phase in the economy (coming out of a deep-but-brief recession), a rejuvenation in corporate capital spending (rather than a continued reliance solely on consumer spending), and a gradual improvement in corporate earnings across most sectors. (Note: the 10-year Treasury yield closed 5/11/20 at 0.707%, and a comparable earnings yield implies a P/E ratio of 141x – further supporting market multiple expansion.)
My friends at DataTrek seem to agree, as they say that this creates “a recipe for a continued melt up for US stocks even if the foundations of that rally feel like they are set in quicksand. This move will feel profoundly irrational, deeply uncomfortable, and vulnerable to sudden setbacks…because the narrative is not about earnings or even interest rates but rather a levered call on America itself.”
I think leadership will be driven by secular growth in Technology, Communication Services, and Healthcare sectors, as well as diversification of supply chains, onshoring manufacturing operations, and increased infrastructure spending that should boost cyclical growth sectors like Industrials, Energy, and Materials sectors. However, I also expect that elevated volatility will continue to be part of this new normal, as the economic recovery experiences both setbacks and breakthroughs.
As a reminder, Sabrient’s model-driven portfolio selection approach seeks companies with strong growth expectations and good earnings quality that are selling at a reasonable forward valuation, but it doesn’t predict fickle investor behavior, such as when they choose to ignore the forward guidance on which we based our rankings out of an abundance of caution. Nevertheless, we expect our new process enhancements to help boost all-weather performance by: 1) reducing relative volatility versus the benchmark by limiting extreme sector tilts, 2) improving the likelihood that selected stocks will meet their earnings estimates through our new Growth Quality Rank (GQR) that measures the consistency and reliability of a company’s earnings history, and 3) boosting the rankings of many secular growth companies that tend to maintain investor enthusiasm and putting them on more equal footing with the cyclical growth companies (which typically display better GARP qualities in a growing economy).
And again, I think we are in the early stages of a new expansionary cycle that could run for several years. In fact, economic paralysis from the pandemic may have finally allowed for the GDP recession and bear market in stocks (that monetary and fiscal policies have been trying so hard to prevent from happening), so that we can now move on with an expansionary phase to the economic cycle (and a new bull market in stocks) that could run for several years, driven by an upswing in manufacturing activity, infrastructure spending, and new technologies like 5G, the Internet of Things (IoT), e-commerce, cloud computing, semiconductors, AI/ML, robotics, clean energy, blockchain, quantum computing, nanotechnology, genomics, and precision medicine. Let’s embrace it.
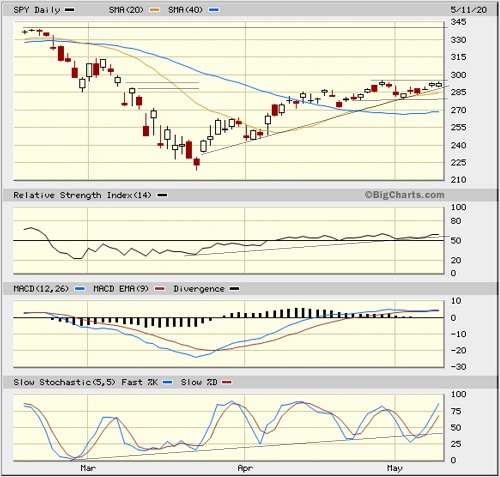
SPY Chart Review:
The SPDR S&P 500 ETF (SPY) closed Monday 5/11/20 at 292.50. It went on quite a tear from the depths of the selloff on 3/23/20 through 4/29/20, where it closed the bearish gap down from early-March, as shown on the chart, and since then it entered a consolidation phase to work off the overbought conditions in a sideways channel. During the consolidation, it has maintained support from both the uptrend line and the 20-day simple moving average (SMA) and is apparently forming an ascending triangle, which is a bullish continuation pattern. If price manages to break out to the upside, it would confirm the bullish pattern and the next level of resistance would be the 300 handle where the convergence of the 100- and 200-day SMAs will be tough to break through. The question is whether speculative fervor and multiple expansion without near-term earnings support can push it past 300 and target the early-March minor high at 315 – quite a challenge. Oscillators RSI, MACD, and Slow Stochastics have been displaying higher lows, to support the higher lows in price. If the ascending triangle formation breaks down, support levels include the bottom of the sideways channel at 280 and the 50-day SMA near 272.
Latest Sector Rankings:
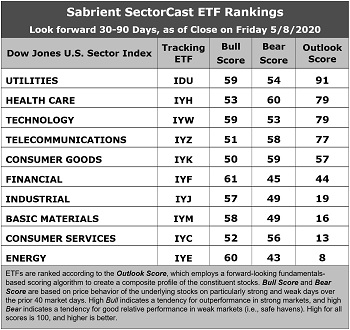
Relative sector rankings are based on our proprietary SectorCast model, which builds a composite profile of each of nearly 500 equity ETFs based on bottom-up aggregate scoring of the constituent stocks. The Outlook Score employs a forward-looking, fundamentals-based multifactor algorithm considering forward valuation, historical and projected earnings growth, the dynamics of Wall Street analysts’ consensus earnings estimates and recent revisions (up or down), quality and sustainability of reported earnings, and various return ratios. It helps us predict relative performance over the next 2-6 months.
In addition, SectorCast computes a Bull Score and Bear Score for each ETF based on recent price behavior of the constituent stocks on particularly strong and weak market days. A high Bull score indicates that stocks within the ETF recently have tended toward relative outperformance when the market is strong, while a high Bear score indicates that stocks within the ETF have tended to hold up relatively well (i.e., safe havens) when the market is weak.
Outlook score is forward-looking while Bull and Bear are backward-looking. As a group, these three scores can be helpful for positioning a portfolio for a given set of anticipated market conditions. Of course, each ETF holds a unique portfolio of stocks and position weights, so the sectors represented will score differently depending upon which set of ETFs is used. We use the iShares that represent the ten major U.S. business sectors: Financial (IYF), Technology (IYW), Industrial (IYJ), Healthcare (IYH), Consumer Goods (IYK), Consumer Services (IYC), Energy (IYE), Basic Materials (IYM), Telecommunications (IYZ), and Utilities (IDU). Whereas the Select Sector SPDRs only contain stocks from the S&P 500 large cap index, I prefer the iShares for their larger universe and broader diversity.
Here are some of my observations on this week’s scores:
1. Utilities has taken the top spot with a strong Outlook score of 91. The sector displays a modest forward P/E (16.0x), the best sell-side analyst sentiment (although seeing cuts to EPS estimates, they are the least negative net revisions), and good insider sentiment (open market buying). However, its GARP year-over-year expected EPS growth rate is only 5.6% and its forward PEG ration (forward P/E divided by projected EPS growth rate) is an unimpressive 2.8. Healthcare drops to the second spot with an Outlook score of 79, while Technology moves up a spot to tie for second. Both display attractive forward PEGs around 1.7, good return ratios, and double-digit projected EPS growth rates. Technology also displays the best insider sentiment. Rounding out the top five (and the only ones scoring above 50) are Telecom and Consumer Goods (Staples/Noncyclicals).
2. At the bottom of the rankings we find three cyclical sectors: Energy, Consumer Services (Discretionary/Cyclicals), and Basic Materials. Energy displays the lowest projected EPS growth rate of only 3.6% and by far the highest forward PEG ratio of 6.6.
3. Looking at the Bull scores, Financial displays the top score of 61, followed by Energy at 60, as stocks within these sectors in particular have displayed relative strength on strong market days. Interestingly, defensive sector Utilities also displays a solid score of 59, likely due to the desirability of its yield (3.1%). Consumer Services scores the lowest at 50, With a top-bottom spread of only 11 points, this reflects quite high sector correlations on strong market days (i.e., all boats lifted). It is desirable in a healthy market to see low correlations reflected in a top-bottom spread of at least 20 points, which indicates that investors have clear preferences in the market segments and stocks they want to hold (rather than broad risk-on behavior).
4. Looking at the Bear scores, instead of the usual defensive sector Utilities alone in the top spot, we now find Healthcare scoring the best at 60 followed by Consumer Goods (Staples/Noncyclicals) at 59, which means that stocks within these sectors have been the preferred safe havens lately on weak market days. Energy displays the lowest score of 43, as investors have fled during recent market weakness. The top-bottom spread is 17 points, which reflects relatively low sector correlations on weak market days. Ideally, certain sectors will hold up relatively well while others are selling off (rather than broad risk-off behavior), so it is desirable in a healthy market to see low correlations reflected in a top-bottom spread of at least 20 points.
5. Utilities displays the best all-around combination of Outlook/Bull/Bear scores, followed by Healthcare, while Energy is by far the worst. Looking at just the Bull/Bear combination, Utilities and Healthcare tie for the best, followed closely by Technology, indicating superior relative performance (on average) in extreme market conditions (whether bullish or bearish), while Energy is the worst.
6. I would say this week’s fundamentals-based Outlook rankings reflect a defensive bias, given that four of the top five are defensive or all-weather sectors and given that all of the bottom five are cyclical sectors. However, in this unprecedented climate, it is not surprising that the next 2-6 months score defensively as the economy tries to gradually creep out of shutdown mode while equity investors position for a better long-term outlook. Keep in mind, the Outlook Rank does not include timing, momentum, or relative strength factors, but rather reflects the consensus fundamental expectations at a given point in time for individual stocks, aggregated by sector.
ETF Trading Ideas:
Our Sector Rotation model, which appropriately weights Outlook, Bull, and Bear scores in accordance with the overall market’s prevailing trend (bullish, neutral, or defensive), moved to a neutral bias last month and suggests holding Utilities (IDU), Healthcare (IYH), and Technology (IYW), in that order. (Note: In this model, we consider the bias to be neutral from a rules-based trend-following standpoint when SPY is between its 50-day and 200-day simple moving averages.)
Besides iShares’ IDU, IYH, and IYW, other highly-ranked ETFs in our SectorCast model (which scores nearly 900 US-listed equity ETFs) from the Utilities, Healthcare, and Technology sectors include Virtus Reaves Utilities (UTES), iShares Evolved US Innovative Healthcare (IEIH), and First Trust NASDAQ Technology Dividend (TDIV).
If you prefer a bullish bias, the Sector Rotation model suggests holding Utilities, Technology, and Financial, in that order. On the other hand, if you are more comfortable with a defensive stance on the market, the model suggests holding Healthcare, Telecom, and Consumer Goods (Staples/Noncyclicals), in that order.
An assortment of other interesting ETFs that are scoring well in our latest rankings include Invesco Solar (TAN), Invesco Dynamic Pharmaceuticals (PJP), VanEck Vectors Uranium+Nuclear Energy (NLR), Global X SuperDividend Alternatives (ALTY), Loncar Cancer Immunotherapy (CNCR), First Trust EIP Carbon Impact (ECLN), Invesco Dynamic Biotech & Genome (PBE), Invesco S&P 500 Equal Weight Utilities (RYU), VanEck Vectors Junior Gold Miners (GDXJ), ETFMG Alternative Harvest (MJ), Virtus LifeSci Biotech Products (BBP), First Trust NASDAQ ABA Community Bank (QABA), First Trust North American Energy Infrastructure (EMLP), Tortoise North American Pipeline (TPYP), Invesco International Dividend Achievers (PID), and Pacer American Energy Independence (USAI).
As always, I welcome your thoughts on this article! Please email me anytime. Any and all feedback is appreciated!
IMPORTANT NOTE: I post this information periodically as a free look inside some of our institutional research and as a source of some trading ideas for your own further investigation. It is not intended to be traded directly as a rules-based strategy in a real money portfolio. I am simply showing what a sector rotation model might suggest if a given portfolio was due for a rebalance, and I do not update the information on a regular schedule or on technical triggers. There are many ways for a client to trade such a strategy, including monthly or quarterly rebalancing, perhaps with interim adjustments to the bullish/neutral/defensive bias when warranted, but not necessarily on the days that I happen to post this article. The enhanced strategy seeks higher returns by employing individual stocks (or stock options) that are also highly ranked, but this introduces greater risks and volatility. I do not track performance of the ideas mentioned here as a managed portfolio.
Disclosure: At the time of this writing, the author held long positions on the SPY.
Disclaimer: This newsletter is published solely for informational purposes and is not to be construed as advice or a recommendation to specific individuals. Individuals should take into account their personal financial circumstances in acting on any opinions, commentary, rankings, or stock selections provided by Sabrient Systems or its wholly owned subsidiary Gradient Analytics. Sabrient makes no representations that the techniques used in its rankings or analysis will result in or guarantee profits in trading. Trading involves risk, including possible loss of principal and other losses, and past performance is no indication of future results.