Sector Detector: Gold, bitcoin, and mega-cap Tech make unlikely bedfellows
 by Scott Martindale
President & CEO, Sabrient Systems LLC
Quick assessment: We have an historic pandemic wreaking havoc upon the global economy, with many US states reversing their reopenings. We just got the worst ever quarterly GDP growth number, and jobless claims are resurging. The Federal Reserve is frantically printing money at breakneck pace to keep our government solvent, with M3 money supply growth having gone parabolic. We have a highly contentious presidential election that many consider to be the most consequential of our lifetimes. There is unyielding and unappeasable social unrest, with nightly rioting in the streets in many of our major cities. Tensions with China are again on the rise, with a new Cold War seemingly at hand. Hurricanes are threatening severe damage in states that are already reeling from a surge in COVID hospitalizations. And yet the Nasdaq 100 (QQQ) has burst out to new highs while the S&P 500 (SPY) is within 3% of its all-time high (although, quite notably, both of these cap-weighted indexes are dominated by a handful of mega-cap, disruptive juggernauts).
Of course, stocks have been bolstered by unprecedented congressional fiscal programs and Fed monetary support, including zero interest rate policy (ZIRP), open-ended quantitative easing (QE), de facto yield curve control (YCC), and the buying of corporate bonds (including junk bonds and fixed-income ETFs – and perhaps will include equity ETFs at some point). This de facto “Fed put” has induced a speculative fervor, FOMO (“fear of missing out”), and a TINA (“There is No Alternative!”) mindset for risk assets – particularly given infinitesimal bond yields and a falling dollar. Furthermore, while COVID cases have risen with the economy’s attempt at reopening, the death rate is down 75% since its peak in April, as the people being infected this time around are generally younger and less vulnerable and hospitals are better prepared.
However, we have witnessed extreme bifurcation in this market, with certain secular growth segments performing extremely well and hitting new all-time highs, while other segments are quite literally in a depression. And although the pandemic has exacerbated this situation, it has been developing for a while. As I have often discussed, when the trade war with China escalated in mid-2018, the market became highly bifurcated to seek the perceived safety of the dominant mega caps over smaller caps, growth over value, and secular growth Technology over the neglected cyclical growth sectors like Financials, Industrials, Materials, and Energy. It rotated defensive and risk-off even given the positive economic outlook. This is also when the price of gold began to ascend. Yes, gold has become much more than just a hedge; it now has its own secular growth story (as discussed below), which is why Sabrient’s new Baker’s Dozen for Q3 2020 includes a gold miner.
So, while Sabrient’s flagship Baker’s Dozen portfolios over the past two years have been dominated by smaller caps, the value factor, and cyclical sectors – to their detriment in this highly bifurcated market – you can see that our newer portfolios since the enhancements were implemented have been much more balanced among large, mid, and small caps, with a slight growth bias over value, and a balance between secular growth and cyclical growth companies.
In this periodic update, I provide a market commentary, offer my technical analysis of the S&P 500, and review Sabrient’s latest fundamentals-based SectorCast rankings of the ten US business sectors, and serve up some actionable ETF trading ideas. In summary, while our sector rankings look neutral (as you might expect given the poor visibility for earnings), the technical picture is bullish, and our sector rotation model remains bullish.
As a reminder, Sabrient has introduced process enhancements to our forward-looking and valuation-oriented stock selection strategy to improve all-weather performance and reduce relative volatility versus the benchmark S&P 500, as well as to put secular-growth companies (which often display higher valuations) on more equal footing with cyclical-growth companies (which tend to display lower valuations). You can find my latest Baker’s Dozen slide deck and commentary on terminating portfolios at http://bakersdozen.sabrient.com/bakers-dozen-marketing-materials. To read on, click here....
Market Commentary:
Year to date, the SPY is positive at +2.5% and is now within 4% of its all-time high on 2/19/20 as it has rapidly recovered from an historic selloff (-35% and $10 trillion in market cap in 23 trading days, in case you forgot already). Indeed, after pulling back from its 6/8/20 selloff recovery high, SPY was up +5.9% in July, while the equal-weight S&P 500 (RSP) was similarly up +5.0% in a display of relatively healthy market breadth that has characterized the post-selloff recovery (SPY +46.0% versus RSP +49.8% since the 3/23/20 selloff low. But the real star performer is the QQQ at +25.5% YTD, as it has regularly set new high after new high, while the equal-weight cousin from First Trust (QQEW) is up “only” +14.2%.
Recall that just prior to the pandemic-induced economic shutdown, the US economy was considered the strongest of our lifetime with record high corporate profits, a 50-year low in unemployment, a 20-year high in household income, and strong consumer confidence. The only thing missing was sufficiently strong corporate confidence to induce big capital spending plans with all the cash in the corporate coffers, rather than just massive buyback programs. And to add fuel to that simmering foundation, we have ZIRP (possibly “forever”) and nearly $10 trillion in monetary and fiscal stimulus (plus more on the way). In addition, there is the Chinese media telling its people they should load up on stocks (and its citizens dutifully obey). So, with all hands on deck to support the economy and fuel it to new heights, it’s no wonder that equity investors are eagerly positioning for a better future once the virus is reined in.
While it has been worsening recently in some states, the trajectory of the virus has actually been better than the original dire forecasts (despite the apocalyptic characterizations you still hear on TV), while ongoing optimism regarding new treatments and vaccines also helped to propel markets higher, with several vaccine trials showing encouraging results. The notion that “one death is too many” and that we should just print as much money as needed to keep everyone safe and financially whole (with “helicopter money”) until a vaccine or cure is developed is both naïve and short-sighted, as we dig a financial hole that may be impossible to ever climb out of. We need a functioning economy for both the short-term and long-term health of society, and that means schools must be opened without preconditions, individuals must take responsibility for their own personal health situation (and isolate if appropriate), and we must stop expecting the “nanny state” to watch over us.
Speaking of schools, further exacerbating the economic recovery is the resistance of many politicians and labor unions to reopening them despite most parents and students wanting them open. In a political power play attempt, the union representing Los Angeles Unified District schools announced that it would not reopen unless certain (mostly unrelated) conditions are met: full PPE and redesigned classroom layouts, shutdown of privately operated, publicly funded charter schools, police defunded, Medicare-for-All healthcare, a statewide wealth tax, funding to house the homeless and for undocumented students and families, and a federal bailout of the insolvent school district.
And while anarchists who loot, riot, assault police and non-supporters, and commit arson and widespread property destruction are excused for their supposedly righteous civil disobedience, honest business owners struggling to stay afloat who merely open their doors in defiance of the arbitrary executive orders of bewildered governors are arrested and have their licenses revoked. Moreover, God help them if they try to defend their livelihoods against the mob that storms their doors. It seems the fictional Bizarro World has become reality.
Market breadth:
About 2/3 of the stocks in the S&P 500 are negative on the year despite the positive return of the broad index. Meanwhile, the “Big 5” FAAAM names – i.e., Facebook (FB), Amazon.com (AMZN), Apple (AAPL), Alphabet (GOOGL), and Microsoft (MSFT), which are the five largest companies in the US and now make up about 22% of the S&P 500 market cap – are up an average of +36.4% YTD (led by AMZN’s +71.3%) and as a group have contributed +7.8% to the S&P 500 return of +2.5%, which means that the other 500 names in aggregate have lost -5.3%. Such narrow leadership is not healthy, but again, breadth has been much better since the selloff low on 3/23/20, and in fact, most of the performance divergence between the SPY and RSP this year occurred during the 2/19/20–3/23/20 peak-to-trough selloff when the FAAAM stocks held up much better than the rest of the index.
Still, as I mentioned earlier, some market segments are absolutely thriving, like clean energy, FinTech, and gold mining, while others are literally in a depression, like travel & leisure, oil services, and commercial real estate (as remote working has proven itself a viable option). For now, this is a real and consequential phenomenon. Longer term, however, my perspective is this: I have been on more Zoom meetings in the past four months than I had in my entire life until then, and they are much more effective than the typical conference call (in which most participants say nothing and remain invisible). But on the other hand, although a video conference is far better than a conference call and it can work well for intracompany team meetings, it in no way replaces an in-person client visit or sales meeting – still a bit too impersonal.
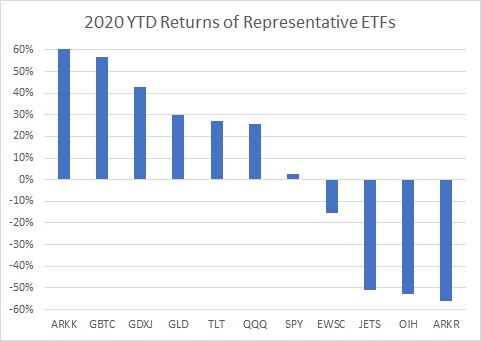
The chart below compares SPY against a variety of ETFs representing some diverse market segments for 2020 YTD. At the top are ARK Innovation (ARKK) up about +60%, whose largest holdings are Tesla (TSLA) and Square (SQ); followed by Grayscale Bitcoin Trust (GBTC); VanEck Vectors Junior Gold Miners (GDXJ); SPDR Gold Shares (GLD); iShares 20+ Year Treasury Bond (TLT); and Invesco Nasdaq 100 (QQQ), which is dominated by the FAAAM stocks. All are up more than +20% YTD. SPY is just above the zero line at +2.5%. Representing the underperforming market segments are Invesco S&P SmallCap 600 Equal Weight (EWSC), US Global Jets (JETS), which of course holds the struggling airlines; VanEck Vectors Oil Services (OIH), and ARK Restaurants (ARKR) – the latter three of which are bunched together at worse than -50% YTD performance. After the recovery rally initially peaked on 6/8/20, those latter three all resumed their downtrends while the others continued an upward march, led by the unlikely bedfellows of disruptive technology, bitcoin, and gold miners.
Concentration in the S&P 500 is now at its highest in decades, with FAAAM comprising a combined $6.5 trillion in market capitalization or about 24% of the index’s total market cap of $27 trillion (versus 16% just one year ago). In fact, without those five names, the S&P 500 would be negative on the year. Jonathan Golub, chief U.S. equity strategist at Credit Suisse, noted that net margins of the “FAAAM 5” taken together are 17.3% on average in the trailing 12 months, which is 70% higher than the rest of the S&P 500 companies. Profits for these five were up 3.1% in the same period against a 9.2% decline for the others. All five enjoy huge gross margins, and each has benefitted from the coronavirus-led shutdown measures and the resulting work/learn from home and increased e-commerce, while also riding the secular growth trends of cloud computing, IoT, and virtual teams. Some commentators even have suggested that these five stocks, plus perhaps some of the other dominant, disruptive names like NVIDIA (NVDA) and Netflix (NFLX), should become their own separate asset class – kind of like the aristocracy segregated from the masses. Hmmm….
The danger for the market if it does not broaden out is that, as Goldman Sachs has observed, many portfolio managers have a 5% limit on holding any one stock, so the average large-cap mutual fund already may have a 5% position in these names. But my expectation is that as the economy reopens again, supported by a vaccine and/or an effective treatment, the market indeed will broaden out into value stocks and smaller firms that are well-positioned to prosper – and notably, because passive flows into the broad indexes primarily benefit the largest companies, it will rely upon old-fashioned active selection.
On the other hand, O’Shares recently posted a graphic showing the correlation since 2004 of the performance of value stocks (S&P 500 Value Index) plotted against the 10-year Treasury yield. Except for the Trump Bump period, the correlation is strong, with value generally doing better as yields rise and doing worse as yields fall. So, if the trend holds, given that yields are expected to stay low (which the Fed is committed to), value should continue to lag. My caveat, however, is that value outperformed during the Trump Bump while yields fell, ostensibly in anticipation of the fiscal stimulus bill, so perhaps this will happen again in anticipation of a post-pandemic recovery led by beaten down value sectors (Financial, Industrial, Materials, Energy) – even if the Fed tries to control the yield curve to prevent longer-term rates from rising.
No doubt, value is so beaten down as to be virtually forgotten, a relic of tired old investing themes. I have written a lot on the persistent and stunning outperformance of growth over value, which ramped up in mid-2015 when the market became much more news-driven, with narrow leadership led by secular-growth, mega-cap Tech companies. First Trust recently published a graphic showing the annual total returns through 7/17/20 of S&P 500 Pure Growth (RPG) vs. S&P 500 Pure Value (RPV), including a 15-year avg. annual of 10.91% vs. 6.36%; 1-year (12.63% vs. -22.30%); and YTD (6.91% vs. -28.20%). Of course, the wipeout in recent years has heavily influenced the longer-term averages.
Earnings and valuations:
Q2 earnings reporting season is now in full swing, and according to FactSet, 63% of the companies in the S&P 500 have reported actual results, with 84% of companies reporting earnings above estimates, with a 21.8% aggregate positive surprise. Furthermore, 69% of companies have reported revenues above estimates, with a 2.4% aggregate positive surprise. All these numbers are well above their five-year averages. Of the five FAAAM names, the first four on the list (FB, AMZN, AAPL, GOOGL) all reported last Thursday and mostly blew away estimates (with the exception of GOOGL, which reported its first ever revenue decline), further solidifying their dominance.
FactSet’s current estimate is that aggregate S&P 500 earnings for Q2 fell about -35% year-over-year, which would be the largest year-over-year decline in earnings reported by the index since Q4 2008 (-69.1%). Although horrible, this is an improvement over where it was previously (at more than -42%), so again, earnings are looking better than expected. The consensus estimate is now -22.9% for Q3 and -12.1% for Q4, followed by a return to earnings growth in Q1 2021 at +13.4%.
As of the end of July, the forward NTM (next 12 months) P/E on the S&P 500 sits at about 21.3x. In my June article, I listed 10 factors that support the lofty valuation – plus further expansion to perhaps 23-25x before earnings start to catch up – so long as the economy stays in expansionary mode. Those factors include massive global monetary and fiscal stimulus, negative real interest rates (inflation-adjusted), rapid technological breakthroughs transforming society, and the growing allocation within the broad stock indexes to secular-growth disruptive Tech (as opposed to the cyclical and capital intensive industries of the past). All these factors remain intact, and in fact I might add to that list the following: 1) Q2 earnings season looks good so far, with companies beating more on the top and bottom lines than the 5-year averages, 2) the cyclical semiconductor industry looks strong, with a backlog of orders driven by rapid growth in 5G, AI/ML, robotics, autonomous vehicles, blockchain, precision medicine, etc., 3) our banking industry is strong and well-capitalized, and 4) the offshore Chinese yuan is holding strong against the dollar, having fallen back below the important 7.0 exchange threshold. Thus, I continue to believe we have entered a “new normal” of elevated valuation multiples.
Last I saw, expectations are for $128/share EPS estimate for the S&P 500 in full-year 2020 followed by a big leap in 2021 to $163. July’s 3,271 closing price on the index implies a P/E of 25.5x for 2020 but 20.1x for 2021. Thus, if the forward P/E is at 22x by year end, it would imply a price level of nearly 3,600, which suggests 10% upside from here for the S&P 500. With Q2 reports looking better than expected and with the “Fed Put” (from ZIRP, backstopping corporate credit, and flooding the market with unlimited liquidity) serving to boost investor confidence and tighten corporate bond spreads, it all seems quite doable. Notably, the dividend yield on the S&P 500 is 1.85%, which compares quite favorably with the 10-year Treasury yield at 0.53% (which when inverted, implies an equivalent P/E ratio of 189x, according to the simple “Fed Model”). With bonds at such lofty valuations and offering such low yields, it’s no wonder stocks are attracting so much capital.
The economy, the Fed, inflation, and interest rates:
The federal budget deficit soared to around $3 trillion for the 12 months ending June 30, 2020, and it continued to grow in July. Spending has risen dramatically in response to the pandemic, of course, while tax revenue plummeted. And now, Congress is trying to pass a fourth coronavirus relief/stimulus bill, which should come in somewhere between the Dems’ $3 trillion bill that was passed by the House in May and the GOP’s recent $1 trillion Senate proposal.
US real GDP shrunk by -9.5% during Q2, which was an annualized rate of -32.9% (versus -34.5% expected), with the bulk of the damage occurring in April when it seemed the entire consumer economy was shutdown (except for grocery stores and online shopping). This was the worst number ever, and far worse than the previous post-WWII reading of -10.0% annualized rate in Q1 1958 when we dealt with the Asian Flu. However, unlike prior economic crises, this one was precipitated by a government-forced shutdown when markets were perched at all-time highs and supported by accommodative central banks and abundant risk capital. Thus, we saw rapid recovery from the initial selloff, which should accelerate once the virus is controlled.
For example, the whole lumber sector was hurt badly in the first quarter as COVID shut down real estate construction. But then lumber prices rose 60% in Q2 as construction demand roared back faster than anticipated and suppliers are now struggling to fulfill it.
As of 7/31/20, the 30-year Treasury yield fell to 1.20%, while the 10-year T-note yields 0.53% (nearly an all-time low), the 2-year T-note 0.11% (an all-time low!), and the 3-month T-bill 0.10%. So, the 3-month/10-year spread is about +43 bps and the 2-10 spread is +42 bps, as the Fed is essentially controlling the yield curve. After the latest FOMC meeting, there has been no change in its ultra-dovish posture, and looking ahead, Fed Funds Futures give 100% probability that ZIRP will remain in place through at least March 2021 – and likely much longer.
Real interest rates have been declining in response to Fed policies such that the 10-year Treasury Inflation-Protected Security (TIPS) has been trading with a negative yield since late March and continues to fall. It is now at -1.02%. Thus, given the 10-year Treasury yield of 0.53%, the implied breakeven inflation rate is 1.55%, which is back to near where it was before the pandemic selloff.
Last I heard, our federal debt has topped $26 trillion, or about 123% of GDP. And let’s not forget about the future liabilities of Social Security and Medicare and other growing entitlements, plus state and municipality liabilities, many of which will ultimately need a federal bailout (since only the federal government has the ability to print more dollars). But on the other hand, given ZIRP and ultra-low interest payments on our Treasury bonds, the debt carrying cost has not risen nearly so much. And given our continued role as the world’s strongest economy, global investors still flock to the US in the face of global uncertainty and recession, and that capital has helped stabilize credit markets and boost equity markets.
As the US dollar falls relative to other major currencies, it increases the buying power of foreign investors for dollar-denominated risk assets like US stocks, gold, and commodities, while also easing the debt service burden of emerging market countries, whose debt is predominately dollar-denominated. The US Dollar Index (DXY) closed July at 93.46, and although it has fallen quite a bit since spiking above 100 during the COVID selloff, First Trust has pointed out that it is merely approaching its historical norm of around 91 over the past 30 years, which spans a DXY peak of 120.90 on 7/5/01 to a low of 71.33 on 4/22/08.
Moreover, as the econ team at First Trust has pointed out, one reason that we aren’t seeing inflation (despite the federal government printing money to provide over 25% of personal income!) is that the personal saving rate spiked to 32.2% in April and remains elevated at 23.2% in May and 19.0% in June, compared to the previous high of 17.3% in May 1975 and an average rate during 2019 of only 7.9%. However, this might be undermining the Fed’s grand plan to reduce its massive balance sheet and the federal debt by debasing the dollar and thus inflating them away.
The case for gold:
After blasting past the previous high of $1,923 from September 2011, the price of gold is nearing the $2,000 threshold (although adjusted for inflation, gold was higher in 1980 when inflation and interest rates hit a peak). Bitcoin is breaking out higher, as well. Is this all just another “tulip mania”?
Many economists and investment managers (including Jeffrey Gundlach of DoubleLine Capital and Ray Dalio of Bridgewater Associates) fear that the exploding fiscal deficit will soon lead to a drastic debasement of the dollar. And assuming our international trade deficit starts widening again when the economy reopens, it creates a double whammy on the dollar. From my standpoint, even though I expect capital to continue to flow into US equities, I also expect gold and gold miners to continue to march higher along with silver and even cryptocurrencies like bitcoin and ether – and not just as speculation on their continued momentum or as hedges against potential inflation, dollar weakness, untethered Modern Monetary Theory (MMT), a Far Left socialist takeover of government, a resurgence in COVID deaths, a protracted “L” or “U” shaped economic recovery, or anything else that might erode the confidence of consumers, businesses, or investors. Although momentum and hedging are good reasons to hold gold and gold miners, I see a larger growth story behind them.
It used to be that US Treasuries were an attractive safe haven during times of uncertainty, but with the 10-year yield rapidly becoming almost negligible (0.53% as of 7/31/20, after starting the year around 1.9%), Treasuries have lost much of their appeal – making gold much more attractive to investors as a store of value. Although the TLT is still holding up well (as shown in the earlier chart), it seems to me that once the inevitable and necessary (and stealthy) synchronized global devaluation of the major currencies to “inflate away” debts becomes more evident, global capital is likely to rotate more rapidly out of sovereign debt into hard assets like real estate and commodities, including gold and silver. I personally hold positions in gold, silver, gold miners, and several cryptocurrencies (including bitcoin and ether).
Final thoughts:
M3 Money Supply is growing parabolically at a pace not seen other than with the country being at war. But I suppose we are at war with this intractable coronavirus. As a result, MMT and its belief in unlimited federal deficit spending (i.e., “deficits don’t matter”) essentially has arrived, and it has opened Pandora’s Box. Global debt has exploded, and with so much of it denominated in US dollars, the Fed must keep printing dollars to keep it all afloat (essentially serving as the world’s central bank) or risk an emerging market currency crisis and global economic depression. So, the question is, what might be the ultimate solution?
I wonder if one way out of this mess is to have the G-7 get together at the end of the pandemic crisis and jointly agree to cancel all their respective intragovernmental debt that has been bought and held through QE by each central bank (but not the public portion of the sovereign debt held by other countries, states, funds, or outside investors, nor the non-governmental debt held by central banks like asset-backed securities or fixed income ETFs). Then, they could restore the gold standard so that fiat currencies are no longer just “funny money.” Only then will central banks be able to offer positive real interest rates and once again attract willing income-seeking investors.
But that’s a longer term concern. For now, once the economy is unleashed from its COVID shutdown, I still believe we are in the early stages of a new expansionary economic phase and bull market that could run for several years, rather than a prolonged recession and a bear market rally destined to fail. It would be driven by an upswing in manufacturing activity, infrastructure spending, and new technologies like 5G cellular, the Internet of Things (IoT), e-commerce, cloud computing, AI/ML, autonomous technology, robotics, 3-D printing, clean energy, blockchain, quantum computing, nanotechnology, genomics, precision medicine, and even space travel – all of which would suggest a broad-based bull market in which secular growth juggernauts “share the wealth” so to speak with value and smaller caps.
SPY Chart Review:
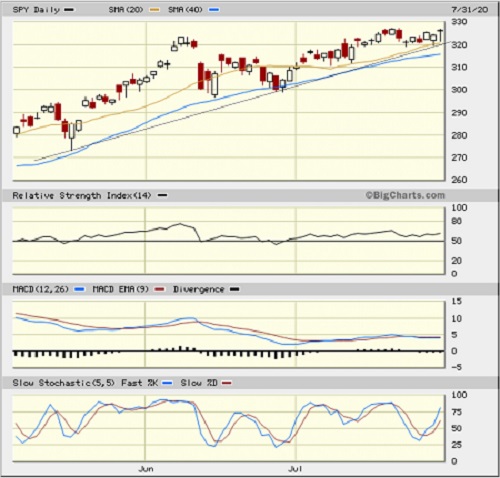
The SPDR S&P 500 ETF (SPY) closed July at 326.52, which is about 2.9% below its all-time high of 336.36 on 2/19/20. The 20-day simple moving average (SMA) provided reliable support throughout the month of July, and the 50-day crossed up bullishly through the 200-day in early-July in what is commonly termed a “golden cross.” It also has been supported by a defined uptrend line since early April. After a post-selloff recovery surge that peaked on 6/8/20 followed by a pullback and consolidation period for the rest of June, SPY climbed steadily higher throughout July. Oscillators RSI, MACD, and Slow Stochastic are all either in neutral positions or pointing higher. The final candlestick of July could be taken as a bearish hanging man formation, but given the cautious nature of trading activity last week, including a more observable pullback in the Dow Jones Industrial Average resulting in a bullish hammer pattern, I think the SPY candlestick is also a bullish hammer pattern. As I said in mid-June, it appears that the path of least resistance is upward, and a move by end of summer to test the all-time high from 2/19/20 is likely.
Latest Sector Rankings:
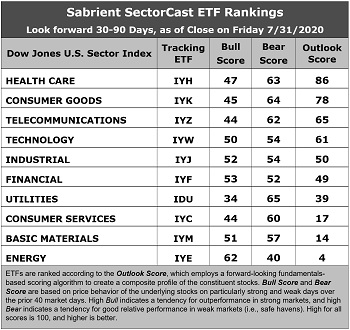
Relative sector rankings are based on our proprietary SectorCast model, which builds a composite profile of each of nearly 500 equity ETFs based on bottom-up aggregate scoring of the constituent stocks. The Outlook Score employs a forward-looking, fundamentals-based multifactor algorithm considering forward valuation, historical and projected earnings growth, the dynamics of Wall Street analysts’ consensus earnings estimates and recent revisions (up or down), quality and sustainability of reported earnings, and various return ratios. It helps us predict relative performance over the next 2-6 months.
In addition, SectorCast computes a Bull Score and Bear Score for each ETF based on recent price behavior of the constituent stocks on particularly strong and weak market days. A high Bull score indicates that stocks within the ETF recently have tended toward relative outperformance when the market is strong, while a high Bear score indicates that stocks within the ETF have tended to hold up relatively well (i.e., safe havens) when the market is weak.
Outlook score is forward-looking while Bull and Bear are backward-looking. As a group, these three scores can be helpful for positioning a portfolio for a given set of anticipated market conditions. Of course, each ETF holds a unique portfolio of stocks and position weights, so the sectors represented will score differently depending upon which set of ETFs is used. We use the iShares that represent the ten major U.S. business sectors: Financial (IYF), Technology (IYW), Industrial (IYJ), Healthcare (IYH), Consumer Goods (IYK), Consumer Services (IYC), Energy (IYE), Basic Materials (IYM), Telecommunications (IYZ), and Utilities (IDU). Whereas the Select Sector SPDRs only contain stocks from the S&P 500 large cap index, I prefer the iShares for their larger universe and broader diversity.
Here are some of my observations on this week’s scores:
1. Healthcare has taken the top spot with an Outlook score of 86. The sector displays solid sell-side analyst sentiment (positive net revisions to EPS estimates), a modest forward P/E of 17.1x, an attractive projected year-over-year EPS growth rate, the lowest forward PEG (forward P/E divided by projected EPS growth rate) of 1.65, solid return ratios, and good insider sentiment (open market buying). Consumer Goods (Staples/Noncyclicals) takes the second spot with an Outlook score of 78 as it displays best analyst sentiment (positive EPS revisions), a reasonable forward P/E of 20.9x, and the best insider sentiment. Rounding out the top six are Telecom with a 65, Technology at 61, Industrial at 50, and Financial at 49. Interestingly, 3 of the top 4 (Consumer Goods, Telecom, and Technology) are best positioned to benefit from a weaker dollar.
2. The bottom three sectors are all cyclicals: Energy with an Outlook score of 4, Basic Materials at 14, and Consumer Services (Discretionary/Cyclicals) at 17, which generally reflects the uncertainty (and pulled guidance) for many companies in these sectors. They have relatively high forward P/E ratios and low return ratios.
3. Looking at the Bull scores, Energy displays by far the top score of 62, as stocks within this sector have benefited from short-covering and speculation to display relative strength on strong market days. Utilities scores the lowest at 34. The top-bottom spread of 28 points reflects quite low sector correlations on strong market days. It is desirable in a healthy market to see low correlations reflected in a top-bottom spread of at least 20 points, which indicates that investors have clear preferences in the market segments and stocks they want to hold (rather than broad risk-on behavior).
4. Looking at the Bear scores, defensive sector Utilities takes the top spot with a score of 65, followed closely by Consumer Goods (Staples/Noncyclicals) and Healthcare at 64 and 63, respectively, which means that stocks within these sectors have been the preferred safe havens lately on weak market days. Energy displays the lowest score of 40, as investors have fled during recent market weakness. The top-bottom spread is 25 points, which reflects low sector correlations on weak market days. Ideally, certain sectors will hold up relatively well while others are selling off (rather than broad risk-off behavior), so it is desirable in a healthy market to see low correlations reflected in a top-bottom spread of at least 20 points.
5. Healthcare displays the best all-around combination of Outlook/Bull/Bear scores, while Energy is by far the worst. Looking at just the Bull/Bear combination, Healthcare is the best, followed closely by Consumer Goods (Staples/Noncyclicals), indicating superior relative performance (on average) in extreme market conditions (whether bullish or bearish), while Utilities has been the worst. It’s interesting that Healthcare was scoring the worst just 6 weeks ago, and now it’s the best.
6. I would say this week’s fundamentals-based Outlook rankings maintain a neutral bias, given that Technology, Industrial, and Financial are scoring pretty well while three cyclical sectors sit at the bottom, and with defensive Consumer Goods sitting near the top. However, in this unprecedented climate, it is not surprising that the near-term outlook in our fundamentals-based model is muddled. While the economy tries to gradually come out of lockdown mode, equity investors are positioning in anticipation of a better future, i.e., they are essentially predicting a bullish turn in our rankings over the next several months. Keep in mind, the Outlook Rank does not include timing, momentum, or relative strength factors, but rather reflects the consensus fundamental expectations at a given point in time for individual stocks, aggregated by sector.
ETF Trading Ideas:
Our Sector Rotation model, which appropriately weights Outlook, Bull, and Bear scores in accordance with the overall market’s prevailing trend (bullish, neutral, or defensive), maintains a bullish bias and suggests holding Healthcare (IYH), Financial (IYF), and Energy (IYE), in that order. (Note: In this model, we consider the bias to be bullish from a rules-based trend-following standpoint when SPY is above both its 50-day and 200-day simple moving averages.)
If you prefer a neutral bias, the Sector Rotation model suggests holding Healthcare, Consumer Goods (Staples/Noncylicals), and Telecom, in that order. On the other hand, if you are more comfortable with a defensive stance on the market, the model also suggests holding Healthcare, Consumer Goods (Staples/Noncylicals), and Telecom, in that order.
An assortment of other interesting ETFs that are scoring well in our latest rankings include iShares US Broker-Dealers & Securities (IAI), Invesco Dynamic Food & Beverage (PBJ), VanEck Vectors Semiconductor (SMH), VanEck Vectors Biotech (BBH), Pacer US Cash Cows 100 (COWZ), First Trust NASDAQ Semiconductor (FTXL), First Trust NASDAQ Technology Dividend Income (TDIV), Schwab US Dividend Equity (SCHD), iShares US Healthcare Providers (IHF), VanEck Vectors Pharmaceutical (PPH), SPDR MFS Systematic Core Equity (SYE), Franklin LibertyQ Global Equity (FLQG), Innovator IBD Breakout Opportunities (BOUT), and iShares Evolved US Consumer Staples (IECS).
As always, I welcome your thoughts on this article! Please email me anytime. Any and all feedback is appreciated!
IMPORTANT NOTE: I post this information periodically as a free look inside some of our institutional research and as a source of some trading ideas for your own further investigation. It is not intended to be traded directly as a rules-based strategy in a real money portfolio. I am simply showing what a sector rotation model might suggest if a given portfolio was due for a rebalance, and I do not update the information on a regular schedule or on technical triggers. There are many ways for a client to trade such a strategy, including monthly or quarterly rebalancing, perhaps with interim adjustments to the bullish/neutral/defensive bias when warranted, but not necessarily on the days that I happen to post this article. The enhanced strategy seeks higher returns by employing individual stocks (or stock options) that are also highly ranked, but this introduces greater risks and volatility. I do not track performance of the ideas mentioned here as a managed portfolio.
Disclosure: At the time of this writing, among the securities mentioned, the author held long positions in SPY, GLD, GDXJ, GBTC, SQ, and ARKK.
Disclaimer: This newsletter is published solely for informational purposes and is not to be construed as advice or a recommendation to specific individuals. Individuals should take into account their personal financial circumstances in acting on any opinions, commentary, rankings, or stock selections provided by Sabrient Systems or its wholly owned subsidiary, Gradient Analytics. Sabrient makes no representations that the techniques used in its rankings or analysis will result in or guarantee profits in trading. Trading involves risk, including possible loss of principal and other losses, and past performance is no indication of future results.