Sector Detector: Tech leadership and passive indexing show signs of rotation into value factor and active selection
 by Scott Martindale
President & CEO, Sabrient Systems LLC
The April-August 5-month stretch was the best 5-month period for the S&P 500 (+35%) since 1938. The index was +6.3% higher than its pre-COVID high on 2/19/20 and +56.2% higher than its COVID selloff low on 3/23/20. But any market technician would tell you that the further the market rises without a pause, the more severe the inevitable pullback. And indeed, along came the traditionally challenging month of September and a nasty bout of profit-taking mixed with capital preservation – and exacerbated by the standoff on new fiscal stimulus, an uptick in COVID cases hindering global economic reopening, and the potential for a SCOTUS nomination firestorm. Many of the investor darlings from among the disruptive, secular-growth Technology companies that had been surging so strongly have suddenly fallen hard, with the S&P 500 (SPY) pulling back -10.3% from its 9/2/20 intraday high to its 9/21/20 intraday low and the tech-laden Nasdaq 100 (QQQ) falling -14.3%.
After giving back all of August’s strong gains, perhaps Monday was the capitulation day from which the market can recover anew. Q3 earnings reporting season starts in a couple of weeks, so it will be important to get a read on the trajectory of earnings recovery and forward guidance.
I have written often about the stark market bifurcation that has developed over the past few years, beginning with the unwinding of the “Trump Bump” reflation trade in light of the emerging trade wars. It led to historic extremes in Growth over Value and Large over Small caps, with the broad-market, cap-weighted indexes hitting new highs as investment capital has favored mega-cap, secular-growth Tech and passive, market-cap-weighted ETFs. But today, although I think it is unlikely that investors are giving up on Technology names, their high relative valuations as the economy enters what I see as an early-stage expansionary cycle appear to be opening the door for greater market breadth and some capital rotation into value, cyclicals, and smaller caps.
My expectation is that, as the historic imbalances in Value/Growth and Small/Large performance ratios gradually revert and market leadership broadens, strategic beta ETFs, active selection, and equal weighting should thrive once again. This should be favorable for value, growth-at-a-reasonable-price (GARP), and quality-oriented strategies like Sabrient’s, although not to the exclusion of secular growth industries. In other words, an investor should be positioned for both cyclical and secular growth.
This is why, rather than continuing to wait around for the value/growth performance gap to converge, we chose to introduce new enhancements to our GARP stock selection process to better balance value-oriented cyclical growers with consistent secular growers while also reducing relative volatility versus the benchmark. Moreover, we have leveraged our full suite of 7 core quantitative models to create 11 new strategic-beta, passive indexes. You will be hearing more about these in the near future.
In this periodic update, I provide a comprehensive market commentary, offer my technical analysis of the S&P 500 chart, review Sabrient’s latest fundamentals-based SectorCast rankings of the ten US business sectors, and serve up some actionable ETF trading ideas. In summary, while I still have a favorable long-term view on stocks, there will be plenty of volatility ahead. In addition, our sector rankings have a moderately defensive bias (given that the near-term outlook in our fundamentals-based model is muddled and the Outlook scores are tightly bunched), the technical picture looks might be setting up for a bullish reversal, and our sector rotation model sits in a neutral posture. As a reminder, you can find my latest Baker’s Dozen slide deck and commentary on terminating portfolios at http://bakersdozen.sabrient.com/bakers-dozen-marketing-materials.
Market Commentary:
The speed of the recovery rally from the pandemic lows was historic, but in retrospect, it makes sense. With a robust economy suddenly shut down from no fault of its own, and with an apparent light at the end of the pandemic tunnel, a gradual reopening of the economy underway, an expectation of historic economic reacceleration no matter who wins the impending election, and massive monetary and fiscal stimulus putting risk capital in the hands of big hedge funds, corporate chieftains, idled salespeople, and furloughed waiters alike, it’s little wonder that much of that capital found its way into stocks. Investors across the board seem to be mimicking MAD Magazine’s Alfred E. Neuman’s slogan, “What, me worry?”
But if you looked under the hood, the dispersion was huge, with big winners and big losers, largely influenced by their industries – e.g., work-from-home (WFH) technology thrived while travel & leisure was in a depression. No doubt, the economy in general and those highly impacted industries in particular still face a long list of obstacles including an unyielding pandemic, extreme political polarization (like different planets), intractable social unrest, an existential confrontation with China, massive destruction from historic fires, hurricanes, and rioting, and poor visibility in corporate earnings. So, yes, it was inevitable that stocks would need to pullback after going almost straight up for two months, capped off by a “blow-off top” on the first two days of September.
The CBOE Volatility Index (VIX) held well below the 20 handle throughout all of 2019 until late February this year, before the coronavirus sent it surging to new all-time highs. And despite a robust market recovery, it has remained above 20 ever since, which I think is another indication that the market isn’t truly healthy, given narrow leadership, big losers across a wide swath of the market, and total neglect of the cyclical sectors that typically thrive in a strong economy.
Another contributor to the elevated volatility is the increase in algorithmic trading. As algorithms feed off one another, price movements are exaggerated and volatility increases, which reduces liquidity as market makers are forced to reduce the inventory their firms allow them to carry. Without liquidity, price movements are further exaggerated, and the vicious cycle feeds on itself until the big institutional money comes in to put a bid under the market and restore confidence. In addition, a WSJ article earlier this month uncovered what likely created August’s unusual options activity and massive runup in the Nasdaq Composite Index by outlining how the mega investment firm/incubator SoftBank Group (STFBY) apparently launched a trading arm to buy $4 billion of shares in the mega-cap Tech stocks and leveraged it further through call options to control $50 billion worth of those stocks. Both the algo trading and SoftBank’s manipulation are just more signs of the times.
Tech dominance and valuations:
Despite the pullback, concentration in the S&P 500 remains near its highest in decades, and the five dominant mega-cap FAAAM stocks – Facebook (FB), Apple (AAPL), Amazon (AMZN), Alphabet (GOOGL), and Microsoft (MSFT) – compose over $6.5 trillion in market capitalization (although down from over $7 trillion). They account for about 25% of the total market cap of the S&P 500 (versus 16% last year) and about 50% of the Nasdaq 100. Led by YTD returns of +60.2% in AMZN and +51.0% in AAPL (through Monday 9/21/20), FAAAM have returned an average of +33.7% so far this year and contributed +8.1% to the cap-weighted S&P 500 return of only +3.1%, which means the other 500 stocks in the benchmark in aggregate lost -5.0%. Further illustrating the narrow market leadership, the equal-weight S&P 500 is down -6.6% and the equal-weight S&P SmallCap 600 Index is down -15.8% YTD. And amazingly, the market cap of AAPL exceeded $2.0 trillion before the pullback, and it still sits at nearly $1.9 trillion, which all by itself exceeds the total market capitalization of the entire Russell 2000 small cap index!
The growing dominance of a few juggernauts is troublesome for a few reasons. One is an apparent lack of confidence in the broader economic recovery. Another is the apparent preference for passive indexing (particularly the broad, cap-weighted indexes). But perhaps the main reason is their extreme influence over our economy, the marketplace, privacy, free speech, and indeed our very way of life. They have the power to control the narrative. They can either acquire or crush any new entrants into their domains. All of this has contributed to rising societal discord, rising cases of depression, disinflation, wealth inequality, populism, and protectionism – leading to growing calls to rein them in with anti-monopolistic measures.
On the other hand, as I have discussed in previous articles, the Technology sector may be able to justify elevated valuations given its leadership in high-growth secular trends that are revolutionizing the way we work and live, as well as high operating leverage, reliable earnings, strong cash flow generation, large cash positions, pristine balance sheets, and independence from any underlying commodity price that characterize so many of the dominant players in the space. These, along with today’s ultra-low cost of capital, combine to justify higher valuations than many long-time investors might be comfortable with. Indeed, today’s Tech sector is far different than 1999. Moreover, they have seen rapid improvement in their already-strong businesses during the pandemic crisis due to work-from-home (WFH) and e-commerce dynamics. And again, we have all that market liquidity creating demand for these names that far outstrips the limited supply of shares. For investors, stocks and options in big Tech companies are highly liquid, which makes them attractive to hold, and for institutional portfolio managers who find themselves underperforming benchmarks this year due to the historically elevated valuations in the space, they may find it necessary to chase these names higher into the end of Q3 – and likely into the end of the year.
DataTrek pointed out another interesting observation. The high multiple on the S&P 500 is not solely due to Big Tech: “Proctor & Gamble, Home Depot, Coke and Walmart all trade for 24x earnings, right on top of Google and Facebook. Disney actually goes for 50x 2021 numbers. Bottom line: big multiples are (almost) as much a function of competitive position and potential cyclical upside as they are simply ‘tech premiums.’”
And even at an historically elevated forward P/E of 21.5x on the S&P 500, it provides a dividend yield of around 1.85%, which is so much more attractive than 0.69% on the 10-year Treasury, and it provides greater capital appreciation potential as well. Flip the P/E upside down and you get an earnings yield of 4.65%, which also compares quite favorably to the Treasury yield. And this doesn’t consider the benefit to the stockholder of share buybacks, which are way down this year in reaction to a combination of holding cash to weather pandemic uncertainties, certain market segments needing federal financial support, and the negative perception of using cash to buy back shares (which only benefits the shareholder) rather than maintaining employment levels, new hiring, or capital spending on business growth. In addition, gold tends to do well when the equity risk premium (earnings yield minus 10-yr Treasury yield) is high or rising.
A nascent rotation to value and smaller caps?
The divergences in Growth/Value and Large/Small has been stark, as illustrated by the 5-year chart below of the Invesco S&P LargeCap 500 Pure Growth ETF (RPG) vs. Invesco S&P SmallCap 600 Pure Value ETF (RZV). You can see that the RZV got a brief pop following the 2016 election before falling back in line with RPG, but then RPG began to outperform starting in 2H2018, with a massive bifurcation in 2019 and most of 2020.
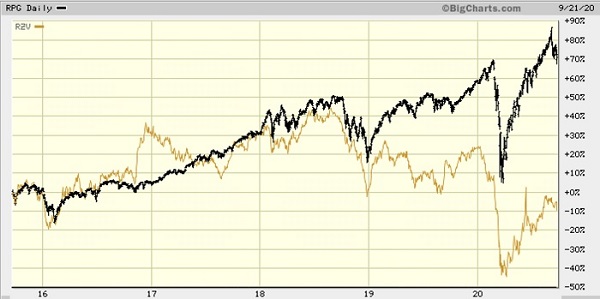
With current inflation and future expectations so low, it offers some explanation as to why value stocks have continued to underperform growth for most of the year. Historically, there is usually a strong correlation between inflation expectations and the Value/Growth ratio, but the recovery in inflation expectations during the COVID recovery has not followed suit, at least so far.
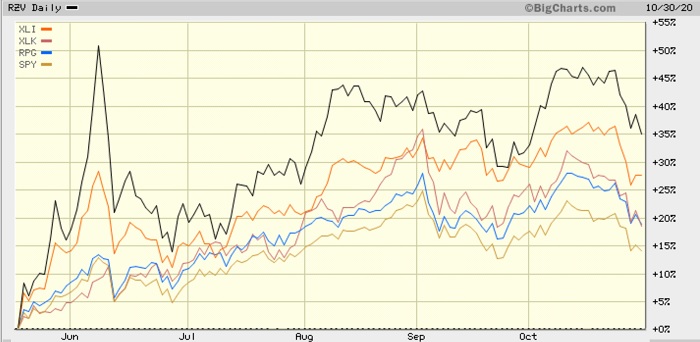
However, even if the pullback in mega-cap Tech fails to recover quickly, it does not necessarily imply a new bear market. Rather, as the economy recovers, capital is likely to broaden its destination from a sole focus on Tech firms that thrive during lockdowns and WFH into some of the lagging industries that offer much more attractive valuations. In fact, it already may be underway, as we have seen some rotation of institutional money out of the winners and into some of the lagging value-oriented and cyclical sectors like Industrial and Financial. The continued tightening in corporate credit spreads has been supportive of this “risk-on” rotation. The chart below compares RPG and RZV against the SPDR S&P 500 (SPY), Technology Select Sector SPDR (XLK), and the cyclical Industrial Select Sector SPDR (XLI). You can see that RZV and XLI were greatly outperforming over the past couple of months (prior to Monday’s broad selloff).
Expansionary monetary policy and economic recoveries have historically been beneficial to smaller caps as well as to value stocks. Moreover, the Price/Book (P/B) for Growth stocks versus Value stocks overall is at a record high. And as ProShares recently pointed out, it has been 20 years since the Price/Book (P/B) for the S&P MidCap 400 versus the S&P 500 was this low. For Value to continue outperforming in earnest, we likely will need to see more incentive for money growth (i.e., a steeper yield curve) and gradually rising inflation expectations – including confirmation of economic growth from industrial metals like silver and copper.
Despite little movement in Energy stocks, the oil market has been showing signs of strength over the past few weeks. Voluntary oil supply cuts from OPEC and shut-in production in the US and elsewhere, coupled with some increase in global oil demand are drawing down the previously swollen inventories. Some oil observers expect this trend to continue into year-end. In addition, manufacturing and services activity have both rebounded noticeably. Housing is worth a mention, as well, as exodus from the big cities is driving demand for new construction, remodeling, and second homes, and the associated “deurbanization” is expected to drive a second wave of satellite office development, new distribution centers, and data centers.
Speculators and momentum traders have been dealt some September pain in their profits from the “fast and furious” recovery rally. So, with market valuations – particularly among the popular secular-growth Tech names – still at elevated levels, and with value, cyclicals, and smaller caps seemingly positioned for improved relative performance, I think it is likely that Quality metrics will come back into favor as forward earnings visibility improves. Those metrics should include the following:
- Strong sales growth
- Strong free cash flow
- Consistent margin expansion
- Consistent & reliable earnings growth
- Positive analyst revisions
- Good ROE
- Sustainable earnings quality (positive trends in accruals and cash flow)
- Strong balance sheet
- Manageable debt load
- Attractive valuation
Inflation and Federal Reserve monetary policy:
It was interesting to see the blockbuster M&A deals that were announced last week, including NVIDIA’s (NVDA) $40 billion purchase from Softbank of ARM Holdings for its widely-used (including in Apple and Samsung phones) low-power, high-performance semiconductors, as well as Gilead’s (GILD) move to beef up its cancer drug lineup with a $21 billion acquisition of Immunomedics (IMMU), a clinical-stage biopharma focused on cancer treatments that has never come close to profitability.
Such numbers often lead me to harken back to the start of my career in the oil industry as a structural engineer for Gulf Oil in Houston in the early 1980’s, when Gulf was bought by Standard Oil of California for $13 billion in what was the largest acquisition in corporate history at the time, and the combined entity was renamed Chevron Corp (CVX). Back then, you could buy a major oil company with abundant real assets in the ground worldwide and extensive physical infrastructure to transport, refine, and sell essential products for far less than it costs today for a clinical-stage biopharma. But then again, the dollar buys far less and the stock market is far higher now than in 1985.
Speaking of inflation, as I have often discussed through the years, our economy’s dependence upon unlimited Fed monetary stimulus has resulted in stunning asset inflation with little in the way of wage inflation. When combined with the big increase in productivity, leading to strong bottom-line growth with much less top-line growth, it has widened society’s wealth gap, as those with the greatest access to capital (the “haves,” aka “job creators”) have benefited far more than those without access (the “have-nots,” aka “job seekers”). The same holds true with other major economies around the world and their central banks. This puts central banks in a difficult spot, as both a rising economy and a rising stock market have become dependent upon government handouts.
So, the Federal Reserve is bound and determined to juice inflation. The Fed first announced its current 2% inflation target back in 2012, but core Personal Consumption Expenditures price index (PCE) has averaged only 1.4%. Thus, the Fed has adjusted its strategy from a balance between inflation and employment to instead prioritize increasing employment, even to the detriment of controlling inflation if necessary. It will hold the federal funds rate near zero until two challenging goals are achieved: 1) its preferred inflation indicator, the Personal Consumption Expenditures Price Index (PCE), averages above 2% over time in what is called flexible average inflation targeting (FAIT), and 2) the unemployment rate returns to about 4.0%.
The 5-year TIPS breakeven inflation rate (the expected average inflation rate over the next 5 years) rose quickly and steadily (along with stocks) since the market selloff and now sits at 1.58% as of 9/18/20 (vs. 0.14 selloff low). However, its rise has stalled while still below the long-term historical average, below the 1.65% reading from the pre-COVID stock market peak on 2/19/20, and below the trailing 5-year peak of 2.16% on 5/17/18 (when rhetoric was escalating in the China trade war. So, it appears that investors assume this inflation target is unlikely to be met any time soon. And at last week’s FOMC meeting, the Fed itself seemed to agree, so it committed to keeping interest rates low through at least 2023. You can watch for early signs of an impending rise in inflation, which would include a falling dollar (versus other major currencies), a continued rise in gold price, and a rising TIPS breakeven rate.
Unlimited Fed liquidity and government deficit spending have been crucial to keeping our government solvent and averting a total economic meltdown, which in days of yore would have been a surefire path to inflation. The CBO expects the deficit to hit 13% of GDP by 2050. Fed monetary policy has included zero interest rate policy (ZIRP), de facto yield curve control (YCC), open-ended quantitative easing (QE), and the buying of corporate bonds (including junk bonds and fixed-income ETFs. They might even start buying equity ETFs at some point if the stock market falters, as well as “bailout bonds” to fund the greatly underfunded pension liabilities of states and municipalities (primarily among the blue states). Of course, the Fed’s stated purpose is price stability and support for businesses to lower unemployment. But it also has resulted in a de facto “Fed put” (an analogy to an equity put option) that has placed a perceived floor under the market and induced a speculative fervor, FOMO (“Fear of Missing Out”), and a TINA (“There is No Alternative!”) mindset for equities. The power of the Fed put is evidenced by the record level of the ratio of stock market capitalization to GDP.
The Fed and other major central banks around the world appear poised to keep interest rates low for years to come, which supports equity valuations in three primary ways: 1) discounting of future earnings streams at a low discount rate computes a higher present value, 2) lower cost of capital boosts EPS, and 3) bonds as an investment alternative present much less upside for capital appreciation and lower yields for income – and in fact, they offer little diversification benefit toward achieving a pension fund or endowment’s total return objective.
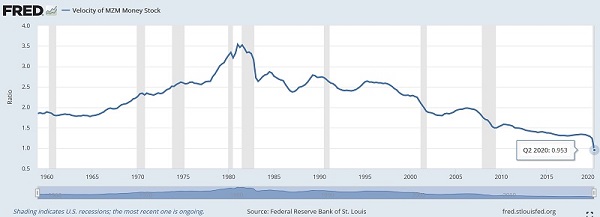
Recall the formula: Nominal GDP = Quantity of Money x Velocity of Money. So, the Fed has been flooding the economy with historic liquidity to boost the Quantity of Money and stoke a rise in inflation – both to shore up an economy paralyzed by the pandemic and to “inflate away” massive levels of federal debt. Stimulating the Velocity of Money has been a challenge, as the St. Louis Fed shows that it has been in a downtrend since 1981 (when it measured about 3.5) and has just fallen off a cliff (with the COVID lockdown) to less than 1.0 (as shown in the chart below) – which means there is no multiplier effect at all on the money being injected into the economy. Boosting it will entail reopening the economy, ongoing fiscal stimulus (e.g., low or modest tax rates, business incentives, deregulation, infrastructure spending), a steepening yield curve to incentivize lending, falling credit spreads, and resurgent corporate capital expenditures.
Globally, the amount of central bank stimulus is much larger than what took place during the Financial Crisis. The total global fiscal and monetary stimulus this year amounts to about 28% of global GDP. M2 money supply has been growing fast, with much of it going primarily into investment assets -- stocks, bonds and real estate -- rather than goods and services, which has held down both inflation and the velocity of money. Furthermore, the Fed has cited low oil prices and weak overall demand restraining consumer price inflation.
However, the pandemic has hastened the onshoring of manufacturing and supply chains for which President Trump has been pushing hard for the past few years. And then of course, many commentators have lamented that globalization, monopolistic mega-caps suppressing wages and squeezing out competitors through low prices, unenforced antitrust laws, and the rapid adoption of productivity-enhancing technology all have been deflationary – but now each of these is suddenly under intense scrutiny. Such trends are expected to help the Fed’s efforts to stoke inflation.
Final thoughts:
No matter which party wins the November elections, I expect investors will once again look ahead to an economic recovery driven by continued Fed liquidity and massive federal deficit spending. I also expect elevated volatility, as typically the big institutional money lightens up in advance and then floods back in shortly after election day – although not necessarily into the same stocks. Winning industries and companies might vary. Of course, a Democrat sweep would be expected to reinstitute regulations and introduce sweeping policies related to taxation, climate change, social justice, healthcare, international trade, and wealth redistribution.
Either way, it appears that Modern Monetary Theory (MMT) has arrived, ironically under a Republican administration and Senate. As Eric Peters of One River Asset Management opined, “MMT proponents assumed the newly issued government bonds bought by the central bank would create the investment capital to transform America into a green economy, boost education, build affordable housing, expand healthcare, narrow inequality, and other noble causes. But there’s nothing to prevent MMT from being used for any purpose; tax cuts, kleptocracy, war.” It is truly a Pandora’s Box.
Nevertheless, looking ahead, the Fed has committed to remain dovish for the foreseeable future, which is negative for the dollar and long-term yields but positive for stocks. This will encourage more risk-taking and capital misallocation (like Nikola), leading to further multiple expansion and quite likely a post-COVID economic surge for 2021 (and beyond). Regarding a weak dollar, its fall will be tempered by other central banks intervening to prevent their local currencies from becoming too strong (which hurts exports) in what may become a global synchronized currency devaluation versus hard assets like gold, silver, and real estate – to essentially “inflate away” the debt by paying it back with ever-cheaper dollars. This is why I think this correction in gold and silver is a long-term buying opportunity.
I continue to believe that we are in the early stages of a new expansionary economic phase and bull market that could run for several years. It would be driven by an upswing in manufacturing activity, infrastructure spending, and new technologies like 5G cellular, the Internet of Things (IoT), e-commerce, cloud computing, AI/ML, autonomous technology, robotics, 3-D printing, clean energy, blockchain, quantum computing, nanotechnology, genomics, precision medicine, and even space travel. Moreover, my expectation is that as the economy continues its gradual reopening from its COVID shutdown, supported by an imminent vaccine and/or an effective treatment (or both), the stock market advance will broaden out to include value stocks, cyclical sectors, and smaller caps. And because passive flows into the broad market indexes primarily benefit the largest companies, investors will show renewed interest in strategic beta ETFs and old-fashioned active selection.
On that note, let me reiterate that Sabrient has leveraged its full suite of seven core quantitative models – GARP, Earnings Quality Rank (EQR), Growth Quality Rank (GQR), Defensive Equity, Insider Sentiment, Valuation, and Price Momentum – to create 11 new strategic-beta, passive indexes. You will be hearing more about these new indexes in the near future.
As a reminder, Sabrient’s enhancements to our Baker’s Dozen portfolio selection approach have helped our new portfolios strike a better balance between cyclical and secular growers as well as cap sizes. Thus, we expect our new process enhancements to boost all-weather performance by: 1) reducing relative volatility versus the benchmark, 2) improving the likelihood that our selected stocks will meet earnings estimates, and 3) creating a better balance between secular-growth and cyclical-growth companies and across large/mid/small cap sizes.
SPY Chart Review:
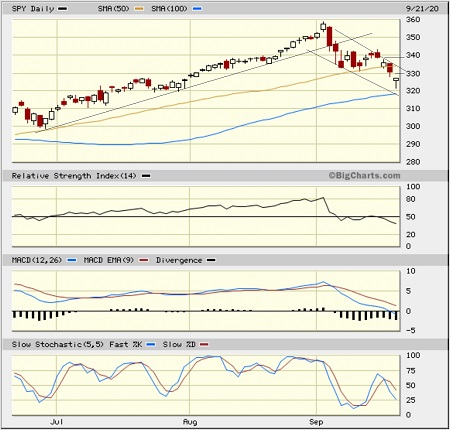
After a powerful, monotonic rise in August, the SPDR S&P 500 ETF (SPY) gave back all of August’s gains, sinking below 322 on Monday 9/21/20 before closing at 326.97. Monday’s low was about -10.3% below its all-time intraday high of 358.75 from 9/2/20. Yes, it’s been a tough month. SPY lost support from the uptrend line, the 20-day simple moving average (SMA) and the 50-day SMA. And then on Monday it successfully tested support at convergence of the minor support line of 320 and the 100-day SMA before bouncing strongly to form a bullish hammer pattern. The September pullback is looking like a bullish flag pattern as well, and oscillators RSI, MACD, and Slow Stochastic are all in oversold territory. So, let’s see if this was a capitulation day for the pullback and the start of new uptrend.
Latest Sector Rankings:
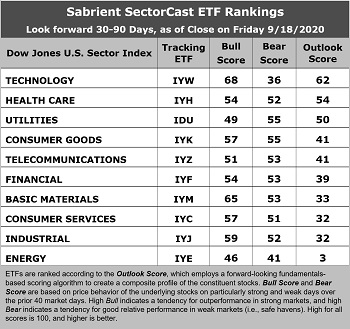
Relative sector rankings are based on our proprietary SectorCast model, which builds a composite profile of each of nearly 500 equity ETFs based on bottom-up aggregate scoring of the constituent stocks. The Outlook Score employs a forward-looking, fundamentals-based multifactor algorithm considering forward valuation, historical and projected earnings growth, the dynamics of Wall Street analysts’ consensus earnings estimates and recent revisions (up or down), quality and sustainability of reported earnings, and various return ratios. It helps us predict relative performance over the next 2-6 months.
In addition, SectorCast computes a Bull Score and Bear Score for each ETF based on recent price behavior of the constituent stocks on particularly strong and weak market days. A high Bull score indicates that stocks within the ETF recently have tended toward relative outperformance when the market is strong, while a high Bear score indicates that stocks within the ETF have tended to hold up relatively well (i.e., safe havens) when the market is weak.
Outlook score is forward-looking while Bull and Bear are backward-looking. As a group, these three scores can be helpful for positioning a portfolio for a given set of anticipated market conditions. Of course, each ETF holds a unique portfolio of stocks and position weights, so the sectors represented will score differently depending upon which set of ETFs is used. We use the iShares that represent the ten major U.S. business sectors: Financial (IYF), Technology (IYW), Industrial (IYJ), Healthcare (IYH), Consumer Goods (IYK), Consumer Services (IYC), Energy (IYE), Basic Materials (IYM), Telecommunications (IYZ), and Utilities (IDU). Whereas the Select Sector SPDRs only contain stocks from the S&P 500 large cap index, I prefer the iShares for their larger universe and broader diversity.
Here are some of my observations on this week’s scores:
1. The scores are notable bunched together, which speaks to the underlying uncertainty. Technology has taken the top spot with a relatively modest Outlook score of only 62. The sector displays good sell-side analyst sentiment (positive net revisions to EPS estimates), the best return ratios, and the best projected year-over-year EPS growth rate. Although it has a high (less attractive) forward P/E of 27.2x, it has the second lowest (more attractive) forward PEG (forward P/E divided by projected EPS growth rate) of 1.89. Healthcare takes the second spot with an Outlook score of 54. Rounding out the top five are defensive sectors Utilities, Consumer Goods (Staples/Noncyclical), and Telecom.
2. The bottom five sectors are all cyclicals: Energy with an Outlook score of 3, Industrial at 32, Consumer Services (Discretionary/Cyclicals) at 32, Basic Materials at 33, and Financial at 39, which generally reflects the uncertainty (and pulled guidance) for many companies in these cyclical sectors.
3. Looking at the Bull scores, Technology displays the top score of 68, followed by Basic Materials at 65, as stocks within these sectors have displayed relative strength on strong market days. Energy, somewhat surprisingly, scores the lowest at 46. The top-bottom spread of 22 points reflects low sector correlations on strong market days. It is desirable in a healthy market to see low correlations reflected in a top-bottom spread of at least 20 points, which indicates that investors have clear preferences in the market segments and stocks they want to hold (rather than broad risk-on behavior).
4. Looking at the Bear scores, defensive sectors Utilities and Consumer Goods (Staples/Noncyclical) share the top spot with a score of 55, as stocks within these sectors have been the preferred safe havens lately on weak market days. Energy displays the lowest score of 41, as investors have fled during recent market weakness. The top-bottom spread is only 14 points, which reflects high sector correlations on weak market days. Ideally, certain sectors will hold up relatively well while others are selling off (rather than broad risk-off behavior), so it is desirable in a healthy market to see low correlations reflected in a top-bottom spread of at least 20 points.
5. Technology displays the best all-around combination of Outlook/Bull/Bear scores, while Energy is by far the worst. Looking at just the Bull/Bear combination, Basic Materials is the best, followed by Consumer Goods (Staples/Noncyclical), indicating superior relative performance (on average) in extreme market conditions (whether bullish or bearish), while Energy again has been the worst.
6. This week’s fundamentals-based Outlook rankings have a moderately defensive bias, given that the bottom five are all cyclicals sectors while three the top five are dominated by defensive sectors. However, in this unprecedented climate, it is not surprising that the near-term outlook in our fundamentals-based model is muddled and the Outlook scores are tightly bunched. Equity investors seem to be positioning in anticipation of a better future, i.e., they are essentially predicting a bullish turn both in earnings projections and in our rankings over the next few months. Keep in mind, the Outlook Rank does not include timing, momentum, or relative strength factors, but rather reflects the consensus fundamental expectations at a given point in time for individual stocks, aggregated by sector.
ETF Trading Ideas:
Our Sector Rotation model, which appropriately weights Outlook, Bull, and Bear scores in accordance with the overall market’s prevailing trend (bullish, neutral, or defensive), moved to a neutral bias and suggests holding Technology (IYW), Healthcare (IYH), and Utilities (IDU), in that order. (Note: In this model, we consider the bias to be neutral from a rules-based trend-following standpoint when SPY is between its 50-day and 200-day simple moving averages.)
If you prefer a bullish bias, the Sector Rotation model suggests holding Technology, Basic Materials, and Industrial, in that order. On the other hand, if you are more comfortable with a defensive stance on the market, the model also suggests holding Utilities, Consumer Goods (Staples/Noncylicals), and Healthcare, in that order.
An assortment of other interesting ETFs that are scoring well in our latest rankings include SPDR S&P Homebuilders (XHB), Fidelity Stocks for Inflation (FCPI), VanEck Vectors Pharmaceutical (PPH), ETFMG Treatments Testing and Advancements (GERM), Direxion Work From Home (WFH), Invesco Dynamic Building & Construction (PKB), SPDR MFS Systematic Core Equity (SYE), Pacer US Small Cap Cash Cows 100 (CALF), VanEck Vectors Semiconductor (SMH), VictoryShares US Multi-Factor Minimum Volatility (VSMV), WBI BullBear Rising Income 3000 (WBIE), Cambria Value and Momentum (VAMO), First Trust Nasdaq Retail (FTXD), ProShares S&P Technology Dividend Aristocrats (TDV), Invesco S&P SmallCap Value with Momentum (XSVM), VanEck Vectors Junior Gold Miners (GDXJ), and Innovator IBD 50 (FFTY).
As always, I welcome your thoughts on this article! Please email me anytime. Any and all feedback is appreciated!
IMPORTANT NOTE: I post this information periodically as a free look inside some of our institutional research and as a source of some trading ideas for your own further investigation. It is not intended to be traded directly as a rules-based strategy in a real money portfolio. I am simply showing what a sector rotation model might suggest if a given portfolio was due for a rebalance, and I do not update the information on a regular schedule or on technical triggers. There are many ways for a client to trade such a strategy, including monthly or quarterly rebalancing, perhaps with interim adjustments to the bullish/neutral/defensive bias when warranted, but not necessarily on the days that I happen to post this article. The enhanced strategy seeks higher returns by employing individual stocks (or stock options) that are also highly ranked, but this introduces greater risks and volatility. I do not track performance of the ideas mentioned here as a managed portfolio.
Disclosure: At the time of this writing, among the securities mentioned, the author held long positions in SPY and AAPL.
Disclaimer: This newsletter is published solely for informational purposes and is not to be construed as advice or a recommendation to specific individuals. Individuals should take into account their personal financial circumstances in acting on any opinions, commentary, rankings, or stock selections provided by Sabrient Systems or its wholly owned subsidiary, Gradient Analytics. Sabrient makes no representations that the techniques used in its rankings or analysis will result in or guarantee profits in trading. Trading involves risk, including possible loss of principal and other losses, and past performance is no indication of future results.