Sector Detector: Stellar year for stocks now suggests strong follow-through in 2020
 by Scott Martindale
President & CEO, Sabrient Systems LLC
As yet another decade comes to a close, the US continues to enjoy the longest economic expansion on record. And as if to put a cherry on top, the economic reports last week hardly could have been more encouraging for the New Year, propelling the S&P 500 index into its third major technical breakout since the recovery from the financial crisis began well over 10 years ago. In particular, the jobs report blew away estimates with 266,000 new jobs, the prior month’s report was revised upward, and the unemployment rate fell to a 50-year low of 3.5%. Importantly, those new jobs included 54,000 manufacturing jobs. Indeed, a growing view is that the manufacturing/industrial segment of the economy has bottomed out along with the corporate earnings recession and capital investment, with an economic upswing in the cards, which has been a key driver for the resurgence in value and cyclical stocks with solid fundamentals.
The good news kept coming, with the Consumer Sentiment report jumping back up to 99.2 (and averaging 97.0 over the past three years, which is the highest sustained level since the Clinton administration’s all-time highs), while wages are up 3.1% year-over-year, and household income is up 4.8% (to the highest levels in 20 years). And with capital rotating out of pricey bonds into riskier assets, it all seems to me to be more indicative of a recovery or expansionary phase of the economic cycle – which could go on for a few more years, given a continuation of current monetary and fiscal policies and a continued de-escalation in trade wars.
To be sure, there have been plenty of major uncertainties hanging over the global economy, including a protracted trade war with China, an unresolved Brexit deal, an unsigned USMCA deal, and so on. And indeed, investors will want to see the December 15 trade deal deadline for new tariffs on China postponed. But suddenly, each of these seems to have a path to resolution, which gave a big boost to stocks today (Thursday). Moreover, a pervasive fear that we are in a “late-cycle” economy on the verge of recession was becoming more of a self-fulfilling prophesy than a fundamental reality, and now there is little doubt that investor sentiment is starting to ignore the fearmongers and move from risk-averse to risk-embracing, which better matches the fundamental outlook for the US economy and stocks, according to Sabrient’s model.
In this periodic update, I provide a detailed market commentary, offer my technical analysis of the S&P 500, review Sabrient’s latest fundamentals based SectorCast rankings of the ten US business sectors, and serve up some actionable ETF trading ideas. In summary, our sector rankings have turned bullish, while the longer-term technical picture remains bullish, and our sector rotation model also retains a solidly bullish posture.
By the way, you can find my latest slide deck and Baker’s Dozen commentary at http://bakersdozen.sabrient.com/bakers-dozen-marketing-materials, which provide details and graphics on two key developments:
- The bullish risk-on rotation since 8/27/19 is persisting, in which investors have shifted away from their previous defensive risk-off sentiment and back to a more optimistic risk-on preference that better aligns with the solid fundamental expectations of Wall Street analysts and Corporate America.
- We have developed and introduced a new Growth Quality Rank (GQR) as an enhancement to our growth-at-a-reasonable-price (aka GARP) model. It is intended to help provide better “all-weather” performance, even when investor sentiment seems “irrational.” Read on….
Market Commentary:
A new enhancement to Sabrient’s GARP model:
First, allow me to expand a bit on Sabrient’s new Growth Quality Rank (GQR). As you recall, we developed and introduced into our GARP model an Earnings Quality Rank (EQR) back in 2013, with expert assistance from the Gradient Analytics team of forensic accounting analysts, to help us focus on companies with less aggressive accounting practices relative to their industry peers. Similarly, GQR will help us to focus on those companies with more consistent and reliable earnings growth trends and are thus more likely to achieve their growth forecasts. We developed it in response to the anomalous market conditions and seemingly irrational price moves (as opposed to changing fundamentals) not only for the June 2018 thru August 2019 timeframe (when an historic valuation bubble formed in low-volatility/defensive/large-cap over value/cyclical/small-mid-cap) but in fact for much of the time since mid-2015 (when the last presidential election campaign kicked into gear, the Fed turned hawkish, and China fessed up to its growth challenges).
Our testing shows that the enhanced GARP-GQR model should reduce the volatility (and downside) in our portfolios when adverse and unexpected market conditions arise (like the recent 6/11/18—8/27/19 timeframe) without significantly reducing upside potential – which should be exciting for investors in any of our GARP portfolios, including the Baker’s Dozen. The chart below illustrates the potential improvement in “all-weather” performance.
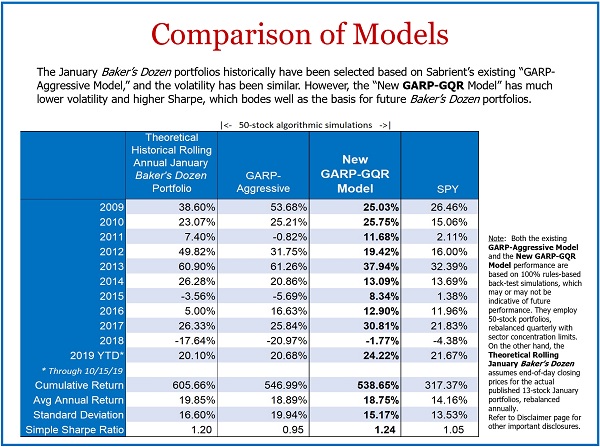
You can see the strong correlation between a theoretical rolling annual portfolio of our actual published January Baker’s Dozen model portfolios since inception in 2009 and the underlying “GARP-Aggressive” model as run in a 50-stock quant simulation with a quarterly rebalance. Although the new GARP-GQR model is also correlated during most years, the 50-stock quant simulation with quarterly rebalance is notably less volatile. While displaying a similar cumulative return (for the nearly 11-year test), it has a 15.17% standard deviation and a Sharpe Ratio of 1.24 versus 19.94% and 0.95 for the existing model.
And importantly, the down years are significantly ameliorated. Indeed, the horrid performance during 2018 for both the rolling Baker’s Dozen and the underlying GARP-Aggressive model is greatly improved in the new model (and it even beats the benchmark S&P 500). [Note: The gross hypothetical back-tested performance does not represent the results of actual trading and does not consider transaction costs or fees. Actual returns from live portfolios may differ materially from hypothetical returns.]
Investor sentiment continues to rotate risk-on:
As I have been discussing for months now, a stark market bifurcation commenced in June 2018 favoring secular growth, low-volatility and momentum factors, “bond proxy” defensive sectors, and large caps (i.e., late-stage economic cycle behavior) over cyclical growth, value and high-beta factors, cyclical sectors, and small-mid caps (i.e., expansionary cycle behavior). It persisted longer than the analyst consensus used in our GARP model suggested, with only fleeting glimpses of risk-on rotation whenever promising news about the trade war came out. Until 8/27/19, risk-off defensive sentiment was dominating, and it was worryingly looking a lot like deja vu from last year. As you recall, at about the same time last year, small caps peaked on 8/31/18 while the S&P 500 was able to march a bit higher before peaking on 9/20/18, but it was doing so on the backs of defensive sectors along with secular-growth Tech mega-caps, and I was opining at the time that the rally would fizzle if there wasn’t some rotation into the risk-on cyclicals and small-mid caps – which as you know didn’t happen, leading to the Q4 selloff.
But, happily, this year has played out quite differently. On 8/27/19, instead of peaking and selling off like last year, stocks put in a bottom and rallied hard for a few weeks, then pulled back to test bullish conviction, and then resumed the uptrend. Importantly, a risk-on sentiment has been driving the rally, and that historic divergence of low-volatility/defensive/large-cap over value/cyclical/small-mids continues to converge, as investors have become optimistic about at least a partial resolution to the trade war (including the lifting of tariffs before the 12/15 deadline), a dovish Fed, an improving outlook for 2020-21 corporate earnings, and resurgent capital investment.
Looking at 2019 performance, all major asset classes are up – as compared to all being down last year. So, asset correlation continues (which makes it harder on financial advisors to diversify). In rough numbers as of the end of last week, global equities were up over +22% YTD, commodities +15%, high-yield corporate bonds +12%, investment-grade corporate bonds +11%, government bonds +5%, and the US dollar +2%.
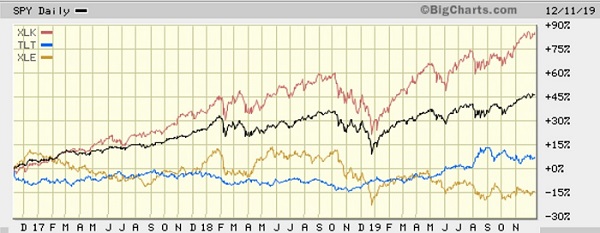
Interestingly, if we look back to the last presidential election in 2016 and compare the relative performance of the SPDR S&P 500 (SPY) versus the top-performing Technology Select Sector SPDR (XLK) and worst-performing Energy Select Sector SPDR (XLE), you can see that Energy jumped out of the gate immediately following the election (given Trump’s pro-domestic energy stance), but then quickly reversed and has struggled ever since. On the other hand, Technology overall has thrived, although it was mostly driven by the mega-cap juggernauts like Microsoft (MSFT) and Apple (AAPL) rather than a healthy breadth. In addition, I have plotted the iShares 20+ year Treasury ETF (TLT), which illustrates how correlated it has been with the SPY over the past two years.
Earnings, GDP, and interest rates:
As for corporate earnings, Q3 reporting proves that Corporate America actually has been quite resilient despite the trade wars. And looking ahead, according to FactSet, analyst consensus for the S&P 500 in 2020 is 5.5% revenue growth and 9.7% EPS growth (specifically, $162.81 EPS in 2019 growing to $178.57 in 2020), with the strongest growth coming from Energy, Industrial, Materials, Consumer Discretionary and Communication Services sectors. At Thursday’s closing level of 3,168 for the S&P 500, that computes a 17.7x P/E multiple and a 5.6% earnings yield (plus a dividend yield of 1.75%), which seems quite reasonable compared with a 10-year Treasury yield around 1.8%. According to DataTrek, for the S&P 500 to achieve that forecasted growth, over 50% of the index by market cap (comprising Technology, Comm Services, Consumer Discretionary, and Industrial sectors) must see the 0% average EPS growth in 2019 rise to 13% growth – which pretty clearly depends upon some resolution (at least a Phase 1) to the trade war.
As for US GDP, following growth in Q1 of +3.1% and Q2 of +2.0%, the BEA’s second estimate for Q3 2019 is 2.1%. Looking ahead to Q4 estimates, the Atlanta Fed’s GDPNow model predicts +2.0% GDP growth (as of 12/6) and the NY Fed’s NowCast sees +0.6% (as of 12/6), while the St. Louis Fed NowCast sees a more optimistic +1.9% (as of 12/6).
The 30-year Treasury yield closed Thursday at 2.31%, while the 10-year T-note closed at 1.90%, the 2-year T-note 1.66%, and the 3-month T-bill 1.56%. So, the 3-month/10-year spread is at +34 bps, while the more closely followed 2-10 spread is at +24 bps, as the Fed has restored confidence among fixed income investors by committing to purchase Treasury bills and shore up the repo market, thus pushing down short-term rates. Its efforts have also restored confidence among equity investors, enticing capital rotation out of longer term bonds and into equities, helping to “un-invert” the yield curve, which (as I have frequently opined) was artificially inverted due to defensive global investor sentiment and low rates overseas rather than for fundamental reasons (like an over-heated economy or rising inflation). The US continues to pay much more lucrative yields compared with other developed markets, and in fact, Germany, France, and Japan continue to offer negative rates across most of the yield curve (i.e., you have to pay them for the honor of holding their bonds).
In the FOMC announcement on Wednesday, it was made clear that there is now unusual consensus among the governors to keep the benchmark rate stable in the current 1.50-1.75% range for the foreseeable future. Nevertheless, CME Group fed funds futures are showing 24% probability of another 25-bp rate cut by June, rising to 50% by December 2020, and zero chance of a rate hike next year.
Looking ahead:
We may well see a correction next year to test bullish conviction at these new highs, but there is no recession in sight, especially when you also consider that Q3 earnings turned out much better than expected even though businesses have been holding back on capital spending until they have greater visibility vis-à-vis the trade war. One can only imagine the kind of boost we might see from resurgent capital investment. Tailwinds for 2020 include ongoing monetary stimulus (low interest rates and easy access to credit), ongoing fiscal stimulus (low tax rates and deregulation), record low unemployment, low inflation, lofty consumer confidence, improving business confidence, and fatigue setting in among the combatants in the trade wars. Moreover, real interest rates in the US are negative (which is historically bullish) and both the ECB and Federal Reserve are cutting rates at the same time, helping to steepen the yield curve. In addition, there is plenty of idle cash still on the sidelines, and although investor confidence is growing more optimistic, most investors are still far from “exuberant.” Instead of a recession, I think we are likely to see a continued rotation out of wildly popular growth/momentum stocks of recent years and into the vast sea of overlooked names (especially many in the small and mid capitalizations) that still sport attractive valuations.
Could 2020 end up like 2018? Recall that 2017 was strong in anticipation of President Trump’s tax bill, which finally came in December, and 2018 turned into a disappointing “show me” year in which business had to prove to investors that they actually would use their tax savings (within an improved business climate) for capital investment in future growth. So, a similar set up may be in store in that 2019 has been strong in anticipation of a trade deal with China, and 2020 could be another “show me” kind of year for capital investment and growth. However, I think 2018 was inordinately impacted by Trump’s tariffs and decision to confront China’s long history of unfair/illegal trade practices, so 2020 might see the exact opposite reaction given an improving global trade environment. Interestingly, JP Morgan’s strategy team is now predicting 2020 could be the year of the “great rotation,” suggesting next year could be another strong year for equities driven this time by retail investors rotating capital from bond funds into equity funds (similar to 2013).
I have often opined about our government’s sole reliance from 2009 through 2017 on Fed monetary policy (rather than fiscal stimulus) to prop up the economy doing little more than create asset inflation (and a “wealth effect”), pushing stocks, bonds, and real estate to new highs in correlated fashion. The problem was that it only benefited those who already owned assets – and the more you owned the better you did. This of course led to an ever-widening wealth gap and ultimately to a populist movement and extreme societal divisiveness. And although passage of the 2017 tax bill promised to close the gap as Corporate America invested its tax savings within a more favorable business/regulatory climate to everyone’s benefit, instead the trade wars have led businesses to largely postpone capital investment plans until the clouds are lifted. Thus, with income inequality still a huge political issue today, our country now faces two disparate paths: 1) a turn toward socialism, with profligate new entitlement programs and forced wealth redistribution through onerous taxation and asset confiscation, or 2) embracing capitalism and enhanced fiscal stimulus, including middle class tax cuts, further regulatory reform, skills training programs, immigration reform that allows greater numbers of skilled workers, and massive infrastructure programs (including public/private partnerships). When it comes time to vote, I am hopeful that the American electorate makes the wise and thoughtful – rather than emotional – choice.
SPY Chart Review:
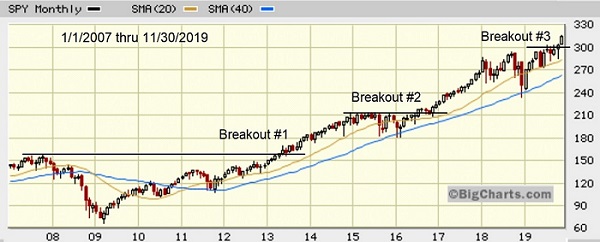
The SPDR S&P 500 ETF (SPY) closed Thursday above 317 and has made yet another clean breakout to new all-time highs with leadership from risk-on market segments, as I have been predicting it would. As shown in the monthly chart below, if we look at the post-financial crisis recovery, November brought about the third major upside breakout to new all-time highs, which bodes well for a continuation of the rally well into 2020 (and beyond, depending upon the election outcome), in my view.
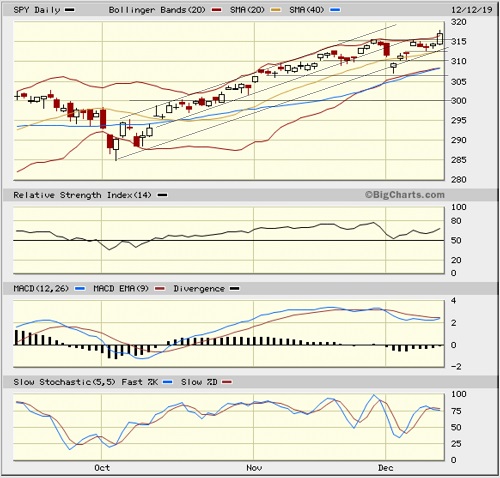
Looking at the SPY chart over the past few months for shorter-term signals, we can see that after a brief consolidation at new highs, bulls are trying to resume the surge. Oscillators RSI, MACD, and Slow Stochastics have all turned upwards. Most of the minor bullish gaps have now been filled, and minor support levels (including uptrend lines) as shown on the chart have been successfully tested, as has the 20-day simple moving average. Bollinger Bands are pinching closer together, indicating an imminent break one direction or the other (likely up). I continue to see the technical outlook as strong, and a signed Phase 1 deal with China could be that next bullish catalyst.
Latest Sector Rankings:
Relative sector rankings are based on our proprietary SectorCast model, which builds a composite profile of each of nearly 500 equity ETFs based on bottom-up aggregate scoring of the constituent stocks. The Outlook Score employs a forward-looking, fundamentals-based multifactor algorithm considering forward valuation, historical and projected earnings growth, the dynamics of Wall Street analysts’ consensus earnings estimates and recent revisions (up or down), quality and sustainability of reported earnings, and various return ratios. It helps us predict relative performance over the next 2-6 months.
In addition, SectorCast computes a Bull Score and Bear Score for each ETF based on recent price behavior of the constituent stocks on particularly strong and weak market days. A high Bull score indicates that stocks within the ETF recently have tended toward relative outperformance when the market is strong, while a high Bear score indicates that stocks within the ETF have tended to hold up relatively well (i.e., safe havens) when the market is weak.
Outlook score is forward-looking while Bull and Bear are backward-looking. As a group, these three scores can be helpful for positioning a portfolio for a given set of anticipated market conditions. Of course, each ETF holds a unique portfolio of stocks and position weights, so the sectors represented will score differently depending upon which set of ETFs is used. We use the iShares that represent the ten major U.S. business sectors: Financial (IYF), Technology (IYW), Industrial (IYJ), Healthcare (IYH), Consumer Goods (IYK), Consumer Services (IYC), Energy (IYE), Basic Materials (IYM), Telecommunications (IYZ), and Utilities (IDU). Whereas the Select Sector SPDRs only contain stocks from the S&P 500 large cap index, I prefer the iShares for their larger universe and broader diversity.
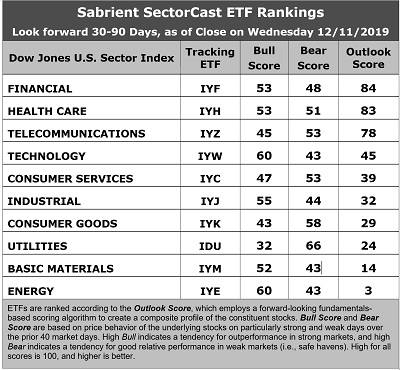
Here are some of my observations on this week’s scores:
1. There are some notable shifts in the rankings this month. Financial has moved into the top spot with an Outlook score of 84, with solid scores across the board, including an attractive forward P/E (16.4x) and improving sell-side analyst sentiment (net positive revisions to EPS estimates). IYF also displays a solid projected year-over-year aggregate EPS growth rate of 9.3%, an attractive forward PEG ratio (forward P/E divided by projected EPS growth rate) of 1.76, good return ratios, and the best insider sentiment (open market insider buying). Taking second is Healthcare with a score of 83, as it similarly displays reasonably good factor scores across the board, including the best sell-side analyst sentiment, a low P/E (16.8x), and an attractive forward PEG ratio of 1.60. Rounding out the top six are Telecom, Technology, Consumer Services (Discretionary/Cyclical), and Industrial. Notably, Technology displays the highest projected growth rate (13.7x) and most attractive forward PEG ratio (1.58), but also the highest forward P/E (21.6x).
2. At the bottom of the rankings we find the two most highly cyclical sectors: Basic Materials and Energy, primarily because these sectors continue to see significant net reductions to their earnings estimates from the sell-side analyst community – but that might change if a Phase 1 trade deal is signed.
3. Looking at the Bull scores, Technology and Energy share the top score of 60, followed by Industrial at 55, as stocks within these sectors have displayed relative strength on strong market days. Defensive sector Utilities scores the lowest at 32. The top-bottom spread is a healthy 28 points, which reflects low sector correlations on strong market days. It is desirable in a healthy market to see low correlations reflected in a top-bottom spread of at least 20 points, which indicates that investors have clear preferences in the market segments and stocks they want to hold (rather than broad risk-on behavior).
4. Looking at the Bear scores, as usual we find defensive sector Utilities alone in the top spot with a score of 66, followed by Consumer Goods at 58, which means that stocks within these sectors have been the preferred safe havens lately on weak market days. Energy, Materials, and Technology share the lowest score of 43, followed closely by Industrial at 44, as investors have fled during recent market weakness. The top-bottom spread is 23 points, which reflects low sector correlations on weak market days. Ideally, certain sectors will hold up relatively well while others are selling off (rather than broad risk-off behavior), so it is desirable in a healthy market to see low correlations reflected in a top-bottom spread of at least 20 points.
5. Healthcare displays the best all-around combination of Outlook/Bull/Bear scores, followed by Financial, while Energy is the worst. Looking at just the Bull/Bear combination, Healthcare is the best, indicating superior relative performance (on average) in extreme market conditions (whether bullish or bearish), while Materials is the worst.
6. I would say this week’s fundamentals-based Outlook rankings now reflect a bullish bias, given that the top six names are all economically sensitive or all-weather, and Consumer Services and Industrial have leapfrogged Consumer Goods and Utilities. If Energy and Materials can get some analyst upgrades (such as in the aftermath of a trade deal), the rankings might start to look extremely bullish. It seems to me that the sell-side analyst community is still grappling with visibility in capital spending programs and earnings growth, but investors have already called a bottom and aren’t waiting around for those upward revisions. Keep in mind, the Outlook Rank does not include timing, momentum, or relative strength factors, but rather reflects the consensus fundamental expectations at a given point in time for individual stocks, aggregated by sector.
ETF Trading Ideas:
Our Sector Rotation model, which appropriately weights Outlook, Bull, and Bear scores in accordance with the overall market’s prevailing trend (bullish, neutral, or defensive), retains a bullish bias and suggests holding Financial (IYF), Healthcare (IYH), and Technology (IYW), in that order. (Note: In this model, we consider the bias to be bullish from a rules-based trend-following standpoint when SPY is above both its 50-day and 200-day simple moving averages.)
Besides iShares’ IYF, IYH, and IYW, other highly-ranked ETFs in our SectorCast model (which scores nearly 800 US-listed equity ETFs) from the Financial, Healthcare, and Technology sectors include SPDR S&P Capital Markets (KCE), First Trust NASDAQ Pharmaceuticals (FTXH), and First Trust NASDAQ 100 Technology Sector (QTEC).
If you prefer a neutral bias, the Sector Rotation model suggests holding Financial, Healthcare, and Telecom, in that order. On the other hand, if you are more comfortable with a defensive stance on the market, the model suggests holding Utilities, Telecom, and Healthcare, in that order.
An assortment of other interesting ETFs that are scoring well in our latest rankings include Invesco Dynamic Pharmaceuticals (PJP), Arrow QVM Equity Factor (QVM), First Trust Dorsey Wright Momentum & Value (DVLU), Aptus Fortified Value (FTVA), Invesco S&P SmallCap Value with Momentum (XSVM), SPDR S&P Retail (XRT), Davis Select Financial (DFNL), Invesco Financial Preferred (PGF), SPDR S&P Bank (KBE), Invesco Buyback Achievers (PKW), iShares Evolved US Innovative Healthcare (IEIH), First Trust Financials AlphaDEX (FXO), Cambria Shareholder Yield (SYLD), Pacer US Small Cap Cash Cows 100 (CALF), Invesco Dynamic Biotech & Genome (PBE), VanEck Vectors Morningstar Wide Moat (MOAT), and Direxion All Cap Insider Sentiment (KNOW, which tracks a Sabrient index).
Please email me your thoughts on my articles! Do you read these monthly tomes all the way through, or do you focus only on particular sections? Do you use the information to gather talking points with your investors? Any and all feedback is appreciated!
IMPORTANT NOTE: I post this information periodically as a free look inside some of our institutional research and as a source of some trading ideas for your own further investigation. It is not intended to be traded directly as a rules-based strategy in a real money portfolio. I am simply showing what a sector rotation model might suggest if a given portfolio was due for a rebalance, and I do not update the information on a regular schedule or on technical triggers. There are many ways for a client to trade such a strategy, including monthly or quarterly rebalancing, perhaps with interim adjustments to the bullish/neutral/defensive bias when warranted, but not necessarily on the days that I happen to post this article. The enhanced strategy seeks higher returns by employing individual stocks (or stock options) that are also highly ranked, but this introduces greater risks and volatility. I do not track performance of the ideas mentioned here as a managed portfolio.
Disclosure: At the time of this writing, the author held long positions on the SPY and IWM.
Disclaimer: This newsletter is published solely for informational purposes and is not to be construed as advice or a recommendation to specific individuals. Individuals should take into account their personal financial circumstances in acting on any opinions, commentary, rankings, or stock selections provided by Sabrient Systems or its wholly owned subsidiary Gradient Analytics. Sabrient makes no representations that the techniques used in its rankings or analysis will result in or guarantee profits in trading. Trading involves risk, including possible loss of principal and other losses, and past performance is no indication of future results.