Sector Detector: COVID-19 flattening and new stimulus lead to stock market surge – New bull market?
 by Scott Martindale
President & CEO, Sabrient Systems LLC
As COVID-19 quickly moved from outbreak to epidemic to full-fledged pandemic in a matter of weeks, hospitalizations and deaths gained momentum, as did the panic selling of risk assets. It demonstrates how interconnected the world has become. The pandemic has become a generational crisis – and the very definition of the proverbial Black Swan event – bringing the global economy to its knees, at least temporarily. As a result, Q1 closed with a rare and dreaded trifecta of three down months, which historically does not lead to a quick recovery (albeit with a small sample size). It was the worst Q1 performance since 1987 and the fastest fall from record highs in history.
From its intraday all-time high on 2/19/20 to the intraday low on 3/23/20 (i.e., a little over one month), the S&P 500 fell an incredible -35.3%, wiping out the entire “Trump Bump” and about $10 trillion in US market cap in almost the blink of an eye. Moreover, asset classes were highly correlated in a mass liquidation, leaving no place to hide other than US Treasuries or cash (thus strengthening the US dollar). Even gold and cryptocurrencies largely failed to serve as the safe havens from financial distress they are intended to be, at least initially, as traders liquidated everything into cold hard cash. Indeed, money market funds surged above $4 trillion for the first time ever. Never truer was the old saying, “Stocks take the stairs up and the elevator down” – or perhaps more fittingly in this case, stocks had rock-climbed up the cliff and swan-dived back down.
But the news has gotten better, as social distancing seems to be doing its job to “flatten the curve” of new hospitalizations, while the Federal Reserve and Congress have flooded the economy with unprecedented levels of fiscal and monetary support, stimulus, and liquidity. As a result, the S&P 500 has retraced over half of the selloff, and just posted its best week in 46 years (+12.1% in a shortened holiday week, at that). Now, the big question on everyone’s mind is, “What’s next?” Some see this as the end to a very brief bear market and the start of a brand new bull market, while others see it as just a bear market bounce and an opportunity to sell into strength before the next downswing. Some prominent names even think we are the verge of the next Great Depression. But from my standpoint, as we enter Passover and Easter weekend, I am optimistic that mass liquidation of financial assets is likely behind us, the economy will reopen sooner than previously expected, and that we have seen the market lows (although there may be some backfilling of technical gaps and retesting of support levels).
Perhaps a resumption of last fall’s fledgling broad-based rally (8/27/19 – 12/20/19) will persist much longer this time and favor the cyclical market segments (as many prominent names on Wall Street expect) and valuation-oriented strategies like Sabrient’s Baker’s Dozen – particularly given our newly-enhanced approach designed to improve all-weather performance and reduce relative volatility versus the benchmark S&P 500 (which has been tough to beat over the past couple of years given the narrow leadership of secular-growth mega-cap Tech and persistently defensive investor sentiment).
In this periodic update, I provide a market commentary, discuss Sabrient’s new process enhancements, offer my technical analysis of the S&P 500, and review Sabrient’s latest fundamentals-based SectorCast rankings of the ten US business sectors, and serve up some actionable ETF trading ideas. Notably, Healthcare is suddenly the hero during this COVID-19 scare instead of the avoided sector from all the “Medicare for All” talk. (Perhaps that is behind us now that Bernie Sanders has suspended his presidential campaign.) In summary, our sector rankings remain neutral, and our sector rotation model moved to a defensive posture last month. The technical picture shows a market that has likely bottomed and begun to recover, although with elevated volatility likely to persist and strong directional signals that are suddenly invalidated and reversed by the latest news report on COVID-19 or government stimulus.
As a reminder, you can find my latest Baker’s Dozen slide deck and commentary on terminating portfolios at http://bakersdozen.sabrient.com/bakers-dozen-marketing-materials. Click to read on...
Market commentary:
Stay-at-home orders have led to work-from-home (WFH) decisions for office workers across the country, including us at Sabrient and Gradient. Although we were able to make the transition fairly smoothly here in Phoenix, I can only imagine the disruption for traders and the like who have long kept the sanctuary of their homes strictly separated from their work, but now have had no choice but to bring the work home. It’s definitely a better fate than becoming unemployed like so many of our fellow citizens.
I sure was wrong in my article from early March when I suggested that the panic selling in stocks was likely over after the initial selloff that closed out the month of February. Instead, as it became evident that the virus would be much more than just a “bad flu,” widespread shutdowns of much of the economy soon followed and a sharp correction in stocks quickly became a scary waterfall decline.
Although the historic market selloff was triggered by the pandemic, it was exacerbated by a few other factors, including extremely overbought technical conditions and lofty valuations, the oil price collapse, and the predominance of algorithmic traders (who now control the bulk of daily trading volume and are only too happy to exaggerate market moves). Indeed, stock valuations had become quite elevated well before the pandemic hit (some might say “priced for perfection”), with the S&P 500 reaching a forward P/E of 19x and market internals were showing signs of worry. But the forward P/E quickly fell to 13x before many adjustments to forward earnings estimates had been made. As of 4/8/20, the forward P/E was about 17x, taking into account many downward earnings revisions, although it likely may rise further as the analyst community continues to cut forward estimates.
I think it is interesting that no matter what anyone’s previous forecast for the economy and stocks might have been, this catastrophic disruption has thrown them all out the window such that anyone now can say, “Well, my forecast was destined to play out if not for the coronavirus.”
The panic selling led to a massive rotation of capital from stocks into the traditional safe haven of US Treasuries, driving down the 10-year yield below 1.0% for the first time ever, ultimately falling to an unheard-of 0.398% on 3/9/20. Although the 10-year quickly recovered back above 1.0% to as high as 1.266% on 3/18/20, it was largely due to margin calls triggering mass selling across all asset classes, including Treasuries. But as of this writing, the 10-year yield is back below 1.0% again, closing the trading week on 4/9/20 at 0.729%.
During the selloff, the CBOE Volatility Index (VIX) hit an all-time closing high of 82.60 on 3/16/20 (previous high was 80.86 on 11/20/08) and the all-time second-highest intraday high of 85.47 on 3/18/20 (highest was 89.53 on 10/24/08). Rarely does the VIX hit 50. In fact, over the past 30 years, outside of the 2008-9 financial crisis, there have been only two days in which an intraday reading on the VIX was higher than 50 … until the past four weeks. It closed the trading week on 4/9/20 at 41.67.
Government to the rescue:
In my view, the recession we have suddenly entered likely will be just a transitory shock, as opposed to the 2008 financial crisis, which was caused by structural imbalances leading some banks to collapse and overleveraged consumers and real estate investors to face mass foreclosures. Instead, this recession was caused by an outside event in the midst of a strong economy with solid fundamentals and no imminent systemic risks, with much lower consumer debt burden than in 2008, strong employment, well-capitalized banks, and generally strong corporate balance sheets. Nevertheless, the risk of a corporate credit event (i.e., mass defaults and bankruptcies) was increasing – until the government started rolling out unprecedented programs to backstop large corporations, small businesses, state and local governments, and consumers across the board. But as a result, one has to wonder whether the economy, and in fact American capitalism, will ever be the same.
First, the Federal Reserve announced aggressive monetary policy action that put Financial Crisis-era policies to shame, including slashing the fed funds rate to zero (ZIRP), pumping trillions of dollars of liquidity into the banking system by buying up Treasuries and mortgage-backed securities across the yield curve (QE), and launching a massive commercial paper funding facility to support short-term corporate debt markets. This included an unlimited asset purchase program to both keep interest rates down and to ensure the US Treasury has a buyer for its bond issuances that fund the budget.
Then this morning, 4/9/20, another massive package was announced for loans to households, small businesses, and municipalities. (This announcement came concurrently with yet another startling weekly report showing massive numbers of initial jobless claims – which now might put total unemployment at nearly 14%.) As chairman Jay Powell said, the Fed will act “forcefully, proactively, and aggressively” to do “all we can,” but emphasized that these are loans and not grants or “spending.” But there is no doubt that the Fed’s role has radically expanded from its original dual mandate of managing inflation and unemployment.
In addition, Congress made haste in passing by far the largest emergency relief bill in US history (CARES Act), initially allocating $2.2 trillion (and likely much more to come) in new spending, which is about 10% of GDP, putting millions of workers and thousands of businesses on the government dole. And similar actions have been taken overseas.
Corporate insiders have taken notice of the “whatever it takes” mindset of government to shore up the economy, as insider buying has hit historic levels. And Fed Funds Futures predict that the Fed will not start raising rates again until 2022. Low interest rates support higher multiples on stock valuations.
Although credit spreads initially spiked, in general they never reached 2008 levels nor the point of an imminent financial crisis. And more recently, both investment grade spreads and high yield spreads have tightened in reaction to Fed monetary intervention and the emergency relief package (fiscal stimulus). Investment-grade spreads peaked at about 4 pps above Treasuries on 3/23/20 (versus 6 pps in 2008), while high-yield spreads hit nearly 11 pps on 3/23/20 (versus about 20 pps in 2008) – and both have been pulling back ever since. This further supports higher equity valuations.
Although bankruptcy risk has fallen dramatically, falling corporate sales and earnings can’t be fixed until the economy is back in action, and it’s hard to gauge the impact it ultimately will have. Some, like hedge fund gurus Raoul Pal and Ray Dalio, have predicted total breakdown of the economy and a depression. But most other prominent names are more sanguine, with general consensus of a second half economic recovery. Stocks are forward-looking and typically strengthen 3-6 months before a recovery becomes evident, so the market’s positive reaction to encouraging news on both the coronavirus front and the massive government intervention suggests that investors are positioning for an H2 corporate earnings turnaround.
But for the moment, there remains great uncertainty. Even normal technical analysis doesn’t seem to be very helpful. Instead, market gyrations have seemed to be directed more by the news of the moment than by traditional overbought/oversold indicators. Think it’s severely oversold (or overbought) with only one direction to go tomorrow? Well guess what, it can go a lot lower (or higher), blowing out whatever short-term trade you put on. Those who have been fading this latest rally as merely a bear-market bounce know what I’m talking about.
Narrow market leadership makes S&P 500 tough to beat:
Let’s take a closer look at relative performance since 6/11/18 (almost two years ago), which is when I observed that investor sentiment had turned defensive in reaction to escalation in the China trade war, even though the S&P 500 continued to rise by rotating internally into secular-growth mega-cap Technology and “bond proxy” dividend-paying defensive sectors. The cap-weighted S&P 500 (SPY), which is dominated by a handful of mega-cap Tech juggernauts, is roughly flat (0.0% price return), which handily beats most of its broad-market equal-weighted brethren, including the S&P 500 Equal-Weight (RSP), -12%, Russell 1000 Equal-Weight (EQAL), -18%, S&P 400 Mid-Cap Equal-Weight (EWMC), -29%, and S&P 600 Small Cap Equal-weight (EWSC), -36%, through 4/9/20. And even during the waterfall selloff since the market peak on 2/19/20, the outperformance continued. The one exception is the NASDAQ 100 Equal Weight (QQEW), which at +8% outperformed SPY over the period. But QQEW is 40% (!) Tech sector, while SPY is 25% Tech.
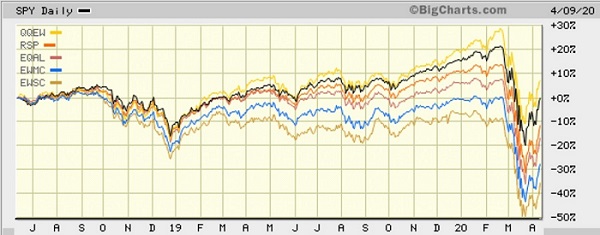
This illustrates how difficult it has been for any cap-diversified equal-weight portfolio, or in fact most active strategies, to keep up with the narrow leadership of the S&P 500. In fact, S&P Dow Jones Indices (SPDJI) reported for 2019 that 71% of active large-cap equity funds under-performed the S&P 500 Index for the 10th consecutive one-year period, while 97% of US large-cap value funds trailed the S&P 500 Value Index. Moreover, SPDJI reported that the value factor and small-mid caps have lagged the growth and momentum factors and large caps throughout. Thus, the historically large performance divergence of large caps and low-volatility/defensives over small caps and value/cyclicals keeps widening, despite the almost 4 months of convergence from 8/27/19 through year-end 2019.
Sabrient introduces process enhancements:
Over the past few years, Sabrient’s long-standing model has favored cyclicals (e.g., Materials, Energy, Industrials, and Financial sectors, plus industries like homebuilding, semiconductors, transports), which tend to display strong earnings growth in a growing economy, as well as small and mid-caps, as secular-growth Technology companies and large caps in general were largely “bid up” to high valuations. Such tilts represent areas in which an investor historically would want to be positioned in a growing economy – and especially today for a convergence of the relative-valuation bubble. But it appears that perhaps a “new normal” has set in.
After 6-1/2 years (2009-1H2015) in which the Baker’s Dozen portfolios consistently outperformed, temporary periods would arise in which investor sentiment became misaligned with the consensus fundamental outlook of the sell-side analyst community; it was just normal market behavior. So, we chose to stay true to our disciplined investment process and ride out those fleeting periods of misalignment. However, in retrospect, mid-2015 marked the beginning of a “new normal” of persistent (and often painful) periods of irrational/unwarranted defensive sentiment, and especially during the 14 months (6/11/18-8/27/19) of escalating trade war with China.
Thus, it became evident to us that the market can no longer be trusted to quickly revert to “rational” behavior, i.e., alignment among investor sentiment, corporate capital spending, and sell-side analyst consensus outlook on fundamentals and earnings. Instead, investors have become capable of displaying persistently irrational behavior unlike anything we had seen or tested on our quantitative model in the past (i.e., ever since the Internet Bubble burst in 2000).
So, Sabrient has implemented two enhancements to its longstanding “Growth at a Reasonable Price” (GARP) portfolio selection approach that seek to address the “new normal” of investor penchant for defensive sectors and secular growth. The enhancements aim to preserve the market-beating potential investors expect from Sabrient while improving all-weather performance and reducing relative volatility versus the benchmark. The enhancements include new limits on extreme sector “tilts” versus the benchmark’s allocations, as well as the addition of a new proprietary Growth Quality Rank as an alpha factor in the quant model. GQR measures the consistency and reliability of a company’s earnings and thus its likelihood of meeting estimates, therefore allowing for more in the way of secular growth companies. And as a reminder, our selection process includes both our proprietary Earnings Quality Rank (EQR) – developed with wholly-owned subsidiary Gradient Analytics – as an alpha factor in the GARP model as well as a manual review of each position by a member of the Gradient analyst team.
Final thoughts:
All predictions of a strong earnings resurgence this year have been thrown out the window. The reality is that no one – not corporate leaders, Wall Street analysts, TV commentators, or politicians – can do much but guess as to how soon the economy will reopen, how much irreversible damage to the economy will have been done, how GDP and corporate earnings will be impacted, how long it will take to recover, and how much government stimulus/welfare largesse will help or hurt in the long term.
Once upon a time, Fed monetary stimulus was all about cutting interest rates on the short end of the curve and/or buying bonds on the longer end to keep borrowing rates low to stimulate aggregate demand during recessions, while Congress would offer fiscal stimulus in the form of tax cuts, deregulation, and entitlements to provide financial stability. But today, the combined monetary and fiscal policies are used to backstop businesses and consumers from bankruptcy, prop up zombie companies, ensure liquidity in all capital markets, disburse “helicopter money” to keep consumers spending, and serve as the buyer of last resort (and perhaps the only interested buyer) of US government bonds to underwrite a rapidly expanding budget deficit.
There is little doubt to me that the country continues to move further from capitalism toward socialism in a well-intentioned effort to ease our collective pain, with the Federal Reserve backstopping households and enterprises big and small, no matter how unprepared they may have been to weather even a brief turn of fortune. As a result, the federal government will be hard-pressed to ever again say, “Sorry, but there is no money in the budget to support your issue” – whether homelessness, healthcare, college tuition, pension liabilities, or potholes in our streets. Yes, Modern Monetary Theory (MMT) has arrived to fix all ills, and it didn’t even require the Far Left progressives to take over Congress and the White House. But everyone seems to agree that there was little choice in the matter.
And although corporate leaders will plead innocence in their companies’ financial stability plight, asserting that it was impossible to foresee such a Black Swan event, the reality is that companies, just like households, should be prepared to weather at least six months without income by holding cash reserves and low debt burdens – rather than just “maximizing shareholder value” at all cost, including deploying cash and debt for share buybacks. But of course, there are other stakeholders to consider. In a pure capitalist system, such unpreparedness would result in bankruptcy and layoffs. But when it’s this pervasive, government feels it must prevent the huge negative impact on individuals (e.g., mass unemployment and prolonged depression). And so the companies are bailed out. But going forward, companies may well find themselves facing greater regulation and higher taxes, with associated reductions in productivity, margins, and profitability.
I suggested in my article early last month that COVID-19 fears would pass “within a matter of a few months, if not several weeks,” and there are early signs that this may actually come to pass. Certainly, a reopening of the economy cannot come soon enough, and with the latest encouraging signs (e.g., hospitalizations flattening, death projections reduced), we might be going back to some semblance of normalcy sooner than expected. Notably, Michael Burry of “The Big Short” fame (and an M.D. by schooling) has lamented that all the recent gains made by the working class are being wiped out in a way that helicopter money can’t fix, and he urged on Twitter, “Prudent plan: 1) Standardize on chloroquine and azithromycin – cheap and available; 2) Sick and elderly voluntarily shelter in place; 3) Americans lead their normal lives with extra hand washing and special care if around elderly. Saving the economy means life, not murder.” He is among the large camp who believe that the cure can’t be worse than the problem. But at least for the moment, medical community leaders and the press have convinced the President to stick with the shutdown.
No matter how much longer it lasts, I expect that this crisis likely will intensify protectionist sentiments to diversify supply chains or preferably bring them back home, which would be expected to increase prices and inflation. It is also likely to empower/enrich the largest corporations by knocking off their smaller competitors and upstarts who don’t have the resources to weather the storm.
Michael Wilson of Morgan Stanley just wrote in a client note, “With the forced liquidation of assets in the past month largely behind us, unprecedented and unbridled monetary and fiscal intervention led by the U.S. and the most attractive valuation we have seen since 2011, we stick to our recent view that the worst is behind us for this cyclical bear market that began two years ago, not last month.” Furthermore, he expects to see “leadership change” among assets, with the 35-year bull market in bonds coming to an end in favor of equities that thrive in the recovery and expansionary phases of the economic cycle – namely cyclical sectors and high-quality secular growth names that are suddenly selling at fire-sale prices. Notably, the recent plunge in stock prices boosted buying among corporate insiders, according to Washington Service, a leading provider of insider trading data.
Similarly, I have been talking about the marked change in market character and defensive rotation since mid-2018 when the China trade war escalated, with consecutive quarters of earnings recession, supported only by massive global liquidity searching for higher returns and mostly targeting secular-growth mega-cap Technology names and “bond proxy” reliable dividend-paying stocks. And despite the COVID-19 economic shutdown, I still think we are in the early stages of a new expansionary cycle that could run for several years, driven by an upswing in manufacturing activity, infrastructure spending, and new technologies like 5G, the Internet of Things (IoT), AI/ML, robotics, clean energy, oil fracking, blockchain, space travel, quantum computing, nanotechnology, genomics, and precision medicine. In fact, the C-virus may have finally allowed for the GDP recession and bear market in stocks that monetary and fiscal policies have been trying so hard to prevent from happening, so that we can soon move on with a new expansionary phase and bull market.
According to my friends at DataTrek, history suggests that the asset classes and equity sectors that would be expected to lead are emerging markets, small caps, US high yield bonds, and the neglected cyclical sectors like Consumer Discretionary, Materials and Industrial. In addition, Technology is always a good bet as a leadership sector (including the cyclical semiconductor industry).
Of course, risks abound, but most have faded into the background with the global economy paralyzed over COVID-19 in the short-term. But the longer-term bogeyman casting the most ominous shadow is the rapidly rising global debt, led by China and the US, and now accelerated by monetary and fiscal response to the pandemic, in a global “debt supercycle,” a term first coined by BCA Research in the 1970s meaning that financial imbalances aren’t allowed to fully unwind as they would in a natural economic cycle. According to the Institute of International Finance, global debt topped $255 trillion, which is over 322% of GDP 40 pps ($87 trillion), and as we initiate emergency response to the pandemic, it is higher than at the start of the 2008 financial crisis. And with so much global debt denominated in US dollars, the Federal Reserve (as the lender of last resort) has put its printing presses in overdrive to buy up Treasuries and other debt securities and establish various lending facilities and currency swap lines, as they must do in order to prevent rising interest rates from undermining a fragile economy and to protect the integrity of US Treasuries as the ultimate safe haven investment and the US dollar as the world’s reserve currency.
Although there is still much uncertainty about the future with the virus and when the economy can get back on track, what we do know is that Americans – and the immigrants who come here for the opportunity (although not the guarantee) to prosper – are industrious with a can-do spirit and an impressive history of rising to the occasion in the face of menacing challenges. I believe our response to this challenge will be no different.
SPY Chart Review:
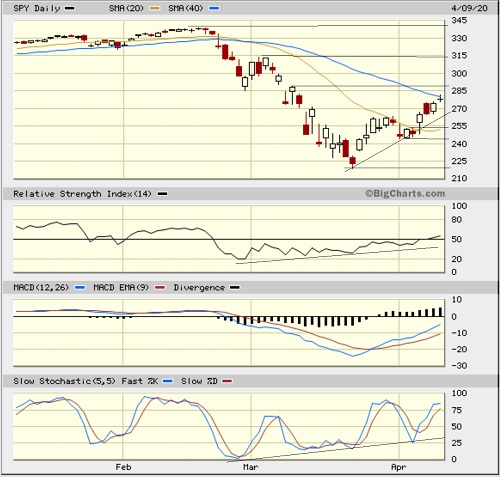
The SPDR S&P 500 ETF (SPY) closed the holiday-shortened week at 278.20. It seems to have successfully retested the 12/24/18 Christmas Eve capitulation low around 220 and has gathered some bullish conviction. The 20-day simple moving average was providing resistance for several days during the bounce, and technicals were starting to look somewhat ominous. But alas, technical signals can be suddenly annulled when a good news report hits the screen, which is what we have been getting consistently so far this month, leading to higher lows on price and oscillators RSI, MACD, and Slow Stochastics. Notably, even while the March selloff was in progress, those oscillators were showing positive divergences in contrast to the ugly price action. Now, SPY is testing resistance at the 40-day SMA, with the 50-day at not much higher at 287, followed by the 100-day and 200-day converging around 300. However, a March 11 bearish price gap has just filled (which is typically followed by a reversal), while price is getting stretched from the 20-day SMA and oscillators suggest the current rally is running low on steam. As for support, the uptrend line is approaching 270, and there are bullish gaps that might fill down at 255 and 227. However, in this news-driven market, technical signals have been much less reliable.
Latest Sector Rankings:
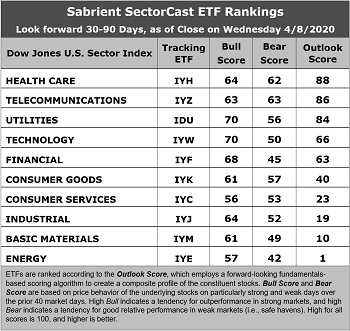
Relative sector rankings are based on our proprietary SectorCast model, which builds a composite profile of each of nearly 500 equity ETFs based on bottom-up aggregate scoring of the constituent stocks. The Outlook Score employs a forward-looking, fundamentals-based multifactor algorithm considering forward valuation, historical and projected earnings growth, the dynamics of Wall Street analysts’ consensus earnings estimates and recent revisions (up or down), quality and sustainability of reported earnings, and various return ratios. It helps us predict relative performance over the next 2-6 months.
In addition, SectorCast computes a Bull Score and Bear Score for each ETF based on recent price behavior of the constituent stocks on particularly strong and weak market days. A high Bull score indicates that stocks within the ETF recently have tended toward relative outperformance when the market is strong, while a high Bear score indicates that stocks within the ETF have tended to hold up relatively well (i.e., safe havens) when the market is weak.
Outlook score is forward-looking while Bull and Bear are backward-looking. As a group, these three scores can be helpful for positioning a portfolio for a given set of anticipated market conditions. Of course, each ETF holds a unique portfolio of stocks and position weights, so the sectors represented will score differently depending upon which set of ETFs is used. We use the iShares that represent the ten major U.S. business sectors: Financial (IYF), Technology (IYW), Industrial (IYJ), Healthcare (IYH), Consumer Goods (IYK), Consumer Services (IYC), Energy (IYE), Basic Materials (IYM), Telecommunications (IYZ), and Utilities (IDU). Whereas the Select Sector SPDRs only contain stocks from the S&P 500 large cap index, I prefer the iShares for their larger universe and broader diversity.
Here are some of my observations on this week’s scores:
1. Healthcare has taken the top spot with an Outlook score of 88, with generally good relative scores across the board, including a reasonable forward P/E (16.0x), relatively good sell-side analyst sentiment (net revisions to EPS estimates), although earnings have been slashed pretty harshly for all sectors, good return ratios, a solid projected year-over-year aggregate EPS growth rate of 10.3%, an attractive forward PEG ratio (forward P/E divided by projected EPS growth rate) of 1.56, and the second-best insider sentiment (open market insider buying). Moving into second is Telecom with a score of 86, mostly due to its low forward P/E (12.6x) and good return ratios. Rounding out the top five (and the only ones scoring above 50) are Utilities, Technology, and Financial. Notably, Technology and Consumer Services (Discretionary/Cyclical) display the highest projected EPS growth rates of 14.3% and 14.5% but also high forward P/Es of 21.4x and 22.4x, respectively (only Energy at 32.3x is higher).
2. At the bottom of the rankings we find three cyclical sectors: Energy, Basic Materials, and Industrial. All have seen massive net reductions to earnings estimates from the sell-side analyst community. Energy now has an infinitesimal EPS growth rate of only 0.4% and a sky-high forward PEG ratio of 72.5.
3. Looking at the Bull scores, Technology and (amazingly) defensive sector Utilities share the top score of 70, as stocks within these sectors in particular have displayed relative strength on strong market days. Consumer Services scores the lowest at 56, but with a top-bottom spread of only 14 points, it reflects quite high sector correlations on strong market days (i.e., all boats lifted). It is desirable in a healthy market to see low correlations reflected in a top-bottom spread of at least 20 points, which indicates that investors have clear preferences in the market segments and stocks they want to hold (rather than broad risk-on behavior).
4. Looking at the Bear scores, instead of the usual defensive sector Utilities alone in the top spot, we now find Telecom with a score of 63 followed by Healthcare at 62, which means that stocks within these sectors have been the preferred safe havens lately on weak market days. Energy displays the lowest score of 42, as investors have fled during recent market weakness. The top-bottom spread is 21 points, which reflects low sector correlations on weak market days. Ideally, certain sectors will hold up relatively well while others are selling off (rather than broad risk-off behavior), so it is desirable in a healthy market to see low correlations reflected in a top-bottom spread of at least 20 points.
5. Healthcare displays the best all-around combination of Outlook/Bull/Bear scores, followed by Telecom, while Energy is the worst. Looking at just the Bull/Bear combination, Healthcare, Telecom, and Utilities tie for the best, indicating superior relative performance (on average) in extreme market conditions (whether bullish or bearish), while Energy is by far the worst.
6. Notably, Healthcare is suddenly the hero during this COVID-19 scare instead of the avoided sector from all the “Medicare for All” talk. I would say this week’s fundamentals-based Outlook rankings barely continue to reflect a neutral bias, although it is borderline defensive given the mix of defensive and economically sensitive sectors among the top six and given that three cyclical sectors are at the bottom. Keep in mind, the Outlook Rank does not include timing, momentum, or relative strength factors, but rather reflects the consensus fundamental expectations at a given point in time for individual stocks, aggregated by sector.
ETF Trading Ideas:
Our Sector Rotation model, which appropriately weights Outlook, Bull, and Bear scores in accordance with the overall market’s prevailing trend (bullish, neutral, or defensive), moved to a defensive bias last month and suggests holding Telecom (IYZ), Healthcare (IYH), and Utilities (IDU), in that order. (Note: In this model, we consider the bias to be defensive from a rules-based trend-following standpoint when SPY is below both its 50-day and 200-day simple moving averages.)
Besides iShares’ IYZ, IYH, and IDU, other highly-ranked ETFs in our SectorCast model (which scores nearly 800 US-listed equity ETFs) from the Telecom, Healthcare, and Utilities sectors include Vanguard Communications Services (VOX), Invesco Dynamic Pharmaceuticals (PJP), and John Hancock Multifactor Utilities (JHMU).
If you prefer a neutral bias, the Sector Rotation model suggests holding Healthcare, Telecom, and Utilities, in that order. On the other hand, if you are comfortable taking a bullish stance on the market, the model suggests holding Utilities, Technology, and Financial, in that order.
An assortment of other interesting ETFs that are scoring well in our latest rankings include Global X SuperDividend REIT (SRET), First Trust Nasdaq Pharmaceuticals (FTXH), VanEck Vectors Uranium+Nuclear Energy (NLR), GraniteShares HIPS US High Income (HIPS), ETFMG Alternative Harvest (MJ), Vesper US Large Cap Short-Term Reversal Strategy (UTRN), Invesco DWA Financial Momentum (PFI), Volshares Large Cap (VSL), Invesco Dynamic Biotech & Genome (PBE), Alerian MLP (AMLP), Loncar Cancer Immunotherapy (CNCR), First Trust North American Energy Infrastructure (EMLP), First Trust Dorsey Wright Momentum & Value (DVLU), Invesco KBW Property & Casualty (KBWP), Virtus LifeSci Biotech Products (BBP), iShares MSCI Global Gold Miners (RING), First Trust NASDAQ Technology Dividend Index (TDIV), and iShares US Home Construction (ITB).
As always, I welcome your thoughts on this article! Please email me – as always, any and all feedback is appreciated!
IMPORTANT NOTE: I post this information periodically as a free look inside some of our institutional research and as a source of some trading ideas for your own further investigation. It is not intended to be traded directly as a rules-based strategy in a real money portfolio. I am simply showing what a sector rotation model might suggest if a given portfolio was due for a rebalance, and I do not update the information on a regular schedule or on technical triggers. There are many ways for a client to trade such a strategy, including monthly or quarterly rebalancing, perhaps with interim adjustments to the bullish/neutral/defensive bias when warranted, but not necessarily on the days that I happen to post this article. The enhanced strategy seeks higher returns by employing individual stocks (or stock options) that are also highly ranked, but this introduces greater risks and volatility. I do not track performance of the ideas mentioned here as a managed portfolio.
Disclosure: At the time of this writing, the author held longer-term long and shorter-term short positions on the SPY.
Disclaimer: This newsletter is published solely for informational purposes and is not to be construed as advice or a recommendation to specific individuals. Individuals should take into account their personal financial circumstances in acting on any opinions, commentary, rankings, or stock selections provided by Sabrient Systems or its wholly owned subsidiary Gradient Analytics. Sabrient makes no representations that the techniques used in its rankings or analysis will result in or guarantee profits in trading. Trading involves risk, including possible loss of principal and other losses, and past performance is no indication of future results.