Sector Detector: Investors pray for quick resolution to election and lockdowns; Value/cyclicals poised to benefit most
 by Scott Martindale
President & CEO, Sabrient Systems LLC
Well, the election is finally upon us, and most folks on either side of the aisle seem to think that the stakes couldn’t be higher. That might be true. But for the stock market, I think removing the uncertainty will send stocks higher in a “relief rally” no matter who wins, as additional COVID stimulus, an infrastructure spending bill, and better corporate planning visibility are just a few of the slam-dunk catalysts. Either way, Modern Monetary Theory (MMT) is here, as both sides seem to agree that the only way to prevent a COVID-induced depression in a highly indebted economy is to print even more money and become even more leveraged and indebted. Now investors can only anxiously pray for a clean, uncontested election, followed soon by a reopening of schools and businesses. Stocks surely would soar.
Of course, certain industries might be favored over others depending upon the party in power, but in general I expect greater market breadth and higher prices into year-end and into the New Year. However, last week, given the absence of a COVID vaccine and additional fiscal stimulus plus the resurgence of COVID-19 in the US and Europe, not to mention worries of a contested election that ends up in the courts, stocks fell as investors took chips off the table and raised cash to ride out the volatility and prepare for the next buying opportunity. The CBOE Volatility Index (VIX) even spiked above 41 last week and closed Friday at 38, which is in panic territory (although far below the all-time high of 85.47 in March).
Nevertheless, even as the market indices fell (primarily due to profit-taking among the bigger growth names that had run so high), many of the neglected value stocks have held up pretty well. And lest you forget, global liquidity is abundant and continuing to rise (no matter who wins the election) – and searching for higher returns than ultra-low (or even negative) government and sovereign debt obligations are yielding.
All in all, this year has been a bit deceiving. While the growth-oriented, cap-weighted indexes have been in a strong bull market thanks to a handful of mega-cap Tech names, the broader market essentially has been in a downtrend since mid-2018, making it very difficult for any valuation-oriented portfolio or equal-weight index to keep up. However, since mid-July (and especially since the September lows) we have seen signs of a nascent rotation into value/cyclicals/small caps, which is a bullish sign of a healthy market. Institutional buyers are back, and they are buying the higher-quality stocks, encouraged by solid Q3 earnings reports.
Going forward, our expectation is that the historic imbalances in Value/Growth and Small/Large performance ratios will continue to gradually revert and market leadership will broaden such that strategic beta ETFs, active selection, and equal weighting will thrive once again. This should be favorable for value, quality, and growth at a reasonable price (GARP) strategies like Sabrient’s, although not to the exclusion of the unstoppable secular growth industries. In other words, investors should be positioned for both cyclical and secular growth.
Notably, Sabrient has enhanced its GARP strategy by adding our new Growth Quality Rank (GQR), which rewards companies with more consistent and reliable earnings growth, putting secular-growth stocks on more competitive footing in the rankings with cyclical growth (even though their forward valuations are often higher than our GARP model previously rewarded). As a result, our newer Baker’s Dozen portfolios launched since December 2019 reflect better balance between secular growth and cyclical/value stocks and across large/mid/small market caps. And those portfolios have shown markedly improved performance relative to the benchmark, even with this year’s continued bifurcation. Names like Adobe (ADBE), Autodesk (ADSK), Digital Turbine (APPS), Amazon (AMZN), Charter Communications (CHTR), NVIDIA (NVDA), and SolarEdge Technologies (SEDG) became eligible with the addition of GQR, and they have been top performers. But at the same time, our portfolios are also well-positioned for a broadening or rotation to value, cyclicals, and small caps. In addition, our three Small Cap Growth portfolios that have launched during 2020 using the same enhanced selection process are all nicely outperforming their benchmark. So, IMHO, this provides solid justification for an investor to take a fresh look at Sabrient’s portfolios today.
In this periodic update, I provide a comprehensive market commentary, offer my technical analysis of the S&P 500 chart, review Sabrient’s latest fundamentals-based SectorCast rankings of the ten US business sectors, and serve up some actionable ETF trading ideas. In summary, I expect stocks to move higher once the election results are finalized – but with plenty of volatility along the way until the economy is fully unleashed from its COVID shackles. In addition, our sector rankings reflect a moderately bullish bias (as the corporate outlook is starting to clear up), the technical picture looks ready for at least a modest bullish bounce from last week’s profit-taking, and our sector rotation model retains its neutral posture. As a reminder, you can go to http://bakersdozen.sabrient.com/bakers-dozen-marketing-materials to find my latest Baker’s Dozen slide deck and commentary on terminating portfolios. Read on....
Commentary:
Q3 2020 real GDP growth was announced by the BEA as +33.1%, which beat the consensus estimate of +30.9%. It was the largest ever GDP growth rate. Of course, the consumer spending that supported this surge was largely the result of the $5 trillion in fiscal and monetary stimulus (aka, the dollar printing press) rather than organic economic activity. Nevertheless, it helped many at-risk businesses survive. Looking ahead, the Atlanta Fed’s GDPNow initial estimate for real GDP growth (seasonally adjusted annual rate) for Q4 2020 is +2.2%. The strong rebound still leaves real GDP about 3% below the year-ago level. From a global perspective, the International Monetary Fund (IMF) estimates that the global economy will contract -4.4% this year, the worst slump since the Great Depression.
However, the economic recovery has been more “K-shaped” than V-shaped in that segments of the economy has been strong (e.g., technology, WFH, online shopping, homebuilding, home improvement) while other segments either have struggled or have been in an outright depression (e.g., oil & gas, commercial real estate, financials, travel & leisure, dining). As a result, there is a strong push for additional fiscal stimulus to target lower income levels, particularly services industries. But as long as the economy remains constrained and relies upon Fed liquidity to function, it exacerbates wealth inequality, as those at the top (i.e., the investors and job creators) with the greatest access to capital get richer through asset appreciation (given little incentive for capital investment in business growth and hiring), while the masses in the middle and at the bottom (i.e., the wage earners, retirees, disabled, and the poor) just get poorer as wages stagnate and currency devalues.
Big corporations have been successful at generating solid earnings nonetheless. Earlier this year, consensus estimates for S&P 500 EPS for 2020 and 2021 were $115 and $150, respectively, but today they have risen to $135 and $167. According to FactSet, the S&P 500 companies in aggregate are reporting a year-over-year decline in Q3 earnings of -9.8% and a year-over-year decline in revenues of -2.1%, which is vastly better than expectations going into the reporting season. The positive surprises have been led by the Communication Services and Consumer Discretionary sectors. In addition, residential home sales have been hot (For example, here in Scottsdale, AZ, homes seem to go into contract before a sign is even planted in the front yard!).
The Tech-oriented companies that have been generating robust earnings and have led the market higher this year make up only about 2% of total payroll jobs, while the industries most impacted by the pandemic are largely the services-oriented ones like retail, transportation, hotels, dining, and entertainment that represent about 20% of total payroll jobs but only about 7% of S&P 500 earnings.
Despite abundant fiscal and monetary stimulus and liquidity injections here in the US and the Fed’s intention to stoke inflation (and “inflate away” the debt over time), global interest rate differentials continue to show a preference for holding dollars such that there is now a global shortage of dollars. Such is the result of a risk-off “flight to quality.” As Ray Dalio of Bridgewater Associates has opined about the dollar that “the world wants to save in that reserve currency. And that gets the country deeper and deeper in debt.” Nevertheless, longer term the expectation is higher inflation and a weaker dollar, which generally correlates with stronger performance in emerging markets, high yield, and gold, as well as cryptocurrencies – especially given rising global interest in central bank digital currencies (CBDCs). So, these are asset classes that might be appealing to add to a diversified portfolio going forward. Year-to-date through October, the iShares MSCI Emerging Markets ETF (EEM) is flat, high-yield index +1.1%, gold +23%, bitcoin +92%, and ether +198%, while the SPDR S&P 500 (SPY) is +1.7% and the Nasdaq 100 (QQQ) is +27%. Notably, the broad Bloomberg Galaxy Crypto Index rose 32% during Q3 alone.
The 30-year Treasury yield closed October at 1.65%, while the 10-year T-note yields 0.88%, the 2-year T-note 0.14%, and the 3-month T-bill 0.09%. So, the 3-month/10-year spread has steepened to +79 bps and the 2-10 spread is +74 bps. The next FOMC meeting is this week, but it is a less momentous event now that the Fed has committed to keeping interest rates low through at least 2023. The CPI has risen solidly from its lows in Q2 to about 1.7% such that real Treasury yields (nominal yield minus CPI) ended the month negative across the yield curve. Nevertheless, a rising 10-year Treasury yield implies increasing confidence in economic recovery. And with 5-year TIPS breakeven inflation around 1.60%, it is back to pre-pandemic levels, and DataTrek noted that history suggests the next leg up for stocks will prod Treasury yields to break out to the upside. They point out as an example that real rates were negative in 2012–2013 but then moved sharply higher when equities rallied strongly.
An abundance of liquidity:
Both investment grade and high yield US corporate bond spreads recently hit a post-pandemic crisis low (at least until last week’s bout of profit-taking), which is bullish for stocks, particularly small caps. The trend for big institutional money noticeably has been targeting Tech, Discretionary, Financials, Materials, Industrials, and Healthcare (again, until last week’s pullback), while defensive sectors like Staples, Real Estate, and Communications saw much less buying. Money supply in the US is growing by nearly 20% year-over-year, with much of this spilling into capital markets. As a result, investor liquidity is also quite high, with nearly $5 trillion in money market funds, while equity exposure among institutional investors is only average – suggesting plenty of fuel for the next leg up.
With tons of freshly printed (some would say “fake”) money at negative real interest rates available to anyone with ready access to capital markets, it has led to the misallocation of capital. Asset prices rise, and in some cases the speculative nature resembles a Ponzi scheme or “Tulip mania,” making it difficult to shrink the Fed balance sheet anytime soon without causing a market meltdown. It also diverts attention of corporate and institutional investors from long-term investment in business growth and hiring (“trickle-down”) to short-term bets, momentum trades, or “hustles,” which may include borrowing at low rates for ill-advised M&A, share buybacks, dividend increases, or management bonuses (as stock price targets are achieved) that benefit management and shareholders but provide no real economic benefit to Main Street. Unfortunately, this has worsened wealth inequality, class warfare, and the populist movement.
So, it should come as no surprise that 179 companies have launched IPOs in the first 10 months of 2020. Some of the bigger IPOs over the past several weeks include cloud software firm Snowflake (SNOW), big-data analytics Palantir Technologies (PLTR), solar company Array Technologies (NASDAQ: ARRY), well-known cybersecurity firm McAfee (NASDAQ: MCFE), and Root (NASDAQ: ROOT), which offers users a mobile app to track a driver’s habits before offering pricing and terms on car insurance. McAfee was previously a public company that was acquired by Intel (INTC) in 2011. Another 142 IPOs are on the docket before year-end, including Airbnb. In addition, the so-called “special purpose acquisition company” (or SPAC) has emerged as an alternative to the IPO process, and they have generated quite a lot of investor interest. It is otherwise known as a “blank check company” since you invest your money knowing only that the SPAC’s stated purpose is to engage in a merger or acquisition with an unidentified company.
In addition, M&A activity has been robust. Inspire Brands just announced an $11 billion buyout of Dunkin’ Brands Group (DNKN) to take it private. Advanced Micro Devices (AMD) announced a $35 billion takeover of Xilinx (XLNX), which makes it the third-biggest semiconductor deal ever behind Nvidia’s (NVDA) $40 billion acquisition of UK-based ARM Holdings from SoftBank Group Corp. (SFTBY) earlier this year and Avago’s $37 billion takeover of Broadcom (AVGO) in 2015. Also, Marvell Technology (MRVL) just announced a $10 billion acquisition of Inphi (IPHI). Interestingly, semiconductor companies used to be considered “deep cyclicals” primarily correlated with PC sales, and trade at single-digit P/E ratios. But today, they have are the foundation of all cutting-edge, secular-growth technologies, including 5G, autonomous vehicles, AI/ML, IoT, virtual reality, robotics, cloud computing, 3-D printing, blockchain, etc.
Value/Growth divergence update:
I have often discussed the major change in market character that started five years ago in mid-2015, as the election campaign rhetoric started up and the Fed started talking about monetary tightening. The market became mostly news-driven with narrow leadership led by a handful of mega-cap secular-growth Technology stocks. As a result, all sorts of value-oriented strategies have struggled mightily. I have mentioned behemoths like AQR Capital, a quantitative hedge fund led by Cliff Asness, that have seen tremendous capital flight due to persistent underperformance of its previously high-performing strategies. Just recently, Ted Aronson, a long-time quantitative value investor at AJO Partners announced he will shutter his firm at year-end and return the $10 billion his team still manages (down from a peak of $30 billion in the early 2000’s). “Our record for the past five years sucks,” he said. But perhaps the tide is changing. It would not be unusual to witness such a towel being thrown in just before the turn.
Below is a 5-year chart (starting 7/1/15) comparing the SPDR S&P 500 (SPY), the Technology Select Sector SPDR (XLK), the Industrials Select Sector SPDR (XLI), the S&P 500 LargeCap Pure Growth ETF (RPG), and the S&P 600 Small-cap Pure Value ETF (RZV). This chart illustrates the stark market bifurcation and relative performance gaps between large vs. small, growth vs. value, and secular-growth vs. cyclical-growth. (Note: Highly cyclical and value-oriented sectors would include Financials, Industrials, Materials, and Energy.)
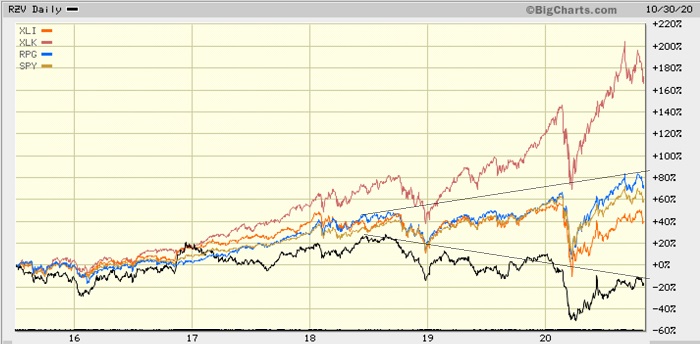
You can see that after the 2016 election, market breadth and the value factor got a nice but short-lived boost during the “Trump Bump,” and then in mid-2018 the trade war with China created a stark and historic market bifurcation due to uncertainty rather than a significant cut to earnings expectations, and the bifurcation has only gotten worse this year due to COVID, economic lockdowns, civil unrest, and a rancorous election campaign. I have highlighted this dynamic with the fan lines tracing the uptrend in RPG versus the downtrend in RZV since mid-2018. The major market-cap-weighted indexes continued to hit new highs on the backs of those mega-cap secular-growth Tech stocks, while a large swath of the market has been quite weak. As a result, for the past two years plus, valuation-oriented portfolios like Sabrient’s underperformed, as did many broad-market equal-weighted indexes.
So, while growth-oriented cap-weighted indexes have given the impression of a strong bull market thanks to a handful of mega-cap Tech names, the broader market essentially has been in a bear market since mid-2018, making it very difficult for any valuation-oriented portfolio or equal-weight index to keep up. Of course, the S&P 500 is dominated by five mega-cap secular-growth Tech stocks – namely Apple (AAPL), Amazon (AMZN), Microsoft (MSFT), Alphabet (GOOGL), Facebook (FB). Those five are up an average of +38.5% YTD and have contributed +8.8% toward the benchmark’s +2.9% YTD return (through end of October), which means the other 500 stocks in the index have lost -5.9% in aggregate – illustrating the extremely narrow leadership that has been so tough to beat for a diversified and equal-weighted portfolio. In fact, the S&P 500 Equal Weight (RSP) is down -5.4% YTD, and the S&P SmallCap 600 Equal Weight (EWSC) is down -13.4%.
However, the next chart shows the more recent signs of a renewed rotation into value/cyclicals/small caps. It compares the same five ETFs as the previous 5-year chart, but with much different relative performance. You can see that since 5/15/20, the small-cap Pure Value ETF (RZV) and the highly cyclical Industrial Select Sector SPDR ETF (XLI) have greatly outperformed the Technology Select Sector SPDR (XLK), the large-cap Pure Growth ETF (RPG) and the SPY, which is at the bottom. According to DataTrek, such outperformance of Industrials over the S&P 500 historically “is a ringing endorsement on the part of equity markets in a brighter economic future for the US. History says…it is definitely the start of a new cycle.”
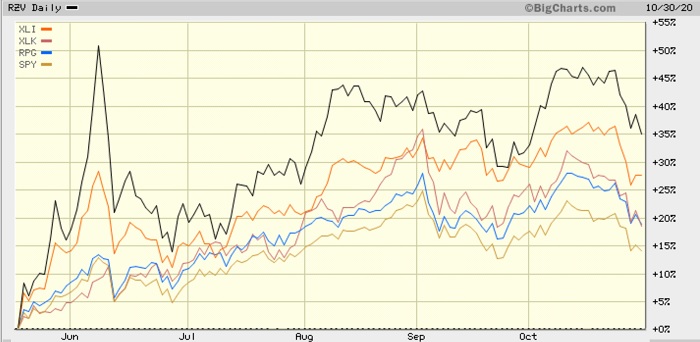
Is this just another short-lived reversion or the start of a sustainable market rotation? Time will tell, but absent another exogenous shock, I think it is sustainable. Again, my expectation is that the historic divergences in Value/Growth and Small/Large performance ratios will continue to gradually converge and market leadership will broaden such that strategic beta ETFs, active selection, and equal weighting will thrive once again, and investors should be positioned for both cyclical and secular growth.
And as credit markets continue to rally with an ongoing US economic recovery, smaller companies should see both better business and credit conditions, facilitating a mean reversion for small caps. Market segments like Industrials and small caps enjoy earnings leverage that is higher than large cap Tech, which provides an advantage during a recovery/expansionary phase.
Among cyclicals, the Industrial sector in particular has shown the strongest recent performance (versus Financial, Materials, and Energy), and I think that will continue. This year has seen a massive technology upgrade cycle in response to WFH and remote learning, which has pulled forward demand. This is reminiscent of the 1999 runup to Y2K when Tech companies pulled forward demand in the form of capital upgrades in fear of widespread computer and system failures due to 2-digit internal calendars, which was followed by a fall-off in demand.
One note of caution, however. When it comes to value stocks, beware of the proverbial “value trap,” i.e., stocks or industries that are beaten down for good reason – they have severe headwinds of unknown duration. Some industries might be hurt temporarily by the pandemic, which could imply a relatively good time to buy. However, other sectors may appear to be cheap on a historical basis but may be suffering permanent damage as a result of structural changes in those industries, regardless of the pandemic. The Energy sector is a perfect example. Not so long ago, Energy was the largest sector in the S&P 500, with several names among the world’s largest companies. How quickly that changed. And it’s not just due to the Green/Renewables/Sustainability movement, as rising productivity and efficiency in industry and transportation – as well as within the Energy sector itself, allowing the US to become essentially energy independent – have conspired to depress oil prices and share prices of oil & gas companies. And that enticing 13% dividend yield you are looking at may not be sustainable, especially considering the highly leveraged balance sheets of so many players in the space.
In 1980, the Energy sector represented a third of the S&P 500 and six of the 10 largest companies in the world were oil companies. Today, oil represents just 2% of the S&P 500. Even as recently as 2013, Exxon-Mobil (XOM) was still competing with AAPL for the top spot as the largest publicly traded company. Back then, XOM was making a lot more profits than AAPL was, but today it has reversed. Remarkably, XOM and its Energy sector brethren have lagged so much over the past several years that each of the four largest Tech stocks (MSFT, AAPL, AMZN, GOOG) is larger by itself than the aggregate market cap of the entire Energy sector within the S&P 500 (about $570 billion). Zoom Video (ZM), which just went public last year, has zoomed up to $131 billion market cap, which nearly equals XOM’s $138 billion. Simply amazing.
On the other hand, let’s not delude ourselves into thinking the demise of fossil fuels is at hand. Yes, the rise of Green Energy is clearly a secular trend, but the headwinds currently facing oil and gas is only a cyclical trend. The oil experts at Goldman Sachs and the IMF predict that fossil fuel demand will not reach a peak until at least 2030 and 2040, respectively, at which time the secular decline in oil will commence. And keep in mind that much of the electricity charging up your Tesla is produced by coal, oil, or gas-fired power plants, not to mention the mining of the metals required to make the batteries and solar cells (including silver, indium, and rare earths like lithium) is an ecologically destructive process. Although the trade-offs might be positive, there is no free lunch.
Final comments:
The market pullback has brought down the S&P 500 forward P/E multiple for 2021 back down to 19.6x (based on FactSet consensus of $167.10/share), while the equal-weight versions of the S&P 500, MidCap 400, and SmallCap 600 clock in at 16.7x, 14.9x, and 14.7x, respectively. My view is that, rather than a selloff to bring valuations down further, more likely there will be some rotation from the liquidity-driven investing of the past several years to profit-driven investing, which would favor cyclical/value-oriented sectors (e.g., industrial, financial, materials, energy), and commodity-oriented industries, supported by a weaker dollar.
Again, this is not to the exclusion of the unstoppable secular growth trends. But I expect a market broadening away from the narrow investor focus on mega-cap Tech. This should be favorable for Sabrient’s GARP portfolios, especially given our enhanced quant model and selection approach that allows for a more “all-weather” portfolio with better balance between secular growth and cyclical/value stocks and across large/mid/small market caps.
All in all, despite a recent surge in COVID cases, the outlook for the economy and stocks continues to look good, primarily due to:
- Economic reports continue to strengthen.
- Q3 corporate earnings have been much better than expected, with accelerated upside forecasted.
- The Fed has committed to ultra-low interest rates for the foreseeable future, which makes equities attractive by comparison in 3 ways: 1) discounting future earnings streams at a low discount rate means higher present value, 2) a lower cost of capital boosts EPS, and 3) bonds as an alternative to stocks have less upside for capital appreciation and lower yields for income, i.e., TINA (there is no alternative)
- Massive fiscal and monetary stimulus will continue to grow, which makes rising inflation more likely. No matter who is elected, our government will continue to borrow and spend at an unprecedented rate.
We could be seeing peak dollar and maybe peak levels of liquidity, but liquidity is not going to collapse anytime soon. There is no sign that China is easing again, but it will likely come. Equities should continue to outperform while the yield curve steepens, rendering longer-term bonds vulnerable, particularly given the specter of gradually rising inflation.
The only thing that can stop us is disunity, in my view. So, as we tally the votes in this bitter election, let me leave you with this stark reminder. I keep hearing that “we can’t afford four more years of Trump” or “we can’t afford a Leftist Takeover of our great country.” What we truly can’t afford, however, is to continue to paralyze the country with extreme political polarization and economic lockdowns while China continues to move forward with a laser focus toward its goal of global financial/technological/military hegemony – albeit with quite a burden of leverage and indebtedness of its own. A contested election tied up in the courts, with American society descending into an even uglier civil conflict, serves no one’s (except perhaps China’s) best interests. If we can get past this election quickly, I am optimistic that the American Dream and our entrepreneurial spirit will prevail, and we will find a way forward.
I believe that stocks are poised to rise post-election, no matter the outcome. There just must be an outcome. And we cannot go back to widespread lockdowns of our schools and businesses. A reined-in economy, bolstered by massive liquidity, low interest rates, low tax rates, deregulation, and the innovation/disruption of rapidly advanced technologies, is spilling over and ready to burst the dam that has been the COVID lockdown (so long as tax and regulatory policy is not suddenly reversed to hinder robust economic activity). We just need to unleash the pent-up demand and abundant cash on the sidelines, and we will see the economy and stock market soar.
SPY Chart Review:
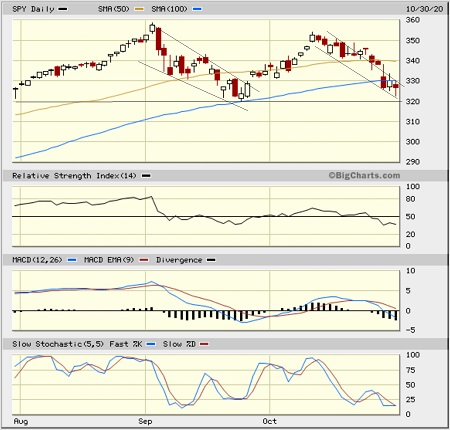
After a harsh pullback during the latter half of October that essentially mirrored the early-September correction and retested support near 320, the SPDR S&P500 Trust (SPY) closed out October at 326.54. The elevated volatility was not unexpected given the imminent election and a resurgent COVID. But the technical picture appears primed for at least a solid bounce – although short-term technical signals can be quickly reversed at such a pivotal moment. October’s final trading day displayed a bullish hammer candlestick pattern, and oscillators RSI, MACD, and Slow Stochastic are all poised to move higher out of oversold territory.
Latest Sector Rankings:
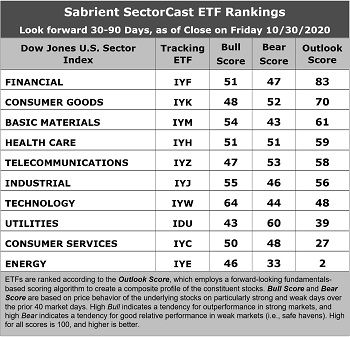
Relative sector rankings are based on our proprietary SectorCast model, which builds a composite profile of each of nearly 500 equity ETFs based on bottom-up aggregate scoring of the constituent stocks. The Outlook Score employs a forward-looking, fundamentals-based multifactor algorithm considering forward valuation, historical and projected earnings growth, the dynamics of Wall Street analysts’ consensus earnings estimates and recent revisions (up or down), quality and sustainability of reported earnings, and various return ratios. It helps us predict relative performance over the next 2-6 months.
In addition, SectorCast computes a Bull Score and Bear Score for each ETF based on recent price behavior of the constituent stocks on particularly strong and weak market days. A high Bull score indicates that stocks within the ETF recently have tended toward relative outperformance when the market is strong, while a high Bear score indicates that stocks within the ETF have tended to hold up relatively well (i.e., safe havens) when the market is weak.
Outlook score is forward-looking while Bull and Bear are backward-looking. As a group, these three scores can be helpful for positioning a portfolio for a given set of anticipated market conditions. Of course, each ETF holds a unique portfolio of stocks and position weights, so the sectors represented will score differently depending upon which set of ETFs is used. We use the iShares that represent the ten major U.S. business sectors: Financial (IYF), Technology (IYW), Industrial (IYJ), Healthcare (IYH), Consumer Goods (IYK), Consumer Services (IYC), Energy (IYE), Basic Materials (IYM), Telecommunications (IYZ), and Utilities (IDU). Whereas the Select Sector SPDRs only contain stocks from the S&P 500 large cap index, I prefer the iShares for their larger universe and broader diversity.
Here are some of my observations on this week’s scores:
1. The scores have become much less bunched together, which reflects lessening uncertainty as sell-side analysts have been raising EPS estimates across all sectors. Financial has taken the top spot with an Outlook score of 82. The sector displays strong sell-side analyst sentiment (positive net revisions to EPS estimates), good return ratios, a modest forward P/E of 16.1x, and an attractive forward PEG (forward P/E divided by projected EPS growth rate) of 1.82. Consumer Goods (Staples/Noncyclicals) takes the second spot with an Outlook score of 70. Rounding out the top six are Basic Materials, Healthcare, Telecom, and Industrial. Notably, Technology has fallen to the seventh spot primarily due to only modestly positive EPS revisions and a high forward P/E of 26.0x, although it still boasts the highest projected NTM EPS growth rate of 14.6% and the highest return ratios.
2. The bottom three sectors are Energy with an Outlook score of 2, Consumer Services (Discretionary/Cyclicals) at 27, and Utilities at 39. Energy has long been the cellar-dweller given its poor near-term growth prospects (with oil prices so low and demand suppressed) and the highest forward P/E and PEG ratios.
3. Looking at the Bull scores, Technology displays the top score of 64, followed by Industrial at 55 and Basic Materials at 54, as stocks within these sectors have displayed relative strength on strong market days. Utilities scores the lowest at 43. The top-bottom spread of 21 points reflects low sector correlations on strong market days. It is desirable in a healthy market to see low correlations reflected in a top-bottom spread of at least 20 points, which indicates that investors have clear preferences in the market segments and stocks they want to hold.
4. Looking at the Bear scores, defensive sector Utilities scores the highest at 60, followed by Telecom and Consumer Goods (Staples/Noncyclical), as stocks within these sectors have been the preferred safe havens lately on weak market days. Energy displays by far the lowest score of 33, as investors have fled during recent market weakness. The top-bottom spread is 27 points, which reflects high sector correlations on weak market days. Ideally, certain sectors will hold up relatively well while others are selling off (rather than broad risk-off behavior), so it is desirable in a healthy market to see low correlations reflected in a top-bottom spread of at least 20 points.
5. Financial displays the best all-around combination of Outlook/Bull/Bear scores, while Energy is by far the worst. Looking at just the Bull/Bear combination, Technology is the best (led by its high Bull score) followed by Utilities (led by its high Bear score), indicating superior relative performance (on average) in extreme market conditions (whether bullish or bearish), although Healthcare offers the best balance (with 51 for both Bull and Bear scores). Energy again scores the worst.
6. This week’s fundamentals-based Outlook rankings have a moderately bullish bias, given that cyclical sectors Financial and Materials score so highly, offset somewhat by the high score for Consumer Goods (Staples/Noncyclicals). In this unprecedented climate, it is not surprising that the near-term outlook in our fundamentals-based model remains somewhat cloudy (although it is gradually clearing). Keep in mind, the Outlook Rank does not include timing, momentum, or relative strength factors, but rather reflects the consensus fundamental expectations at a given point in time for individual stocks, aggregated by sector.
ETF Trading Ideas:
Our Sector Rotation model, which appropriately weights Outlook, Bull, and Bear scores in accordance with the overall market’s prevailing trend (bullish, neutral, or defensive), retains a neutral bias and suggests holding Financial (IYF), Consumer Goods (IYK), and Basic Materials (IYM), in that order. (Note: In this model, we consider the bias to be neutral from a rules-based trend-following standpoint when SPY is between its 50-day and 200-day simple moving averages.)
If you prefer a bullish bias, the Sector Rotation model suggests holding Technology, Financial, and Industrial, in that order. On the other hand, if you are more comfortable with a defensive stance on the market, the model suggests holding Utilities, Consumer Goods (Staples/Noncylicals), and Telecom, in that order.
An assortment of other interesting ETFs that are scoring well in our latest rankings include SPDR S&P Capital Markets (KCE), iShares US Regional Banks (IAT), SPDR S&P Homebuilders (XHB), iShares US Broker-Dealers & Securities Exchanges (IAI), Invesco S&P 500 Equal Weight Financials (RYF), First Trust Morningstar Dividend Leaders (FDL), Invesco KBW High Dividend Yield Financial (KBWD), First Trust NASDAQ Bank (FTXO), Invesco Dynamic Pharmaceuticals (PFP), Schwab US Dividend Equity (SCHD), Invesco S&P SmallCap Value with Momentum (XSVM), Innovator IBD 50 (FFTY), iShares Focused Value Factor (FOVL), WBI Power Factor High Dividend (WBIY), Invesco Dynamic Building & Construction (PKB), Invesco Dynamic Semiconductors (PSI), and WisdomTree US SmallCap Dividend (DES).
As always, I welcome your thoughts on this article! Please email me anytime. Any and all feedback is appreciated!
IMPORTANT NOTE: I post this information periodically as a free look inside some of our institutional research and as a source of some trading ideas for your own further investigation. It is not intended to be traded directly as a rules-based strategy in a real money portfolio. I am simply showing what a sector rotation model might suggest if a given portfolio was due for a rebalance, and I do not update the information on a regular schedule or on technical triggers. There are many ways for a client to trade such a strategy, including monthly or quarterly rebalancing, perhaps with interim adjustments to the bullish/neutral/defensive bias when warranted, but not necessarily on the days that I happen to post this article. The enhanced strategy seeks higher returns by employing individual stocks (or stock options) that are also highly ranked, but this introduces greater risks and volatility. I do not track performance of the ideas mentioned here as a managed portfolio.
Disclosure: At the time of this writing, among the securities mentioned, the author held long positions in EEM, XOM, MRVL, APPS, ZM, gold, bitcoin, and ether, plus protective puts on SPY..
Disclaimer: This newsletter is published solely for informational purposes and is not to be construed as advice or a recommendation to specific individuals. Individuals should take into account their personal financial circumstances in acting on any opinions, commentary, rankings, or stock selections provided by Sabrient Systems or its wholly owned subsidiary, Gradient Analytics. Sabrient makes no representations that the techniques used in its rankings or analysis will result in or guarantee profits in trading. Trading involves risk, including possible loss of principal and other losses, and past performance is no indication of future results.