Sector Detector: Defensive sectors have led indexes to new highs, but cyclicals are perking up
 by Scott Martindale
President, Sabrient Systems LLC
The major cap-weighted market indexes continue to achieve new highs on a combination of expectations of interest rate cuts and optimism about an imminent trade deal with China. Bulls have been reluctant to take profits off the table in an apparent fear of missing out (aka FOMO) on a sudden market melt-up (perhaps due to coordinated global central bank intervention, including the US Federal Reserve). But investors can be forgiven for feeling some déjà vu given that leadership during most of the past 13 months did not come from the risk-on sectors that typically lead bull markets, but rather from defensive sectors like Utilities, Staples, and REITs, which was very much like last summer’s rally – and we all know how that ended (hint: with a harsh Q4 selloff). In fact, while the formerly high-flying “FAANG” group of Tech stocks has underperformed the S&P 500 since June 2018, Barron’s recently observed that a conservative group of Consumer sector stalwarts has been on fire (“WPPCK”) – Walmart (WMT), Procter & Gamble (PG), PepsiCo (PEP), Costco (COST), and Coca-Cola (KO).
This is not what I would call long-term sustainable leadership for a continuation of the bull market. Rather, it is what you might expect in a recessionary environment. When I observed similar behavior last summer, with a risk-off rotation even as the market hit new highs, I cautioned that defensive stocks would not be able to continue to carry the market to new highs (with their low earnings growth and sky-high P/E ratios), but rather a risk-on rotation into cyclical sectors and small-mid caps would be necessary to sustain the uptrend. Instead, the mega-cap Tech names faltered and the market went into a downward spiral. Many analysts and pundits have been forecasting the same for this year.
But when I hear such widespread pessimism, the contrarian voice in my head speaks up. And indeed, the FAANG names – along with powerhouse Microsoft (MSFT) and cyclicals like Semiconductors, Homebuilders, and Industrials – have been showing leadership again so far this year, especially after that historic market upswing in June. Rather than an impending recession, it seems to me that the US economy is on solid footing and “de-coupling” from other developed markets, as First Trust’s Brian Wesbury has opined.
The US economic expansion just became the longest in history, the latest jobs report was outstanding, unemployment remains historically low, business and consumer confidence are strong, institutional accumulation is solid, and the Federal Reserve is a lock to lower interest rates at least once, and more if necessary (the proverbial “Fed Put”). Indeed, the old adages “Don’t fight the Fed!” (as lower rates support both economic growth and higher equity valuations) and “The trend is your friend!” (as the market hits new highs) are stoking optimism and a critical risk-on rotation, leading the S&P 500 this week to touch the magic 3,000 mark and the Dow to eclipse 27,000. If this risk-on rotation continues, it bodes well for Sabrient’s cyclicals-oriented portfolios.
In this periodic update, I provide a detailed market commentary, offer my technical analysis of the S&P 500, review Sabrient’s latest fundamentals based SectorCast rankings of the ten US business sectors, and serve up some actionable ETF trading ideas. In summary, our sector rankings look neutral to me (i.e., neither bullish nor defensive), while the sector rotation model retains a bullish posture. Read on…
Market Commentary:
After the strong Q1 rally in which the S&P 500 gave its best Q1 performance of the new millennium on strong breadth, Q2 turned out to be pretty good, too, thanks to a strong June that offset a risk-off period from mid-April through May. During June, not only did stocks rally, but credit spreads narrowed, commodity prices rose, and Treasury yields fell even further (with the 10-year falling below 2%), resulting in positive returns across all asset classes. Today, all the major indexes appear to be consolidating recent gains before embarking upon an upside breakout. P/E multiples are expanding, particularly among large caps, as stocks rise despite a temporary slowdown in earnings growth. Why are investors bidding up stocks so aggressively? Partly it’s due to the adages “there is no alternative” (aka TINA) and “fear of missing out” (aka FOMO), and partly because they are truly focused on the opportunities ahead. And on that horizon, recession fears are falling, optimism regarding a US-China trade resolution is rising, US economic data is solid, the Fed has taken a more dovish stance, and corporate profits have been coming in better than expected. A low bar of earnings expectations for Q1 led to upside surprises, as I anticipated, with more earnings beats expected as Q2 earnings season gets underway, and stocks seem to be pricing in stronger economic growth for 2H2019 and 2020.
In my commentary last month, I opined that the May pullback was another buy-the-dip opportunity as the pervasive worries about imminent global recession and a bear market caused by escalating trade wars had only weak justification, and that the latest defensive rotation, including shunning of cyclical sectors, relative weakness in small caps, and global capital flight into Treasuries causing plunging yields (and a 3-mo/10-yr yield curve inversion), has been driven more by uncertainty rather than hard data, as well as $10 trillion in global debt paying (or taking) negative interest rates overseas. Well, indeed the dip was bought, and I still expect that a resolution to the trade war will send stocks in general – and risk-on market segments in particular – soaring … but until then, it is hard to predict when investor sentiment will again align with the still-solid fundamentals.
I have been predicting that the S&P 500 would hit 3,000 by year-end, but here we are barely into the second half of the year, and it is already there. Doomsayers have been predicting the end of this bull market for years, and the Q4 selloff seemed to confirm it. But, it wasn’t to be as a new leg higher scaled a giant Wall of Worry – most notably the trade war with China, and perhaps some concern among corporate leaders that all the fiscal stimulus might disappear next year if Trump is not reelected (although many might not like him personally, they greatly prefer his policies to the alternatives being bandied about on the other side, including higher taxes and ramping up regulations).
The S&P 500 put in its best June performance (+7%) since 1955 and its best 1H since 1999 (at the height of the dot.com craze), and to celebrate Independence Day, it achieved yet another new all-time high last week (along with the other mega-cap-dominated indexes like the Dow and Nasdaq) before touching the 3,000 level this week. Year-to-date total returns through the end of Q2 showed Nasdaq +21.5%, S&P 500 +18.3% (and +25% since the Christmas Eve low), and the Dow +14.0%. However, the Bloomberg Commodity Index is only +2.7% YTD, with gold at +10.2%, and the Russell 2000 small cap index continues to lag at +17.9%.
Moreover, it should be noted that while the S&P 500 has continued to hit new highs into July, the Russell 2000 still sits about 10% below its 8/31/2018 high. In fact, ever since the market’s defensive rotation and bifurcation (i.e., rising even though risk-on segments fell) started on 6/11/2018, the Russell 2000 performance trails the S&P 500 by around 15 percentage points (pps) and the S&P 400 mid-cap trails by 10 pps. Notably, mid caps are generally considered less risky than smalls, and they historically have been the “sweet spot” for Sabrient’s portfolios, but they along with small caps have been largely neglected by investors for an extended timeframe, and as ProShares observed in its latest update, “mid caps now trade at over a 35% discount (price-to-book) to the S&P 500 compared to parity in 2011.” While the S&P 500 sports a forward P/E of 17.4x, the S&P 400 is at 16.9x, the S&P 600 is at 16.2x, and the Russell 2000 is at 15.9x.
The stark underperformance in the Russell 2000 runs counter to the expectation that the more domestically oriented companies in the small cap space would be better positioned to thrive in an environment of global uncertainty and a strong dollar, but investors instead have preferred to go with large cap companies displaying more stable earnings, lower debt, and larger cash balances. The chart below illustrates the ebb-and-flow of the risk-on/risk-off behavior since June 2018, and in almost every phase, small caps have lagged large caps.
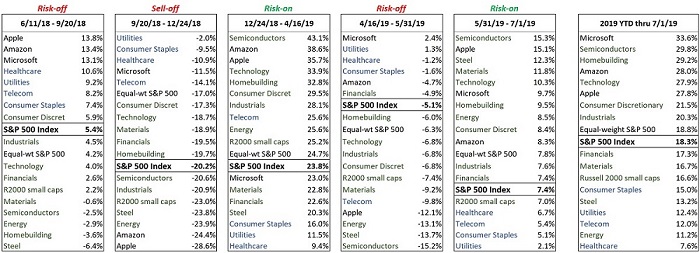
Indeed, there are growing concerns among some that 2019 may be shaping up much like 2018 such that investors are feeling some déjà vu and worrying about a similar late-year selloff. Last summer, as the S&P 500 rose in the face of a defensive internal rotation, I opined that it was not a healthy rally and therefore unlikely to continue without a rotation back into risk-on cyclical sectors and small caps. But instead, the market sold off hard when the mega-cap Tech names came out with disappointing earnings reports and the risk-on rotation didn’t materialize. This year, as the index hits new highs this year, some market metrics may be raising a red flag. For example, we had brief but troubling risk-off rotation during the timeframe 4/16/19-5/31/19 in which investors rotated into Treasuries, defensive sectors, and reliable dividend payers while the 10-year Treasury yield plummeted. In addition, valuation metrics show the S&P 500 trading at an elevated P/E ratio of about 17.4 times forward 12-month EPS estimates, with even higher valuations in defensive sectors Consumer Staples (XLP) at 20.3x and Utilities (XLU) at 18.7x.
S&P Global recently observed that the S&P 500’s performance in Q2 appeared to be a “low conviction rally” led by Minimum Volatility and Low Volatility (i.e., risk-off) factors, and with Momentum and High Beta (i.e., risk-on) factors lagging. Low Volatility’s performance over the past year is particularly remarkable in light of its trailing beta to the market return. Over the past 12 months through 6/30, the firm observed that the S&P 500 Low Volatility Index has gained +19.0% versus +10.4% for the S&P 500 Index, which is “unusually strong performance for a defensive index in a rising market.” The analysts opined that it was a disappointing 12 months for the three traditional Fama-French factors: size, value, and beta, as the S&P SmallCap 600 returned -5.1%, S&P 500 Pure Value +1.8%, and S&P 500 High Beta +1.3%.
Fund flows suggest strong demand for low-volatility and momentum strategies as well as fixed income (tilted to shorter maturities and higher credit quality). Moreover, it’s harder than ever to find even a whiff of inflation in the developed world. Here in the US, the 10-year TIPS breakeven has fallen to 1.77%, and the 5-year breakeven is 1.63%. Perhaps this isn’t surprising given the secular disinflation of rapidly evolving technology and rising productivity, but we are also dealing with cyclical slowing in global economic growth. Notably, Morgan Stanley’s index of capex has shrunk to its lowest level in two years, and the expectation is for a reduction in capital spending from 11% last year to just 3% this year.
And there is plenty more to worry about. Morgan Stanley just lowered its recommended allocation to stocks, saying that the outlook for markets over the next three months is poor, with equity valuations way too high given deterioration in global manufacturing and economic data and expectations for rate cuts already priced in. Nouriel “Dr. Doom” Roubini warned of a global recession next year, as he expects the US-China trade negotiations to collapse and the world to continue upon a path of “deglobalization,” with central banks left with few tools at their disposal to save the day. Also, BlackRock’s latest midyear outlook states, “We downgrade our growth outlook and prefer a modestly more defensive investing stance amid rising macro uncertainty.” Goldman Sachs thinks that the tight labor market and escalating wages will soon start eating into corporate profitability. And not to be outdone, the New York Fed’s recession probabilities model now puts the odds at 33% for a recession in 2020, which is its highest probability since April 2008.
But it seems to me that underneath it all lies a healthy level of business, consumer, and investor optimism that things just might work out for the better, which essentially has created an investor fear of missing out (aka FOMO) on a major market melt-up. This is why investors are loath to sell their stocks, preferring to periodically rotate into defensive names when, for example, trade negotiations stall, and then going a little more risk-on when the news is more encouraging.
The smart folks at DataTrek compared 2019 to 1987 (yes, the year of the big October crash) and observed that both years enjoyed big market gains during H1, but also stagnant corporate earnings, a Federal Reserve on a dovish path toward lower rates, declining 10-year yields, sluggish inflation, and a trade war (with Japan back then, China today). However, they astutely observe that the composition of the S&P 500 has changed a lot since then. In 1987, the S&P 500 was dominated by Consumer Discretionary at 17%, Industrials at 14%, and Energy at 13%, which are all highly sensitive to fluctuations in interest rates for both capital investment and consumer demand. But today, the index is dominated by Technology at 27% (if you include Amazon, Google, and Facebook), Healthcare at 14%, and Financials at 13%, which are sectors that are largely unaffected by interest rates. (Notably, despite oil prices sticking solidly around $60, the Energy sector has been so out of favor for the past five years that it now composes only 5% of the S&P 500, which is near to the lowest allocation ever.) Thus, lower interest rates today have more impact on stock valuation (due to a lower discount rate) than on the underlying business. DataTrek’s conclusion: “things really are different this time.”
Moreover, for many years throughout the 1980s,1990s, and early 2000s, interest rates were much higher such that the equity risk premium averaged around zero. Round numbers, if we flip the 50-year average forward P/E of 14x upside-down it gives an average earnings yield around 7%, which is about what the 10-year Treasury yield averaged during those years, as well. But today, a forward P/E of 17x implies an earnings yield of nearly 6% versus a 10-year yield around 2%, which is an equity risk premium of nearly 4%. So, with interest rates likely to remain low (but unlikely to move a lot lower), we could see further expansion in forward P/E ratios. But with interest rates already quite low, taking them even lower might not be very stimulative at all, i.e., the so-called “liquidity trap” in which more liquidity gives a temporary psychological boost but doesn’t make much difference in the long run (e.g., Europe and Japan).
Keep in mind that there are only two things that can directly lead to rising stock prices – 1) rising earnings or 2) a higher valuation multiple (i.e., P/E ratio) driven by falling interest rates (i.e., a lower discount rate on future earnings). But with no material earnings growth forecasted for the S&P 500 this year, gains in the market multiple have exactly matched the gains in the index. So, for the moment, the direction in interest rates is dictating the direction in stock prices. To my mind, a disinflationary and highly indebted global economy suggests that low interest rates are indeed the “new normal.” However, I think we will need a breakthrough in trade negotiations, leading to a surge in corporate capex and earnings forecasts, for stocks to surge a lot higher into year-end.
Fortunately, this bull market has not been based on excesses (aka “irrational exuberance”) but instead has climbed a proverbial Wall of Worry – largely on the backs of defensive sectors and mega-caps and fueled by persistently low interest rates – with a pervasive caution about various bogeymen hiding behind every door. The resulting low level of bullish conviction has limited the usual excesses that have historically killed previous bull markets, which tells me that deployment of the massive hordes of idle cash and some rotation out of bonds could really juice this market once a major catalyst (like a trade deal) ignites a resurgence in business capital spending and a sustained risk-on rotation in stocks. Notably, the recent BAML Global Fund Manager Survey indicated the largest jump in cash balances since the debt ceiling crisis in 2011 and the lowest allocation ratio of equities to bonds since May 2009.
I wrote quite a bit last month about China and the trade war, but the upshot is that their unfair trade practices and flouting of WTO rules and intellectual property protections have been festering for nearly 20 years, and to his credit President Trump decided he wasn’t going to continue his predecessors’ practice of kicking the can down the road to a future administration. China clearly (and dangerously) is intent on challenging the US for global dominance – economically, technologically, and militarily – with its powerful brand of state-sponsored capitalism. Playing fair by honoring patents, free markets, and the open flow of global capital would simply serve up too many obstacles to its aggressive goals (like the Belt & Road Initiative and Made in China 2025) to be bothered with, and flouting those “rules of the game” has amounted to a massive subsidy that fueled its amazing growth, which it can ill-afford to give up.
Some conservative commentators and politicians now are criticizing Trump for caving too quickly with minor concessions – essentially rewarding China’s intransigence just when it was truly feeling the pinch on growth (necessitating new stimulus for an already debt-laden economy, as manufacturers increasingly move operations to places like Vietnam, India, Malaysia, or Taiwan) – in an effort to ensure the US economy and stock market stay strong into the 2020 election. But others might infer that he is simply alternating a carrot and a stick, rather than doing what most politicos do in employing only one or the other exclusively with little success. But although it seems that time is not on Trump’s side, with the election next year, it is really China that has taken a massive gamble, given its precarious economic situation. My view is that China must cut a deal of some sort by year-end if not sooner, no matter what vitriol you hear from its state-controlled press. If you didn’t read my extensive discussion on China last month, I would encourage you to do so.
Eliminating the fog of global trade uncertainty would provide a predictable environment for business capex planning and steady (but not exuberant or inflationary) earnings growth. Of course, the other factor likely to prevent an over-exuberant market reaction to a China trade deal is the looming US election next year and the threat of a Democratic victory undoing the fiscal stimulus (corporate tax cuts and deregulation) and cranking open the government spending spigot far more than the profligacy already in place. But no matter who is elected next year, the intractable problem of income inequality will have to be addressed – preferably by unleashing free market capitalism rather than reining it in through Big Government socialism.
As for US GDP, the BEA’s second estimate of Q1 growth (as of 6/27/19) is +3.1%. Looking ahead to 2Q2019, the Atlanta Fed’s GDPNow model issued an updated estimate (as of July 10) of 1.4% GDP growth, while the NY Fed’s NowCast suggests 1.5% for Q2 and 1.7% for Q3 (as of July 5) and the St. Louis Fed’s NowCast sees 2.9% (as of July 5).
Markets are now pricing in three rate cuts from the Federal Reserve over the next four meetings. CME Group fed funds futures now place 100% probability of at least a 25 basis point rate cut at the July FOMC meeting at month-end (including an 18% chance of 50 bps), and by January there’s a 92% chance that rates will be 50 bps lower, a 62% chance of 75 bps lower, and a 26% chance the fed funds rate will be 100 bps lower (i.e., target range of 125-150 bps, versus 225-250 today).
The 10-year Treasury yield late on Thursday sat at 2.14% (up 10 bps from the previous day, following Fed chair Jay Powell’s testimony before Congress) after briefly falling below 1.95% last week, while the 2-year is at 1.86%, and the 3-month T-bill is at 2.14%. Suddenly, the 3-month/10-year spread is flat after a lengthy inversion, while the 2-10 spread sits comfortably at 28 bps. Despite its extreme pullback, the US 10-year yield continues to look quite attractive compared with other developed market 10-year yields, like troubled Italy at 1.71%, Canada at 1.63%, Australia at 1.44%, UK at 0.84%, France at 0.027% (after briefly going negative last week for the first time ever), Japan at -0.15%, and Germany at -0.26%. Nevertheless, to many market participants, the persistent inversion in the 3-month/10-year seems like a clear recession signal, and yet economic data continues to hold up pretty well. As I have often stated, I believe the 3-month/10-year inversion is a false signal driven by low (or negative) rates overseas rather than trouble here at home, but I remain mindful that the US is not an island unto itself, immune from distress throughout the global economy.
Although corporate earnings are expected to remain mostly flat this year, the good news is that revenues continue to rise, and a trade deal with China should lead to an even healthier economy, rising corporate earnings, and a rotation of capital out of long-term bonds and into equities that will not only restore (and steepen) a positive yield curve but also fuel higher highs in stocks. Lastly, although small caps continue to lag, sector leadership so far this year has come from cyclical market segments like Semiconductors, Homebuilding, Consumer Discretionary, and Industrials. Notably, FactSet reported that industry analysts in aggregate predict the S&P 500 will see an 8.3% increase in price over the next 12 months, compared to closing prices on July 2, which would put the index near 3,220 by July of next year.
Although I support the cause against China’s unfair practices given the enormous importance for our nation’s future, the resulting lengthy spells of risk-off sentiment over roughly the past 16 months and the continued lag in performance of small and mid-caps have been challenging for Sabrient’s growth-and-valuation-driven portfolios, which are dominated by the neglected cyclical sectors and small-mid caps, as large caps have lacked the compelling levels of growth at attractive prices, e.g., forward PEG ratio.
However, we think there is reason to be optimistic about the future for Sabrient’s Baker’s Dozens and our other growth and dividend-oriented portfolios like Sabrient Dividend Opportunity, which comprises 50 growth-at-a-reasonable-price (aka GARP) stocks paying an aggregate yield in excess of 4% in what is essentially a growth-and-income strategy, as well as our 50-stock Small Cap Growth portfolios. And performance so far this year supports this thesis. Although 2H2018 was especially brutal on all of our various portfolios (especially the small cap selections), this year has been doing much better. And if we also see an easing of trade war tensions, or preferably an outright resolution to the stand-off, the market would be expected to continue a risk-on path, led by small-mid caps and cyclicals, which we expect would be beneficial to all of our portfolios. Although we don’t “force” cyclicals into our GARP portfolios, our quantitative GARP model favors stocks that are expected to achieve solid earnings growth while still selling at an attractive price – and most of those tend to come from the cyclical sectors when we have a growing economy. Sabrient is known for our model-driven GARP approach, and our model is directing us to smaller caps, as many of the high-quality large caps that are expected to generate solid earnings growth already have been bid up relative to small caps.
As a reminder, I am always happy to make time for conversations with advisors about market conditions, outlook, and our portfolios.
SPY Chart Review:
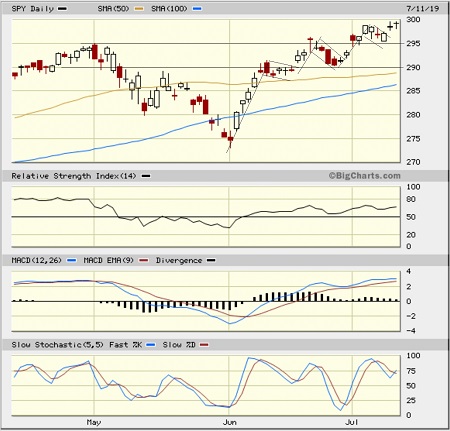
The SPDR S&P 500 ETF (SPY) blasted higher in June and is now challenging the historic 300 level and seems to be putting in a base around 295. I suggested in my early May article that the bearish engulfing candle on May 1 (after making a new all-time high) might lead to some healthy profit-taking, retrenchment, and testing of support levels, which is what happened. And then in early June, I showed a huge bullish engulfing candle on the weekly chart, along with the upward-pointing oscillators, which suggested to me an imminent run at the all-time highs, which is what happened. This time around, however, the direction is not quite so clear. Although MACD is looking a little toppy, the other oscillators I follow, RSI and Slow Stochastic, could still head a little higher before cycling back down. Also, price seems to be forming a series of bull flag continuation patterns, as shown. On the other hand, Thursday’s market action printed a bearish “hanging man” candlestick, and the weekly chart (not shown) is also looking toppy and overbought. Support levels reside at the gap fill level of 293, then prior support at 290, followed by the 50-day simple moving average around 289. Notably, the small cap Russell 2000 looks a good bit weaker than SPY but seems to be forming a base at 154 (and it successfully tested support at the 20-day SMA on Thursday).
Latest Sector Rankings:
Relative sector rankings are based on our proprietary SectorCast model, which builds a composite profile of each of nearly 500 equity ETFs based on bottom-up aggregate scoring of the constituent stocks. The Outlook Score employs a forward-looking, fundamentals-based multifactor algorithm considering forward valuation, historical and projected earnings growth, the dynamics of Wall Street analysts’ consensus earnings estimates and recent revisions (up or down), quality and sustainability of reported earnings, and various return ratios. It helps us predict relative performance over the next 2-6 months.
In addition, SectorCast computes a Bull Score and Bear Score for each ETF based on recent price behavior of the constituent stocks on particularly strong and weak market days. A high Bull score indicates that stocks within the ETF recently have tended toward relative outperformance when the market is strong, while a high Bear score indicates that stocks within the ETF have tended to hold up relatively well (i.e., safe havens) when the market is weak.
Outlook score is forward-looking while Bull and Bear are backward-looking. As a group, these three scores can be helpful for positioning a portfolio for a given set of anticipated market conditions. Of course, each ETF holds a unique portfolio of stocks and position weights, so the sectors represented will score differently depending upon which set of ETFs is used. We use the iShares that represent the ten major U.S. business sectors: Financial (IYF), Technology (IYW), Industrial (IYJ), Healthcare (IYH), Consumer Goods (IYK), Consumer Services (IYC), Energy (IYE), Basic Materials (IYM), Telecommunications (IYZ), and Utilities (IDU). Whereas the Select Sector SPDRs only contain stocks from the S&P 500 large cap index, I prefer the iShares for their larger universe and broader diversity.
Here are some of my observations on this week’s scores:
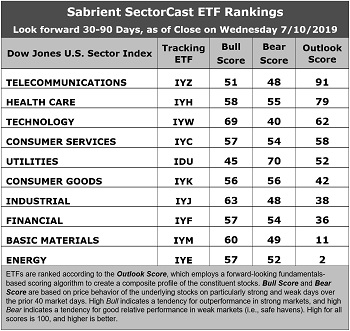
1. Telecom stays in the top spot with a robust Outlook score of 91. (It is worth noting that nearly 50% of the IYZ ETF is made up of just two stocks: CSCO and VZ.) It displays the lowest forward P/E of 14.7x, pretty good sell-side analyst sentiment (net revisions to EPS estimates), and solid return ratios. However, its pure GARP metrics are only average, with projected year-over-year EPS growth rate of 7.4% and a forward PEG ratio (forward P/E divided by projected EPS growth rate) of 2.00, which ranks it tied (with Basic Materials) for 7th out of 10 sectors on PEG, ahead of only fellow defensive sectors Utilities and Consumer Goods (Staples/Noncyclical), which is why we don’t see many Telecoms as candidates for Sabrient’s GARP portfolios (which have a 12-24 month outlook rather than 2-6 months used in SectorCast). Healthcare takes second with an Outlook score of 79, as it displays the best (albeit neutral) sell-side analyst sentiment (given that many sectors continue to show net negative revisions), and solid return ratios. Technology has moved back up to take third with an Outlook score of 62, as it displays reasonable sell-side analyst sentiment, a strong projected EPS growth rate of 13.9%, solid return ratios, and a forward PEG of 1.51. Rounding out the top six are Consumer Services (Discretionary/Cyclical), Utilities, and Consumer Goods (Staples/Noncyclical).
2. At the bottom of the rankings we distressingly find four cyclical sectors: Energy, Materials, Financial, and Industrial, primarily because these sectors have seen the largest net reductions to their earnings estimates from the sell-side analyst community. It is possible that this reflects late-coming EPS downward revisions from the analyst community that investors have already priced in. Notably, Energy still displays the best projected year-over-year EPS growth rate of 15.2%, and Financial is pretty good, as well, at 12.0%.
3. Looking at the Bull scores, Technology enjoys the top score of 69, followed by Industrial at 63, as stocks within these sectors have displayed relative strength on strong market days. Defensive sector Utilities scores the lowest at 45. The top-bottom spread is a healthy 24 points, which reflects low sector correlations on strong market days. It is desirable in a healthy market to see low correlations reflected in a top-bottom spread of at least 20 points, which indicates that investors have clear preferences in the market segments and stocks they want to hold (rather than broad risk-on behavior).
4. Looking at the Bear scores, as usual we find defensive sector Utilities alone in the top spot with a score of 70, followed by Consumer Goods (Staples/Noncyclical) at 56, which means that stocks within these sectors have been the preferred safe havens lately on weak market days. Technology has the lowest score of 40, as investors have fled during recent market weakness. The top-bottom spread is 30 points, which reflects quite low sector correlations on weak market days. Ideally, certain sectors will hold up relatively well while others are selling off (rather than broad risk-off behavior), so it is desirable in a healthy market to see low correlations reflected in a top-bottom spread of at least 20 points.
5. Healthcare displays the best all-around combination of Outlook/Bull/Bear scores, followed by Telecom, while Energy is the worst. Looking at just the Bull/Bear combination, Utilities is the best (due to its ultra-high Bear score), followed by Healthcare. Note that Healthcare shows better balance between its Bull and Bear scores, indicating superior relative performance (on average) in extreme market conditions (whether bullish or bearish). Telecom scores the worst.
6. I would say this week’s fundamentals-based Outlook rankings reflect a mostly neutral bias, given that the bottom of the rankings is populated by four cyclical sectors (which is troubling) but defensive sectors Utilities and Consumer Goods don’t score high enough to make it look overly defensive. We’ll have to watch how this trend develops. Keep in mind, the Outlook Rank does not include timing, momentum, or relative strength factors, but rather reflects the consensus fundamental expectations at a given point in time for individual stocks, aggregated by sector.
ETF Trading Ideas:
Our Sector Rotation model, which appropriately weights Outlook, Bull, and Bear scores in accordance with the overall market’s prevailing trend (bullish, neutral, or defensive), still displays a bullish bias and suggests holding Technology (IYW), Healthcare (IYH), and Industrial (IYJ), in that order. (Note: In this model, we consider the bias to be bullish from a rules-based trend-following standpoint when SPY is above both its 50-day and 200-day simple moving averages.)
Besides iShares’ IYW, IYH, and IYJ, other highly-ranked ETFs in our SectorCast model (which scores nearly 500 US-listed equity ETFs) from the Technology, Healthcare, and Industrial sectors include First Trust NASDAQ Technology Dividend Fund (TDIV), Virtus LifeSci Biotech Products (BBP), and US Global Jets (JETS).
If you prefer a neutral bias, the Sector Rotation model suggests holding Telecom, Healthcare, and Technology, in that order. On the other hand, if you are more comfortable with a defensive stance on the market, the model suggests holding Utilities, Healthcare, and Telecom, in that order.
An assortment of other interesting ETFs that are scoring well in our latest rankings include iShares Nasdaq Biotechnology (IBB), iShares Latin America 40 (ILF), SPDR S&P Pharmaceuticals (XPH), VanEck Vectors High Income MLP (YMLP), WBI BullBear Value 2000 (WBIB), Arrow QVM Equity Factor (QVM), ALPS Alerian MLP (AMLP), Forensic Accounting Long-Short (FLAG), WBI BullBear Rising Income 2000 (WBIA), and iShares Global Healthcare (IXJ).
IMPORTANT NOTE: I post this information periodically as a free look inside some of our institutional research and as a source of some trading ideas for your own further investigation. It is not intended to be traded directly as a rules-based strategy in a real money portfolio. I am simply showing what a sector rotation model might suggest if a given portfolio was due for a rebalance, and I do not update the information on a regular schedule or on technical triggers. There are many ways for a client to trade such a strategy, including monthly or quarterly rebalancing, perhaps with interim adjustments to the bullish/neutral/defensive bias when warranted, but not necessarily on the days that I happen to post this article. The enhanced strategy seeks higher returns by employing individual stocks (or stock options) that are also highly ranked, but this introduces greater risks and volatility. I do not track performance of the ideas mentioned here as a managed portfolio.
Disclosure: At the time of this writing, the author held put options on the SPY and IWM.
Disclaimer: This newsletter is published solely for informational purposes and is not to be construed as advice or a recommendation to specific individuals. Individuals should take into account their personal financial circumstances in acting on any opinions, commentary, rankings, or stock selections provided by Sabrient Systems or its wholly-owned subsidiary Gradient Analytics. Sabrient makes no representations that the techniques used in its rankings or analysis will result in or guarantee profits in trading. Trading involves risk, including possible loss of principal and other losses, and past performance is no indication of future results.