Sector Detector: CPI disappoints, but there is hope ahead
 by Scott Martindale
President & CEO, Sabrient Systems LLC
The rally to kick off Q4 was most welcome, but it quickly petered out. We must acknowledge that macro conditions are still dicey, and no industry is showing leadership—not even the Energy industry, with oil prices surging and green energy getting a tailwind from the new IRA spending bill. The traditional 60/40 stock/bond portfolio could be in for its worst year ever as interest rates surge while stocks flounder. Only the dollar is strong, as the US dollar index has hit its highest level in 20 years.
On the one hand, some commentators believe that things always look darkest before the dawn, so perhaps a bottom is near, and it is time to begin accumulating good companies. Others say there needs to be one more leg down, to perhaps 3400 on the S&P 500 (and preferably with the VIX touching 40), before the buying opportunity arrives. Either is a near-term bullish perspective, which aligns with my view.
On the other hand, there are those who say that markets don’t clear out such massive distortions quite so quickly. So, after such a long period in which “buy the dip” has always paid off (for many traders, it has been so their entire adult life), things are different now, including no “Fed put” or the shadowy “Plunge Protection Team” to backstop the market. Indeed, they say that given the persistent inflation, central banks can no longer embolden speculators by jumping in quickly to cushion market risk—and so, we should be preparing ourselves for global economic restructuring, broad liquidation, and a long, wealth-destroying bear market. This is not my expectation.
The most important number these days is the CPI, and the September number came in at 8.2%, which was only slightly below August’s 8.3%. Of course, inflation is a lagging indicator, and new Fed monetary policy actions can take several months to show their impact, but the Fed’s hawkish jawboning indicates it has less fear of a “doing too much than too little,” which I disagree with as I discuss in today’s post. Although the Fed’s preferred PCE gauge isn’t released until 10/28, market consensus following the CPI print is now for a 75-bp rate hike on 11/2 followed by another 75-bp hike on 12/14, and then a final 25-50 bps in February before it ultimately pauses with the fed funds rate around 5% or so.
However, because the September CPI print (again, a lagging indicator) shows a flatline with some slowing in inflation, it bolsters my ongoing view that inflation is on the decline, the economy is slowing down fast, and the Fed ultimately will raise less than expected (perhaps even calling for pause to watch and reflect after a 75-bp hike on 11/2) because of the vulnerabilities of a hyper-financialized global economy to rapidly rising rates and an ultra-strong dollar. Even bearish Mike Wilson of Morgan Stanley believes the Fed will need to tone down its hawkish monetary policy as global US dollar liquidity is now in the "danger zone where bad stuff happens.” In effect, a strong dollar creates QT (quantitative tightening) of global monetary policy.
It all hinges on the trajectory of corporate earnings and interest rates, both of which are largely at the mercy of the trajectory of inflation, Fed monetary policy decisions, and the state of the economy (e.g., recession). I believe inflation and bond yields are in volatile topping patterns (including the recent "blow-off top" in the 10-year Treasury yield to over 4.0%). Supply chains are gradually recovering (albeit hindered by Russia’s war) and the Fed is creating demand destruction, recession, and a global investor desire for the safety and income of elevated Treasury yields. Also constraining the Fed’s ability to shrink its balance sheet is a world hungry for dollars (for forex transactions, reserves, and cross-border loans), a massive federal debt load, and the reality that a rising dollar is painful to other currencies by exacerbating inflationary pressures for our trading partners and anyone with dollar-denominated debt service.
The biggest risks of course are catastrophic escalation in the war, or untamed inflation coupled with a rapid withdrawal of liquidity…or the possibility that central banks’ disinflationary tools of yore are no longer effective. But if inflation and nominal yields continue to fall, real yields (nominal minus inflation) should follow, leading to a neutral Fed pivot, improving corporate profitability, rising earnings, and perhaps some multiple expansion on stock valuations (e.g., higher P/Es). I discuss all of this in today’s post.
We continue to suggest staying long but hedged (e.g., with leveraged inverse ETFs and index puts). For long positions, a heightened emphasis on quality is appropriate, with a balance between value/cyclicals/dividend payers and high-quality secular growers. Sabrient’s terminating Q3 2021 Baker’ Dozen shows a +6% active gross total return versus the S&P 500 through 10/14 (even without any Energy exposure), while the latest Q3 2022 Baker’s Dozen that launched on 7/20 already shows a +8% active return of (with 23% Energy exposure). Also, our latest Dividend portfolio is sporting a 5.5% yield.
By the way, if you are a financial advisor who uses a TAMP (like SMArtX or Envestnet, for example) and might be interested in adding one of Sabrient’s new index strategies to your portfolio mix, please reach out to me directly for discussion! We have 17 strategies to consider. I provide more detail below on 3 strategies that might be the most timely today.
Here is a link to a printable version of this post. In this periodic update, I provide a comprehensive market commentary, offer my technical analysis of the S&P 500 chart, review Sabrient’s latest fundamentals based SectorCast quant rankings of the ten US business sectors, and serve up some actionable ETF trading ideas. To summarize, our SectorCast rankings reflect a bullish bias, with the top 5 scorers being economically sensitive sectors. In addition, the technical picture shows the S&P 500 may have successfully tested critical support at its reliable 200-week moving average, although our sector rotation model remains in a defensive posture. Read on…
Market commentary:
No doubt, globalization expanded rapidly during times of peace and cooperation. But now, global manufacturing, logistics, offshoring, and just-in-time inventory management created underlying interdependencies and vulnerabilities recently laid bare by pandemic lockdowns and war. In addition, today’s global unrest was provoked by these lockdowns and broken supply chains, but also by the rising financialization of the world economy—with the US now effectively exporting inflation with a tightening monetary policy and the associated ultra-strong dollar. Thus, we are facing the most severe challenges to US global economic and military hegemony in decades, mostly from Russia and China.
Vladimir Putin is certainly trying to exploit these vulnerabilities. “You can't feed anyone with paper—you need food; and you can’t heat anyone’s home with these inflated capitalizations—you need energy,” Putin railed. This followed the Nord Stream gas pipelines going from stalled to sabotaged (as key infrastructure built during peaceful/cooperative times become tasty targets during times of war) while Putin annexed four regions in southeastern Ukraine and heightened the nuclear threat in response to his army’s growing failures. Meanwhile, the 23-country “OPEC+” group of oil exporting countries, which controls about half of global oil production, is set to slash output targets by 2 million bbls/day—its largest cut since the pandemic, further worsening energy prices. By the way, all 23 are developing countries, and most are non-democratic, authoritarian, or otherwise adversarial with the West who have happily watched the developed world flounder while they enjoy the windfall of surging prices.
People in Europe and the US aren’t very happy about the predicament we find ourselves in with surging energy costs. As JPMorgan Chase CEO Jamie Dimon opined, the Biden administration dropped the ball by not incentivizing domestic oil & gas production after Russia launched its invasion of Ukraine. “Obviously, America needs to play a real leadership role—America is the swing producer, not Saudi Arabia,” he asserted. I totally agree. The top five producing nations (in order) are the US, Saudi Arabia, Russia, Canada, and China. The US became the world's top crude oil producer in 2018. But due solely to proximity (and poor strategic planning), Europe became dependent on energy imports from an adversarial Russia (despite strong counsel against it from the Trump Administration).
Our current administration has been determined to wean us off fossil fuels even though the green energy technology is not yet ready to fully support our energy needs at all times (just look at California’s situation). So, it instead has chided our oil companies about perceived price-gouging at the fuel pump while drawing down our Strategic Petroleum Reserve and negotiating with hostile, autocratic regimes in places like Iran and Venezuela. Our president apparently even went hat-in-hand to Saudi Arabia to request a 1-month delay in curtailing production until after the election.
This country could be energy independent if we chose to incentivize rather than discourage domestic hydrocarbon production. We are burning the hydrocarbons anyway; they are just sourced at elevated prices from faraway places via environmentally unfriendly seagoing tankers. Why not produce the reserves we already have here, embrace the energy independence we need for economic stability and national security during these dangerous and uncertain times, and reduce the need for massive imports that enrich corrupt/adversarial dictators. After all, with the EU forsaking Russian gas, the US is set to become the world’s largest exporter of natural gas. We should ramp up domestic oil production as well.
As for the stock market, although we haven’t yet seen that final wash-out capitulation in which selling panic sets in and the VIX surges to 40, some market observers think we have seen a more gradual and orderly fall to positioning levels that could indicate that a bottom is in. The market is a forward-looking leading indicator, and sentiment among CEOs, investment managers, and individual investors sit at historic lows, which is bullish from a contrarian standpoint. Morgan Stanley tracks net leverage among hedge funds, a gauge of risk appetite that hit a 13-year low. And JP Morgan found that commodity trading advisors have positioning approaching a trough last seen during the Financial Crisis. Furthermore, according to Goldman Sachs, individual investors moved $89 billion into money market funds (the most since April 2020 pandemic) after opening their Q3 quarterly brokerage statements last week.
Again, bonds have not provided their traditional role as a safe haven, as stocks and bonds (and most other assets, other than the dollar) have been highly correlated to the downside this year, offering nowhere for investors to hide. But this might change soon. The 10-year Treasury note has been testing the 4.0% level while mortgage rates have topped 7%—the highest in 20 years, leading many homebuilders to offload inventory to institutional investors for rentals. So, although bond prices keep falling (and yields keep rising) in concert with stocks, there will come a time (perhaps quite soon) when investors can no longer pass up such juicy yields (the highest since 2010). Even bond gurus like Jeffrey Gundlach and Bill Gross have been buying. Falling yields in turn would give stocks more opportunity for multiple expansion. As Winston Churchill once said, “If you’re going through hell, keep going.”
Regardless, the so-called “bond vigilantes” have been back in force over the past several weeks. UK 30-year bonds endured a 50% drawdown that demanded intervention after the new UK administration under PM Liz Truss announced it would abolish the highest (45%) income tax bracket (intended to stimulate investment in the economy) while implementing massive new spending (“helicopter money”) to offset surging natural gas and electricity prices. As a result, the new administration had to make an embarrassing 180-degree turn. It appears that not even the grand, old UK can tolerate elevated default risk in assets expected to be risk-free. Meanwhile, the Bank of Japan (BOJ) intervened to buy yen for the first time since 1998 (while also printing more yen to pay for it, in its circular logic).
Even here in the US, IG corporate spreads are climbing and the 10-year Treasury note has surged since 8/1 from a low of 2.52% to a high of 4.08% last Thursday…but has pulled back to under 4.0% on the stock market reversal (because, in case you need a reminder, stocks and bonds remain highly correlated these days!). It closed last week at 4.01%. Meanwhile, 30-year mortgage rates have topped 7%—their highest in 20 years).
According to the Bank of America Global Fund Manager Survey in mid-September, 62% were overweight cash with an average cash balance of 6.1%—the highest since October 2001, following the 9/11 attack—and a risk appetite on par with March 2020 (the pandemic low). The bank labeled sentiment “super bearish,” which again is typically a bullish setup from a contrarian standpoint. So, with recession likely and knowing that capital markets are forward discounting (i.e., already pricing in expected Fed rate hikes), it seems that idle cash will soon flow into bonds, lowering yields. And if bond yields continue to fall as I expect, coupled with general optimism for a Fed pivot and rising earnings, there may be room for multiple expansion in stock valuations to perhaps 17x or so by year end.
Inflation and suppy chains:
After the August Consumer Price Index (CPI) came in hotter than expected at 8.3% YoY, some commentators asserted that inflation has become embedded in the economy and that current readings for food and shelter correlate with prior periods of structural inflation. They say the Fed’s only solution is harsh monetary policy that drives us into deep recession, and, historically, the fed funds rate must go above the inflation rate to get such inflation under control. The September CPI reading on 10/13 also came in above expectations at 8.2%, but it reflects stability and indeed a slight reduction thanks to the energy component (which fell 2.1% after falling 5.0% in August). Shelter, food, and medical care were the main culprits in keeping CPI from falling further.
What has mainly spooked the market has been the continued increase in core inflation. After falling in April, May, and June, from 6.5% to 5.9%, it has risen in August and September, clocking in now at 6.6%, which is the highest since 1982. However, it continues to be driven mostly by shelter costs (including both rent and owner-equivalent rent), which are just now starting to stabilize (or even recede) as rising mortgage rates and recession fears quell demand. Because CPI is a lagging indicator, this dynamic in the housing market is yet reflected but should begin to show up in future CPI prints.
As for the Producer Price Index (PPI), after falling MoM in July and August, September PPI rose MoM by +0.4%. However, on a YoY basis, it fell once again with a final demand reading of 8.5% (versus 8.7% in August, and a peak of 11.7% in March). Core PPI (less food & energy) remained at 7.2% from August, which maintains the downward trend from the March peak of 9.6%. So, overall, both broad and core PPI seem to remain on a downward trend (albeit volatile, on a month-to-month basis).
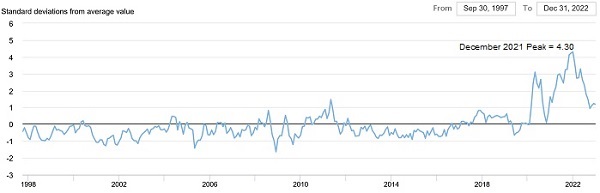
However, key prices like oil, commodities, and transportation have fallen precipitously, and wage growth is showing signs of slowing. The New York Fed’s Global Supply Chain Pressure Index (GSCPI) has been falling rapidly, as shown in the chart below, from a December high of +4.30 to the September reading of +1.05 (number of standard deviations from the average value, aka Z-score). Note that for most large data sets of any kind, it is rare to see a Z-score fall outside the range of -3 to +3, so the December high reflected notably extreme pressures on supply chains, which are coming down fast.
The Baltic Freight Index has fallen in similar fashion, having fallen 70% over the past 12 months. Also, ISM Manufacturing Index declined to 50.9 in September, the new orders index fell back into contraction territory at 47.1 in September, the lowest reading since the early days of the COVID pandemic in 2020. This gives US factories time to catch up on backlog and likely pause on new hiring. In addition, the prices index fell for the sixth straight month, which is yet another indicator that inflation may have peaked.
Nevertheless, there are some cautionary tales, such as the massive spike in Mississippi River barge prices to ship critical goods like steel, aluminum, fertilizers, and agricultural products (including grain, which represents 20% of world exports). The problem is low water levels due to drought, leading to draft restrictions on barges and a massive backup. Thus, companies are resorting to paying a premium to use rail and truck, despite costing as much as 5x. As one expert said in a news article, “One 15-barge tow has the same freight capacity as 940 semi-trucks.”
My view is that artificially disrupted supply chains are a key differentiator today versus previous periods of high inflation when we had much less globalization of the supply chain—which includes manufacturing, transportation, logistics, energy, and labor. Moreover, we have seen vast “financialization” of the global economy. As Eric Peters of One River Asset Management wrote, “…financiers pulled prosperity from the future by hyper-financializing our economies. In the pursuit of maximum profit, we blindly abandoned redundancy, accepted fragility.” So, rather than normal economic forces creating supply/demand imbalances, consumer demand quickly snapped back to pre-pandemic levels thanks to governmental monetary and fiscal largesse, while supply was constrained by supply chains hobbled or destroyed by forced lockdowns and war. Even Fed chair Powell has acknowledged this. So, to close the gaping excess demand gap, aggregate demand simply had to be depressed enough to buy time for supply chains to gradually mend—and both are happening.
The Fed has been unequivocal in its intention to tamp down inflation at any cost (even if it means a recession, rising unemployment, and a weaker stock market). Interestingly, as supply chains have generally improved, the inflationary pressures are now shifting from the goods to the services side. So, the FOMC’s focus has shifted to the labor market and wage inflation pressures. The FOMC believes job openings and quit rates must decline before there can be a meaningful reduction in wage and price inflation.
Despite the surge in yields since August 1, I think it is mainly driven by the Fed’s fear-inducing jawboning. And as I keep harping, inflation is a lagging indicator. Thus, I continue to believe both inflation and bond yields are in the midst of volatile topping patterns, which means both should soon fall, lowering the discount rate on long-duration growth stocks, ultimately leading to rising equity prices. The only question is timing. For the moment, Powell has been mercilessly “talking up” bond yields, while implying there would be no protective “Fed put” to support the economy or stock prices.
Strong dollar, money supply, corporate earnings, productivity:
Most commentaries I hear in the media these days about Fed monetary policy is related to the direction of our CPI, PPI, and PCE. However, I hear less about the global impacts of the ultra-strong US dollar and almost nothing about money supply. The Fed must ensure a sufficient global supply of dollars in a world hungry for them—given that 85% of foreign exchange transactions, 60% of foreign exchange reserves, and 50% of cross-border loans and international debt are in US dollars. This limits the Fed’s flexibility to shrink its balance sheet.
Moreover, in today’s highly globalized economy (even though efforts are being made to onshore key processes), the Fed cannot expect its policies to only impact our own domestic supply/demand dynamics. Hawkish US monetary policy diverges from the accommodative policies in Japan and China and massive fiscal intervention in the EU and UK. As a recent Bloomberg headline said, “The US is Exporting Inflation, and Fed Hikes Will Make It Worse.”
With near 4% yields on short-duration Treasury bonds, stronger economic growth than most countries, and stable markets, foreign reverses flowed into the safety and liquidity of the U.S. dollar. As a result, the USD is the strongest it’s been in 20 years relative to other currencies as the Fed’s aggressive interest rate hikes have made the dollar even more attractive to hold. You might think that inflation is bad here, but the combined impact of supply shortages and currency devaluation for most of our trading partners and emerging markets has been devastating. The WSJ wrote a story about cargo shipowners canceling sailings, with shipping rates plunging 75% YoY, as big retailers try to cut their bloated inventories, illustrating rapid demand destruction and a collapse in consumer spending. Moreover, the IMF is forecasting more than 1/3 of the global economy will contract in 2023—including in the US, EU, and China.
We are seeing more and more dissension, upheaval, and emigration in developed and developing nations alike as they grapple with their weakening currencies and economies. But the Fed seems blind to it. And as poverty and desperation have worsened in nations to our south, coupled with our federal government’s de facto open-door immigration policy, do you think perhaps this has exacerbated our border crisis? Back in 2000, I would take my family once or twice a year to Mexico. The exchange rate at that time was around 10 pesos to 1 dollar. Today, it takes more than 20 pesos to buy a dollar. This is yet another reason why the FOMC soon may be forced to accept an inflation rate higher than their 2% target, restrain its QT, and try to weaken the dollar.
Financialization also means that rising rates could cripple debt-addicted businesses and governments (including our own!), and the housing market (which is critical for a healthy consumer) depends upon moderate mortgage rates (not today’s 7% rates!). And as the dollar further strengthens, some emerging market economies with dollar-denominated debt may be forced to default. In other words, today’s financial system simply can’t handle much higher rates – which suggests the Fed already may be beyond the “neutral rate” and will ultimately have to live with elevated inflation.
Another reason it is difficult for rates to go much higher is because of the levels of federal debt. We have a gross federal debt that has surpassed $31 trillion, which is 123% of our $25.2 trillion GDP. $25 trillion is public debt (i.e., owed to creditors outside of federal trust funds and government accounts). So, US public debt has reached 100% of GDP(!), and is rapidly approaching the record 106% of GDP in the wake of WWII. The interest payment on that debt is currently around $680 billion annually, which is bad enough, amounting to about 12.7% of the federal budget—although with the budget projected to expand during FY 2022 to $5.9 trillion (and a budget deficit of $1.1 trillion) and with interest rates on Treasuries rising, debt and interest payments will be rising, as will the percentage of the budget spent on debt service. I have written in the past about higher debt-to-GDP ratios not being an issue because of the historically low debt carrying costs—but that no longer applies given this year’s spike in interest rates.
So, to keep the dollar from getting any stronger than it already is, the Fed may have to participate in a coordinated global monetary policy, ease up on its inflation focus, pause on further rate hikes, and start printing more dollars (and perhaps even buy foreign sovereign debt) in order to weaken the US dollar and bolster other major currencies. Perhaps this is why the Fed has been relying so much on tough talk while avoiding talking about M2 money supply—so that it wouldn’t have to reduce its balance sheet so much.
Speaking of the Fed balance sheet, QE meant years of buying Treasuries at much lower yields (and much higher prices) than today. So, besides not offsetting its outgoing payments on higher-yielding new debt issued to fund the government, further selling of existing bond holdings at a capital loss through QT (rather than waiting for them to mature and roll off the balance sheet) could lead to the Fed’s first calendar-year operating loss since 1915. Perhaps this is another reason why Powell is reticent to talk about money supply.
As for corporate earnings and profit margins, analysts forecast 2.4% EPS growth in Q3 for S&P 500 companies, according to FactSet, although Energy is the only sector that recorded an increase in its bottom-up EPS estimate for Q3 2022 during the quarter, at +7.9%. Despite higher producer prices and falling labor force productivity, average S&P 500 profit margin is 12.3%, which is down only slightly from last year’s impressive 12.7%. However, the narrowing gap between PPI and CPI might suggest some margin compression ahead. Productivity fell 7.4% in Q1 and 4.1% in Q2. On 11/3, the BLS will release the preliminary productivity data for the Q3.
Businesses can either pass along rising labor costs to their customers by increasing prices or absorb the higher labor costs and decrease their profitability. They have been choosing the first option, which has further contributed to soaring inflation. Regardless, unit labor costs rose 10.2% in Q2 following a 12.7% surge in Q1, as businesses have been hiring less-productive workers at higher wages. In response to falling productivity, both the US and China are heavily investing in workplace automation to reduce costs, improve efficiency. Both countries’ population growths are in structural decline (despite our border crisis and influx of unskilled labor), which means productivity improvement is critical to growing our economies.
Active selection should outperform passive indexes:
Overall, in spite of today’s precarious macro climate—including elevated inflation, interest rates, and energy prices; war in Europe, disrupted supply chains, and supply/demand imbalances; continued COVID lockdowns and slowing growth in China; massive global debt and uncertain Federal Reserve policies; not to mention imminent midterm elections amid a hyper-polarized and suspicious society—Sabrient continues to suggest investors stay long but hedged, with a heightened emphasis on quality and a balance between value/cyclicals/dividend payers and high-quality secular growers.
However, the passive, broad-market, mega-cap-dominated indexes that have been so hard for active managers to beat in the past, might not be the best place to park your funds today. After all, Warren Buffett’s favorite indicator, the ratio of total market capitalization to GDP, sits at about 2.4x, which—although down from the recent all-time high of 2.7x—is still near historical highs and well above the 2.1x level during the dot-com bubble of 2000.
S&P 500 companies generate on average 40% of their revenues from international sales. Because of the strong correlation between GDP, corporate earnings, and equity valuations, the strong US dollar creates the double-whammy of global recession and crimping multinational companies’ revenues (through both lower sales and squeezed profit margins). So, it appears likely that returns for the passive, cap-weighted market indexes like the S&P 500 and Nasdaq 100 may be less than inspiring over the coming quarters, and the time may be ripe for active strategies that can exploit the performance dispersion among individual stocks.
On that note, Sabrient’s new portfolios—including Q3 2022 Baker’s Dozen, Forward Looking Value 10, Small Cap Growth 35, and Dividend 41 (sporting a 5.5% yield!)—leverage our enhanced model-driven selection approach (which combines Quality, Value, and Growth factors) to provide exposure to both the longer-term secular growth trends and the shorter-term cyclical growth and value-based opportunities. By the way, all reflect an overweight allocation to the Energy sector. These are the final days to get into the Q3 2022 Baker’s Dozen, as the new Q4 2022 portfolio launches on 10/20 (with 4 Energy names).
Notably, the Energy Select Sector SPDR (XLE) still sports a single-digit forward P/E of only 8.0x—leading some investors to acquire certain public oil companies and take them private, like Continental Resources (CLR) announced today.
Sabrient’s new indexes:
I mentioned at the outset that if you are a financial advisor who uses a TAMP (like SMArtX or Envestnet, for example), you might be interested in adding one of Sabrient’s 17 new index strategies to your portfolio mix. Below is a brief update for 2022 YTD through September on what we believe are the 3 most timely of Sabrient’s 17 index strategies:
1. Sabrient Armageddon Index was designed to address a growing investor desire for an alternative defensive, low-beta, all-equity portfolio that can minimize losses during economic distress, market dislocation, and tumultuous/volatile conditions (like we have now!) while also offering reasonable upside during normal or bullish market conditions. The rules-based model searches a narrow universe of defensive/all-weather industries like Food/Tobacco, Gold/Mining, Household/Personal, Pharma, Telecom, and Utilities. YTD through 9/30, the 50-stock portfolio shows an active return of +13.1% versus the S&P 500 while also outperforming comparable defensive ETFs.
2. Sabrient Quality Growth Plus Income Index is one of our 10-index Sabrient Quality Index Series that seems particularly timely given the Fed’s evolving policies and the market income-paying strategies. We think of it as an “all-weather” hybrid product that combines capital appreciation potential with a robust dividend yield. YTD through 9/30, the 25-stock portfolio shows an active return of +25.5% versus the S&P 500, while also outperforming various comparable dividend-paying ETFs. Current yield as of the 8/15 rebalance is a robust 5.2%.
3. Sabrient Space Exploration & Sustainability Index leverages our founder’s NASA Apollo 11 background). Our reasoning for combining space with sustainability is based upon putting human settlements on space stations, the moon, or other planets, which would require advances in both technologies. YTD through 9/30, the 30-stock portfolio shows an active return of +12.2% versus the S&P 500 while also outperforming comparable space-themed ETFs.
Regardless of how the market proceeds from here, these three themes seem timely. Again, let me know if you have an interest in accessing them through a TAMP.
SPY Chart Review:
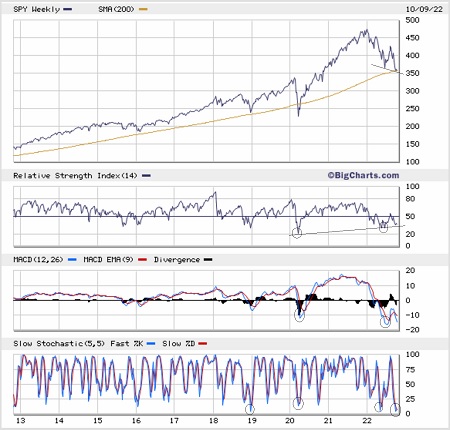
The SPDR S&P 500 Trust (SPY) closed Friday at 357.63 after setting a new 52-week low (actually, the lowest since Q4 2020) just the day prior in a huge capitulation/reversal day. Some are calling last Thursday a market bottom, but that remains to be seen. The main thing I want to point on the weekly chart below is the 200-week simple moving average, which for the past decade has served as solid support (other than a very brief moment during the pandemic selloff when it was violated, but quickly recovered). It served as strong support last week, so we will need to see what happens during this notorious month of October, particularly as Q3 earnings reports and forward guidance are released. I have also pointed out some of the prior extreme lows for RSI, MACD, and Slow Stochastics oscillators, which all led to solid recoveries. Each once again hit extreme lows last week, although you can see the positive divergence in RSI (higher lows) versus the lower low in price, which is bullish.
Latest Sector Rankings:
Relative sector rankings are based on our proprietary SectorCast model, which builds a composite profile of each of over 900 equity ETFs based on bottom-up aggregate scoring of the constituent stocks. The Outlook Score employs a forward-looking, fundamentals-based multifactor algorithm considering forward valuation, historical and projected earnings growth, the dynamics of Wall Street analysts’ consensus earnings estimates and recent revisions (up or down), quality and sustainability of reported earnings, and various return ratios. It helps us predict relative performance over the next 2-6 months.
In addition, SectorCast computes a Bull Score and Bear Score for each ETF based on recent price behavior of the constituent stocks on particularly strong and weak market days. A high Bull score indicates that stocks within the ETF recently have tended toward relative outperformance when the market is strong, while a high Bear score indicates that stocks within the ETF have tended to hold up relatively well (i.e., safe havens) when the market is weak.
Outlook score is forward-looking while Bull and Bear are backward-looking. As a group, these three scores can be helpful for positioning a portfolio for a given set of anticipated market conditions. Of course, each ETF holds a unique portfolio of stocks and position weights, so the sectors represented will score differently depending upon which set of ETFs is used. We use the iShares that represent the ten major U.S. business sectors: Financials (IYF), Technology (IYW), Industrials (IYJ), Healthcare (IYH), Consumer Staples (IYK), Consumer Discretionary (IYC), Energy (IYE), Basic Materials (IYM), Telecommunications (IYZ), and Utilities (IDU). Whereas the Select Sector SPDRs only contain stocks from the S&P 500 large cap index, I prefer the iShares for their larger universe and broader diversity.
Here are some of my observations on this week’s scores:
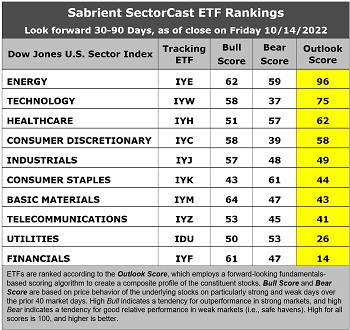
1. The rankings are led by Energy, with an Outlook scores of 96 and 75. Energy in particular scores extraordinarily well in the model as it is the only sector getting net positive analyst sentiment (recent net revisions to EPS estimates), the lowest forward P/E of 8.0x, good YoY projected EPS growth rate of 10.3%, the lowest forward PEG (forward P/E divided by projected EPS growth rate) of 0.78, and reasonable insider sentiment (open market buying). Technology comes in a distant second, with relatively good analyst sentiment, a solid YoY projected EPS growth of 14.8%, a forward PEG of 1.31, and good insider sentiment. Rounding out the top five are Healthcare, Consumer Discretionary, and Industrials.
2. At the bottom are Financials and Utilities with Outlook scores of 14 and 26, respectively. Financials has a low forward P/E of 10.8x, but otherwise it scores low across other factors, including a YoY projected EPS growth rate of only 8.5%. Utilities has a low (but stable) projected EPS growth rate of only 7.5%, yet it has been bid up to a high forward P/E of 18.6x by income-seeking investors for its 2.46% dividend yield, which makes it popular as a bond alternative, and it has a high forward PEG of 2.49.
3. Looking at the Bull scores, Basic Materials has the top score of 64, followed by Energy at 62, as stocks within these sectors have displayed relative strength on strong market days. Consumer Staples scores the lowest at 43. The top-bottom spread is 21 points, which reflects low sector correlations on strong market days. It is desirable in a healthy market to see low correlations reflected in a top-bottom spread of at least 20 points, which indicates that investors have clear preferences in the market segments and stocks they want to hold.
4. Looking at the Bear scores, Consumer Staples scores the highest at 61, followed by Energy at 59, as stocks within these sectors have been the preferred safe havens on weak market days. Technology displays the lowest score of 37, as investors have fled the sector during market weakness. The top-bottom spread is 24 points, which reflects low sector correlations on weak market days. Ideally, certain sectors will hold up relatively well while others are selling off (rather than broad risk-off behavior), so it is desirable in a healthy market to see low correlations reflected in a top-bottom spread of at least 20 points.
5. Energy displays by far the best all-around combination of Outlook/Bull/Bear scores, while Financials is the worst. Looking at just the Bull/Bear combination (investor sentiment indicator), Energy has the top score followed by Basic Materials, indicating superior and consistent relative performance (on average) in extreme market conditions whether bullish or bearish, while Technology is the worst.
6. This week’s fundamentals-based Outlook rankings continue to display a bullish bias given that the top 5 sectors are all economically sensitive or cyclical or “all weather,” while the defensive sectors are all in the bottom 5. The poor score for Financials is the main “fly in the ointment.” Keep in mind, the Outlook Rank does not include timing, momentum, or relative strength factors, but rather reflects the consensus fundamental expectations at a given point in time for individual stocks, aggregated by sector.
ETF Trading Ideas:
Our Sector Rotation model, which appropriately weights Outlook, Bull, and Bear scores in accordance with the overall market’s prevailing trend (bullish, neutral, or defensive), is in a defensive posture. This suggests holding Energy (IYE), Consumer Staples (IYK), and Healthcare (IYH), in that order. (Note: In this model, we consider the bias to be defensive from a rules-based trend-following standpoint when SPY is below both its 50-day and 200-day simple moving averages.)
If you prefer a neutral bias, the Sector Rotation model suggests holding Energy, Technology (IYW), and Healthcare, in that order. Or, if you are more aggressively pursuing a bullish stance, the model suggests holding Energy, Basic Materials (IYM), and Technology, in that order.
An assortment of other interesting ETFs that are scoring well in our latest rankings include: Invesco DWA Energy Momentum (PXI), iShares US Oil & Gas Exploration & Production (IEO), First Trust Energy AlphaDEX (FXN), First Trust Natural Gas (FCG), Pacer US Small Cap Cash Cows 100 (CALF), iShares US Home Construction (ITB), Invesco S&P 500 Equal Weight Energy (RYE), Innovator IBD 50 (FFTY), First Trust Indxx Global Agriculture (FTAG), QRAFT AI-Enhanced US Large Cap Momentum (AMOM), Invesco Select Growth (IVSG), Invesco DWA SmallCap Momentum (DWAS), Innovator Breakout Opportunities (BOUT), UBC Algorithmic Fundamentals (UBCB), iShares MSCI Global Energy Producers (FILL), AdvisorShares Dorsey Wright Micro-Cap (DWMC), Alpha Architect US Quantitative Value (QVAL), Invesco Dynamic Networking (PXQ), Fount Metaverse (MTVR), Grizzle Growth (GRZZ), Invesco Dynamic Building & Construction (PKB), WBI BullBear Quality 3000 (WBIL), First Trust Expanded Technology (XPND), ProShares Global Listed Private Equity (PEX), and First Trust Indxx Global Natural Resources Income (FTRI). All score in the top decile (90-100) of Outlook scores.
As always, I welcome your thoughts on this article! Please email me anytime. Any and all feedback is appreciated! In particular, please tell me what sections you find the most valuable – commentary, chart analysis, SectorCast scores, or ETF trading ideas / sector rotation model.
IMPORTANT NOTE: I post this information periodically as a free look inside some of our institutional research and as a source of some trading ideas for your own further investigation. It is not intended to be traded directly as a rules-based strategy in a real money portfolio. I am simply showing what a sector rotation model might suggest if a given portfolio was due for a rebalance, and I do not update the information on a regular schedule or on technical triggers. There are many ways for a client to trade such a strategy, including monthly or quarterly rebalancing, perhaps with interim adjustments to the bullish/neutral/defensive bias when warranted, but not necessarily on the days that I happen to post this article. The enhanced strategy seeks higher returns by employing individual stocks (or stock options) that are also highly ranked, but this introduces greater risks and volatility. I do not track performance of the ideas mentioned here as a managed portfolio.
Disclosure: At the time of this writing, the author held no positions in any of the securities mentioned.
Disclaimer: Opinions expressed are the author’s alone and do not necessarily reflect the views of Sabrient. This newsletter is published solely for informational purposes and is not to be construed as advice or a recommendation to specific individuals. Individuals should take into account their personal financial circumstances in acting on any opinions, commentary, rankings, or stock selections provided by Sabrient Systems or its wholly owned subsidiary, Gradient Analytics. Sabrient makes no representations that the techniques used in its rankings or analysis will result in or guarantee profits in trading. Trading involves risk, including possible loss of principal and other losses, and past performance is no indication of future results.