Sector Detector: Strong earnings growth is expected...and crucial to justifying equity valuations
 by Scott Martindale
President & CEO, Sabrient Systems LLC
After a strong Q1, stocks continue to rise on exuberant optimism, and the mega-cap dominated S&P 500 and Nasdaq 100 just hit new highs this week. Notably, the Tech sector significantly lagged the broader market during the second half of Q1, primarily due to worries about the apparent spike in inflation and a surge in the 10-year Treasury yield (as a higher discount rate on future earnings has greater implications for longer duration growth stocks). But once the rapid rise in yield leveled off, Tech caught a bid once again. The Russell 2000 small cap index, after absolutely crushing all others from November through mid-March, has been cooling its jets for the past several weeks. I think the other indexes will need to do the same. In the short term, after going straight up over the past two weeks, the S&P 500 and Nasdaq 100 both look like they need to pause for some technical consolidation, but longer term look pretty darn good for solid upside – so long as earnings reports surprise solidly higher than the already strong predictions, and Q1 earnings season is now at hand.
Regular readers know I have been opining extensively about the bullish convergence of positive events including rapid vaccine rollout, reopening of the economy, massive fiscal and monetary stimulus/support, infrastructure spending, pent-up demand, strong revenue and earnings growth, and the start of a powerful and sustained recovery/expansionary economic phase – but with only a gradual rise in inflation and interest rates – in contrast with those who see the recent surge in inflation metrics and interest rates as the start of a continued escalation and perhaps impending disaster. Notably, in his annual letter to shareholders, JPMorgan CEO Jamie Dimon laid out a similar vision, referring to it as a “Goldilocks moment” leading to an economic boom that “could easily run into 2023.”
In my view, it was normal (and healthy) to see record low interest rates last summer given the economic shutdowns, and as the economy begins to reopen, interest rates are simply returning to pre-pandemic levels. Furthermore, relatively higher yields in the US attract global capital, and the Fed continues to pledge its support – indeed, I think it may even implement yield curve control (YCC) to help keep longer-term rates in check.
And as for inflation, the March CPI reading of 2.6% YOY sounds ominous, but it is mostly due to a low base period, i.e., falling prices at the depth of the pandemic selloff in March 2020, and this dynamic surely will continue over the coming months. Although we see pockets of inflation where there are production bottlenecks (e.g., from shutdowns or disrupted supply chains), it seems that massive stimulus has created asset inflation but little impact on aggregate demand and consumer prices, as personal savings rates remain high and the recent stimulus programs have mainly gone to paying bills, putting people back to work, and building up personal investment accounts. Future spending bills targeting infrastructure or green energy might have a greater impact, but for now, the huge supply of money in circulation is largely offset by disinflationary drivers like low velocity of money, aging demographics, re-globalization of trade and supply chains, and technological disruption. The Treasury market seems to be acknowledging this, as the rapid rise in the 10-year yield has leveled off at around 1.7%.
Thus, I believe that growth stocks, and in particular the Technology sector, must remain a part of every portfolio, even in this nascent expansionary economic phase that should be highly favorable to value and cyclical sectors like Industrial, Financial, Materials, and Energy. Put simply, new technologies from these Tech companies can facilitate other companies from all sectors to be more efficient, productive, and competitive. However, investors must be selective with those secular growth favorites that sport high P/E multiples as they likely will need to “grow into” their current valuations through old-fashioned earnings growth rather than through further multiple expansion, which may limit their upside.
And with Sabrient’s enhanced selection process, we believe our portfolios – including the Q1 2021 Baker’s Dozen that launched on 1/20/21, Small Cap Growth portfolio that launched on 3/15/21, Sabrient Dividend portfolio that launched on 3/19/21, and the upcoming Q2 2021 Baker’s Dozen that launches next week on 4/20/21 – are positioned for any growth scenario.
In this periodic update, I provide a comprehensive market commentary, offer my technical analysis of the S&P 500 chart, review Sabrient’s latest fundamentals based SectorCast quant rankings of the ten US business sectors, and serve up some actionable ETF trading ideas. To summarize, our outlook is bullish (but with occasional bouts of volatility), our sector rankings reflect a solidly bullish bias, the technical picture is still long-term bullish (although in need of some near-term consolidation), and our sector rotation model retains its bullish posture. Read on….
Commentary:
The S&P 500 (SPY) was up +6.2% during Q1, while its equal weight counterpart (RSP) nearly doubled it at +11.5%, which illustrates the greater market breadth and leadership from smaller names. But so far in April, growth stocks and mega-caps have resurged, allowing SPY to outperform RSP. While rising rates tend to hinder the appeal of Tech stocks, banks and insurance companies tend to benefit, and indeed the Financial sector saw the most institutional buying during Q1. The top performing sectors were deep cyclicals Energy, Financial, Industrial, and Basic Materials, while the worst performers were Consumer Staples, Info Tech, and Utilities, although Utilities and Staples came on quite strong during March in concert with dividend strategies in general. According to S&P Global, the top factor strategies for the S&P 500 during Q1 were High Beta (+22.7%) and Pure Value (+21.0%), while Momentum (+0.2%) and Pure Growth (+0.8%) were the worst performers. Notably, it was the Value factor’s largest quarterly outperformance versus Growth in 20 years.
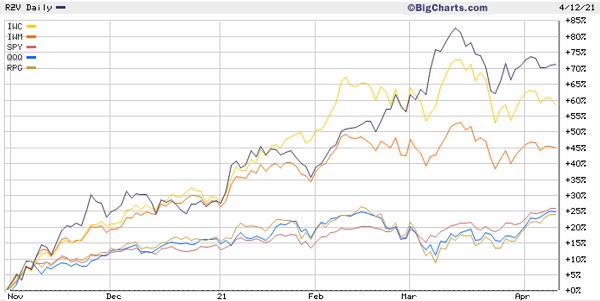
The chart below illustrates the performance differentials by comparing Invesco S&P SmallCap 600 Pure Value (RZV), iShares Russell 2000 (IWM), and iShares Micro-Cap (IWC) versus the Invesco S&P 500 Pure Growth (RPG), Invesco Nasdaq 100 (QQQ), and the SPY since the value rotation began on 11/1/2020. You can see that the growth and large-cap oriented SPY, QQQ, and RPG are bunched together at the bottom and have lagged badly but have outperformed so far in April. At the top are small cap value and micro caps.
Furthermore, in comparing factor-based strategies for the S&P 500, the High Beta factor has greatly outperformed all other factor-based strategies over the past 12 months since the start of the pandemic selloff recovery, followed by Pure Value. Also, Barclays pointed to a basket of high-debt stocks as the best performer YTD, while a basket of high-profitability stocks is the worst performing. Although it seems reminiscent of the 1998-9 dot-com bubble, in this case many of these highly leveraged firms are expected to thrive during the “reopening trade.”
This all serves to illustrate the risk-on market rotation that began in mid-May 2020 – and has surged since 11/1/2020 – favoring mid, small, and micro caps, the high-beta and value factors, and cyclical sectors. This euphemistically has been termed a “junk rally” given that many of these companies have not yet reported great numbers in their filings but are rallying in anticipation of a bullish convergence of positive events. No doubt, massive global fiscal and monetary stimulus/support has been crucial. In fact, the International Monetary Fund (IMF) estimates that without this government support during the pandemic, the global recession would have been 3x worse – but instead the COVID recession likely will have less lasting impact than the Great Financial Crisis (GFC) in 2008.
Recall that to address the GFC, Fed policy primarily served to recapitalize banks rather than to juice the economy. Without additional lending, the recovery was sluggish (a “plow horse economy,” as Brian Wesbury of First Trust has called it), so value stocks struggled while less capital- or labor-intensive growth companies thrived due to an ability to maximize productivity in the "jobless recovery.” This time, however, banks were already healthy, and stimulus has been specifically targeted at boosting economic activity.
Nevertheless, value and cyclical companies must now begin to justify their valuations with actual earnings growth, while displaying solid earnings quality, as well. (As you might already know, Sabrient’s wholly owned subsidiary Gradient Analytics specializes in the critical examination of financial statements to evaluate earnings quality and the aggressiveness of a firm’s accounting practices.) In addition, I expect to see M&A activity and general industry consolidation to boost efficiencies and return on capital, particularly in Energy and Financial sectors.
Strong tailwinds:
The economic tailwinds seem both powerful and durable, including a rapid emergence from the economic impacts of both the pandemic and the China trade war; a surge in corporate capex and manufacturing activity; “reflation” after 30 years of globalization and tech-induced disinflation; unlimited global liquidity and massive pro-cyclical fiscal and monetary stimulus here at home; low (and controlled) interest rates; low tax rates; rising (but still modest) inflation; and high cash balances (and pent-up demand) among both corporations and households (in fact, the Fed recently announced that U.S. household net wealth just reached a record $130.2 trillion).
AII data indicates that retail investors are more bullish than they have been over the past three years. Moreover, BofA recently reported that equity funds have attracted more than half a trillion dollars in the past five months, exceeding inflows recorded over the previous 12 years, which they termed a market "melt-up” that would suggest a severe correction is in store once it loses steam. However, with more stimulus and spending bills on the way to continue fueling the fire, there’s no telling when the correction may come.
DataTrek regularly monitors corporate bond spreads, and the firm reports that the trend has been quite encouraging. BBB and CCC credit spreads have tightened to near 5-year lows in a “dash for trash” or “junk rally,” as investors believe the Fed has their backs to pursue higher yields. Investment grade is back to post-pandemic lows and high yield is at fresh 2020/21 lows. The stall in rising 10-year Treasury yields also boosts demand for lower-quality, high-yield bonds. DataTrek believes this all further confirms stock market strength.
And then, of course, we enjoy the innovation, disruption, and productivity gains of many amazing and rapidly advancing technologies, which include 5G, IoT, Big Data, AI/ML, Web 3.0, cloud computing, ecommerce, digitization, video conferencing, augmented/virtual reality (AR/VR), computer vision (CV), gaming, networks, sensors, 3-D printing, robotics, sustainability, horizontal drilling & fracking, clean fuels, green/renewable energy, nuclear fusion, electric/hydrogen transportation, autonomous vehicles, automated manufacturing, space exploration, cybersecurity, blockchain, cryptocurrency, DeFi, fintech, nanotech, biotech, telehealth, precision medicine, computational biology, genomics, genetic sequencing, biologics – and the rapid development of diagnostics, therapeutics, and vaccines that may render future pandemics obsolete. Did I leave out anything?
When you consider the immense changes of the past 25 years, what might the next 25 years bring? “Shall we vacation on Mars again this year, dear?” It’s enough to make your head spin!
According to “techno-optimist” Peter Diamandis, this deluge of innovation in science, technology and medicine is leading to an era of unprecedented prosperity through productivity, disinflation, digitization, disruption, democratization (i.e., equal access to services), demonetization (i.e., cheap or free services), and dematerialization (i.e., fewer devices needed).
For example, genetic sequencing and biologics have led to rapid development of diagnostics, therapeutics, and vaccines. According to the CDC, unlike traditional vaccines that take years to develop by collecting actual virus samples and then placing a weakened or inactivated version into a person to trigger an immune response, the new “mRNA” (messenger ribonucleic acid) vaccines protect against infectious diseases by teaching our cells how to make a protein that triggers an immune response that produces antibodies. This new technology allows for rapid vaccine development that, along with strong logistical implementation, may ultimately render pandemics obsolete, according to some researchers. Genetic sequencing has advanced incredibly far in just the past few years.
As another example, look at the semiconductor industry. There are significant supply constraints in the industry affecting many sectors of the semiconductor market, particularly given surging demand. Just look at the automakers (including GM and Ford), who have had to shut down production facilities due to a chip shortage – and it’s due to get worse with growth in electric vehicle demand. Semiconductor firms are seeing rising sales prices and gross margins, allowing them to reinvest in capex to both increase capacity and develop the next generation of products. Foundries are running at full capacity, while faster, smaller, more powerful devices are being developed faster than ever to provide the tremendous processing power requirements of virtually all new technologies – including Web 3.0, the next-gen Internet technology that relies upon AI/ML, built with blockchain, and decentralized, so that no single Big Tech firm (with its own political motives) can control free speech. Moreover, you would have ownership of your personal data and prevent spoofing attacks.
GDP, inflation, and interest rates:
Following record-breaking US GDP growth of +33.4% (annualized) in Q3 2020 and +4.3% in Q4, both the Atlanta Fed’s GDPNow model and the New York Fed’s Nowcast are predicting 6.0% Q1 YOY growth (as of 4/9, with a new projection due out on 4/15), while the St. Louis Fed’s GDP Nowcast sees 8.2%. For its part, the Federal Reserve issued its own projections at its March 17 FOMC meeting, including increasing its 2021 GDP forecast to 6.5%, up from 4.2% previously estimated, which would be the strongest since 1984, and 4% for 2022. Similarly, the IMF raised its 2021 U.S. GDP forecast to 6.4%, up from 5.1%. The Fed also said the unemployment rate could fall to 4.5% by the end of the year, while inflation could rise to 2.2%, slightly above its inflation goal of 2%.
The European Central Bank (ECB) is now explicitly controlling interest rates across the term spectrum – i.e., yield curve control (YCC) – and the US is likely not far behind. The goal is to keep interest rates from becoming a burden on the economy while also targeting negative real rates (nominal rate minus inflation), similar to what the US did between 1945-1980. Also keeping a lid on US Treasury yields are their relatively higher levels compared to other developed nations, which attracts demand among global investors. Negative real rates and a falling dollar would be favorable for US equities and corporate bonds (both IG and HY) as well as cryptocurrencies (like bitcoin and ether), gold, and other commodities. In fact, given plans for major infrastructure and alternative energy programs, I think we are entering a “commodity supercycle,” which implies inflationary pressures. Moreover, many are pointing to the eye-popping rise in M2 money supply growth since the end of 2019 as further evidence of impending inflation.
But, as I discussed last month, the velocity of M2 money supply recently hit a record low, indicating little multiplier effect on the money being injected into the economy and thus little inflationary impact on consumer prices – although asset prices are another story entirely, as much of the liquidity has gone into securities, cryptocurrencies, and real assets. In addition, there are still many disinflationary factors in play like aging demographics, slowing global population growth, re-globalization of trade and supply chains, and technological disruption that can offset the inflationary drivers.
As for the US dollar, it has been largely inversely correlated with stocks, as it has been falling for the past year while stocks have risen. Although the dollar strengthened during March largely due to the quick rise in the 10-year Treasury yield, it has been falling again this month as yields have stalled. Long term, given the open spigot of Fed money-printing to finance de facto MMT, with no end in sight, the trend for the dollar is likely downward.
Unfortunately, abundant liquidity has led to gross profligacy and malinvestment. But sometimes the malinvestment isn’t in speculative “junk” companies but in highly leveraged concentrated positions in fundamentally sound companies. For example, several big banks like Credit Suisse, Nomura, Goldman Sachs, and Morgan Stanley all took a major hit after overleveraged family office Archegos Capital collapsed. Led by Tiger cub Bill Hwang, the firm leveraged $10 billion up to at least $50 billion – or perhaps much more due to the use of total return swaps – to gain exposure to concentrated positions in US and Chinese TMT (technology, media, telecom) stocks such as ViacomCBS, Discovery, Baidu, GSX Techedu, Shopify, and Farfetch. Credit Suisse seems to have been the hardest hit, taking a $4.7 billion writedown in Q1 and implementing more stringent margin requirements for those risky swaps, shifting from static margining to dynamic margining, i.e., more collateral from clients.
The financial system seems more leveraged today than ever as Fed policies have made borrowing easier than ever for big institutions and hedge funds. As leverage drives up asset prices, the rich get richer, the working class gets left further behind, and we get more wealth inequality. My regular readers have heard me harp on this before. Fiscal policies like tax cuts and deregulation serve to incentivize capital spending and hiring to stimulate organic economic growth, whereas monetary policies like QE, ZIRP, and “helicopter money,” besides saving a financial system from collapse, mostly serve to stimulate asset price growth.
Q1 earnings season and valuations:
According to FactSet, during Q1 the sell-side analyst community increased its aggregate bottom-up EPS estimate of what companies in the S&P 500 will soon report for Q1 by +6.0% (to $39.86 from $37.61), compared to the historical norm in which estimates are reduced during the quarter (by an average of -5.1% over the past 15 years) – which was the largest increase during a quarter since FactSet began tracking it in 2002 (the previous record was +5.4% in Q1 2018 following passage of the tax reform bill). So, not surprisingly, the S&P 500 price index rose by a similar +5.8% during Q1. And it has kept on rising in April, as investors are apparently pricing in upside surprises in the upcoming earnings reports.
Current aggregate S&P 500 estimates are for $176.76/share in 2021, which would be +24.5% S&P 500 YOY earnings growth in Q1 2021 versus Q1 2020, and $202.83/share in 2022. At Wednesday’s closing price of 4,145, these estimates imply forward P/Es of 23.5x and 20.4x, respectively, which seems pricey and appears to leave little room for near-term upside. So, upside surprises will be essential for justifying current prices. Indeed, cautious analysts have been underestimating the pace of the recovery and have been slow to increase their estimates. But given the many tailwinds, investors are pricing in surging revenues and operating leverage leading to significant earnings beats this year and seem to be thinking more in terms of perhaps +35% YOY earnings growth, which would mark the highest YOY earnings growth rate for the S&P 500 since Q3 2010 (+34.0%, according to FactSet). This would lift 2021 aggregate EPS to $192/share and 2022 to $220/share, which imply more attractive forward P/Es of 21.6x and 18.8x, respectively.
Although these P/Es are somewhat less pricey – leaving some room for further upside in the cap-weighted S&P 500 this year given low interest rates and a lack of good alternatives – it also suggests to me that investment capital will be searching more broadly for opportunities other than passive flows into the cap-weighted indexes and the mega-cap juggernauts that dominate them. In other words, I expect outperformance in equal-weight indexes, active selection, and strategic beta.
Final comments:
One might see it as something of a catch-22 that, on the one hand, economic recovery and corporate earnings growth depends upon robust consumer spending returning to pre-pandemic form in a “Roaring ‘20s” reboot from 100 years ago. But on the other hand, consumers largely have been paying down debt and investing their stimulus checks (approximately 75%) rather than spending exuberantly, which has provided strong support to the stock market rally. For example, March inflows into US equity funds totaled $60 million in March alone, which was the largest monthly increase of the 12 months. It seems to me that the stock market needs both consumer spending and investing to happen in concert.
Regardless, after 30 years of disinflation and 39 years of falling rates, we seem to be in store for a sustained change of character in these cyclical trends – much more so than during the sluggish post-GFC recovery – with a long-lasting recovery/expansionary economic cycle and a more modest inflationary climate than many are forecasting, in my view.
I think the key is to remain bullish and invested in both cyclical and secular growth equities but refrain from chasing the big momentum stocks that prospered from the changes in our work and leisure activities caused by the pandemic. Moreover, I expect fundamental active selection, strategic beta, and equal weighting will outperform the cap-weighted passive indexes that have been so hard to beat over the past few years. This should be favorable for Sabrient’s enhanced growth-at-a-reasonable-price (aka GARP) approach, which combines value, growth, and quality factors while seeking a balance between secular growth and cyclical/value stocks and across market caps.
Lastly, let me reiterate that the Q2 2021 Baker’s Dozen launches next week. I have been particularly excited about our new portfolios this year because, whereas last year we were hopeful based on our testing that our enhanced portfolio selection process would provide better “all-weather” performance, over the course of the past year we have seen solid evidence (over quite a range of market conditions) that it has indeed provided significantly improved performance relative to the benchmark.
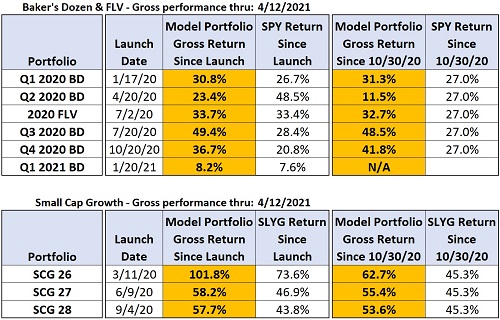
To illustrate, the table below shows the performance of the live Baker’s Dozen, Forward Looking Value, and Small Cap Growth model portfolios, both from their launch dates and since the value rotation kicked into high gear on 11/1/20, relative to the benchmark S&P 500 ETF (SPY) and S&P SmallCap 600 Growth ETF (SLYG), through 4/13/21. All but the Q2 2020 Baker’s Dozen have nicely outperformed on a gross return basis. [As a reminder, the Q2 2020 Baker’s Dozen was constructed during the depths of the pandemic when most companies had little or no forward visibility, which our quant model depends upon.]
As a reminder, you can go to http://bakersdozen.sabrient.com/bakers-dozen-marketing-materials to find my latest presentation slide deck and market commentary (which includes an update on the Q1 2020 Baker’s Dozen portfolio that terminates next week), as well as a “talking points” sheet that describes each of the 13 stocks in the latest Baker’s Dozen.
SPY Chart Review:
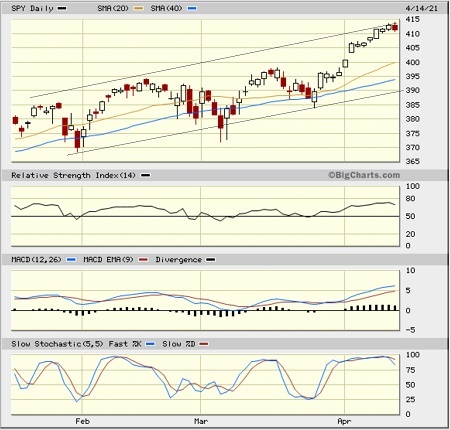
The SPDR S&P500 Trust (SPY) closed Wednesday at 411.45 after attaining yet another new record intraday high. The daily chart below zooms in on the past 3 months of the bullish rising channel from November 2020 (when the risk-on value rotation began) and continues to hold at both resistance and support, albeit with a few downside violations (due to various negative news events, like in early March) that quickly reversed. After testing support at the bottom of the rising channel in late March, price is now at the top of the channel, quite extended above its moving averages, and looking ready to roll over. Oscillators RSI, MACD, and Slow Stochastics are all severely overbought. And by the way, as I displayed in my commentary last month, the monthly chart is looking even more extended from the moving averages. Typically, the greater the divergence from moving averages, the greater the correction. Support levels include the rising 20-day simple moving average (SMA), a bullish price gap at 400, minor support at 395, and the bottom of the nearly 6-month rising channel.
Latest Sector Rankings:
Relative sector rankings are based on our proprietary SectorCast model, which builds a composite profile of each of over 900 equity ETFs based on bottom-up aggregate scoring of the constituent stocks. The Outlook Score employs a forward-looking, fundamentals-based multifactor algorithm considering forward valuation, historical and projected earnings growth, the dynamics of Wall Street analysts’ consensus earnings estimates and recent revisions (up or down), quality and sustainability of reported earnings, and various return ratios. It helps us predict relative performance over the next 2-6 months.
In addition, SectorCast computes a Bull Score and Bear Score for each ETF based on recent price behavior of the constituent stocks on particularly strong and weak market days. A high Bull score indicates that stocks within the ETF recently have tended toward relative outperformance when the market is strong, while a high Bear score indicates that stocks within the ETF have tended to hold up relatively well (i.e., safe havens) when the market is weak.
Outlook score is forward-looking while Bull and Bear are backward-looking. As a group, these three scores can be helpful for positioning a portfolio for a given set of anticipated market conditions. Of course, each ETF holds a unique portfolio of stocks and position weights, so the sectors represented will score differently depending upon which set of ETFs is used. We use the iShares that represent the ten major U.S. business sectors: Financial (IYF), Technology (IYW), Industrial (IYJ), Healthcare (IYH), Consumer Goods (IYK), Consumer Services (IYC), Energy (IYE), Basic Materials (IYM), Telecommunications (IYZ), and Utilities (IDU). Whereas the Select Sector SPDRs only contain stocks from the S&P 500 large cap index, I prefer the iShares for their larger universe and broader diversity.
Here are some of my observations on this week’s scores:
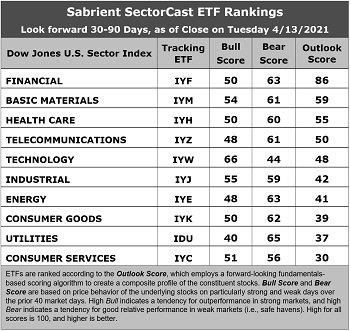
1. Financial remains in the top spot with a robust Outlook score of 86, indicating increased conviction in the model since last month. The sector displays the best sell-side analyst sentiment (recent positive net revisions to EPS estimates), good return ratios, a reasonable forward P/E of 18.0x, an attractive forward PEG (forward P/E divided by projected EPS growth rate) of 1.66, and by far the best insider sentiment (open market buying). Basic Materials is a distant second with an Outlook score of 59, given good analyst sentiment, a reasonable forward P/E of 19.2x, and an attractive forward PEG of 1.73. Rounding out the top seven are Healthcare, Telecom, Technology, Industrial, and Energy, which is bullish.
2. The bottom three sectors are Consumer Services (Discretionary/Cyclical) with an Outlook score of 30, primarily due to its high forward P/E of 29.0x despite having a strong projected EPS growth rate of 14.9%; and defensive sectors Utilities at 37 and Consumer Good (Staples/Noncyclical) at 39. Notably, Energy has risen from the bottom two given improving analyst sentiment and a falling forward P/E (now 19.2x) as oil is back above $60.
3. Looking at the Bull scores, Technology displays the top score of 66, followed by Industrial at 55, as stocks within these sectors have displayed relative strength on strong market days. Utilities scores the lowest at 40. The top-bottom spread of 26 points reflects low sector correlations on strong market days. It is desirable in a healthy market to see low correlations reflected in a top-bottom spread of at least 20 points, which indicates that investors have clear preferences in the market segments and stocks they want to hold.
4. Looking at the Bear scores, defensive sector Utilities scores the highest at 65, followed by Energy and Financial at 63, as stocks within these sectors have been the preferred safe havens lately on weak market days. Technology displays by far the lowest score of 44, as investors have fled during recent market weakness. The top-bottom spread of 21 points reflects low sector correlations on weak market days. Ideally, certain sectors will hold up relatively well while others are selling off (rather than broad risk-off behavior), so it is desirable in a healthy market to see low correlations reflected in a top-bottom spread of at least 20 points.
5. Financial displays the best all-around combination of Outlook/Bull/Bear scores, while Consumer Services (Discretionary/Cyclical) is the worst. Looking at just the Bull/Bear combination, Basic Materials is the best, followed by Industrial, indicating superior relative performance (on average) in extreme market conditions whether bullish or bearish (both represent economically sensitive value/cyclicals market segments), while Utilities scores the worst.
6. This week’s fundamentals-based Outlook rankings display a solidly bullish bias, given that 6 of the top 7 sectors are economically sensitive. The near-term earnings outlook in our fundamentals-based model continues to gain visibility as a nascent reopening has begun. Of the 10 sectors, only Telecom has seen recent net negative revisions to EPS estimates. Keep in mind, the Outlook Rank does not include timing, momentum, or relative strength factors, but rather reflects the consensus fundamental expectations at a given point in time for individual stocks, aggregated by sector.
ETF Trading Ideas:
Our Sector Rotation model, which appropriately weights Outlook, Bull, and Bear scores in accordance with the overall market’s prevailing trend (bullish, neutral, or defensive), continues to display a bullish bias and suggests holding Technology (IYW), Financial (IYF), and Basic Materials (IYM), in that order. (Note: In this model, we consider the bias to be bullish from a rules-based trend-following standpoint when SPY is above both its 50-day and 200-day simple moving averages.)
If you prefer a neutral bias, perhaps because of how extended SPY is from a technical standpoint, the Sector Rotation model suggests holding Financial, Basic Materials, and Healthcare, in that order. Or, if you are more comfortable with a defensive stance, the model suggests holding Financial, Utilities, and Basic Materials, in that order. Note that the model suggests holding Financial and Basic Materials in all cases.
An assortment of other interesting ETFs that are scoring well in our latest rankings include VanEck Vectors Steel (SLX), First Trust Financials AlphaDEX (FXO), iShares US Regional Banks (IAT), Invesco KBW High Dividend Yield Financial (KBWD), First Trust Dorsey Wright Momentum & Value (DVLU), iShares US Broker-Dealers & Securities Exchanges (IAI), iShares Focused Value Factor (FOVL), First Trust Morningstar Dividend Leaders (FDL), Cambria Value and Momentum (VAMO), Invesco S&P 500 Equal Weight Financials (RYF), Invesco DWA Financial Momentum (PFI), WisdomTree US MidCap (EZM), Sound Equity Income (SDEI), iShares US Home Construction (ITB), Innovator IBD 50 (FFTY), iShares US Small Cap Value (SVAL), Innovator IBD Breakout Opportunities (BOUT), and First Trust Indxx Global Natural Resources Income (FTRI), among many others.
As always, I welcome your thoughts on this article! Please email me anytime. Any and all feedback is appreciated!
IMPORTANT NOTE: I post this information periodically as a free look inside some of our institutional research and as a source of some trading ideas for your own further investigation. It is not intended to be traded directly as a rules-based strategy in a real money portfolio. I am simply showing what a sector rotation model might suggest if a given portfolio was due for a rebalance, and I do not update the information on a regular schedule or on technical triggers. There are many ways for a client to trade such a strategy, including monthly or quarterly rebalancing, perhaps with interim adjustments to the bullish/neutral/defensive bias when warranted, but not necessarily on the days that I happen to post this article. The enhanced strategy seeks higher returns by employing individual stocks (or stock options) that are also highly ranked, but this introduces greater risks and volatility. I do not track performance of the ideas mentioned here as a managed portfolio.
Disclosure: At the time of this writing, among the securities mentioned, the author held positions in SPY, IWM, bitcoin, and ether.
Disclaimer: This newsletter is published solely for informational purposes and is not to be construed as advice or a recommendation to specific individuals. Individuals should take into account their personal financial circumstances in acting on any opinions, commentary, rankings, or stock selections provided by Sabrient Systems or its wholly owned subsidiary, Gradient Analytics. Sabrient makes no representations that the techniques used in its rankings or analysis will result in or guarantee profits in trading. Trading involves risk, including possible loss of principal and other losses, and past performance is no indication of future results.