Sector Detector: A bull’s paradise is a market looking for reasons to buy
 by Scott Martindale
President, Sabrient Systems LLC
The secular bull market that began on March 9, 2009 in the wake of the Financial Crisis just passed its ninth anniversary last Friday, and as if to celebrate, stocks rallied big on the strong reports of jobs growth, total employment, and labor participation, while wage inflation remained modest. All in all, it was a lot of great news, but instead of selling off – as stocks have done in the past in a “good news means bad news” reaction, assuming the Fed would feel emboldened to raise rates more aggressively – stocks rallied strongly. This is a market of investors looking for reasons to buy rather than to sell, i.e., the bulls are still in charge.
Strong global fundamentals are firmly in place for the foreseeable future, while corporate earnings expectations continue to rise, inflation fears appear to have diminished, and the overall climate remains favorable for equities. After the February selloff was complete, extreme valuations had been reduced, and support levels had been tested, investors were ready to embrace good news – albeit with some renewed caution in the wake of the recent surge in volatility. As we all learned, volatility is not dead. VIX is an oscillator that always eventually mean-reverts. This will surely result in some deleveraging as well as perhaps some P/E compression from the run-up in valuations we saw in anticipation of the fiscal stimulus package.
In this periodic update, I provide a market commentary, offer my technical analysis of the S&P 500, review Sabrient’s latest fundamentals-based SectorCast rankings of the ten US business sectors, and serve up some actionable ETF trading ideas. In summary, our sector rankings still look bullish, while the sector rotation model regained its bullish bias during the recovery from the market correction and volatility surge. Read on....
Market Commentary:
Let me share an analogy. If you are in sales, you know that there are essentially two types of prospects – those looking for a reason to say “yes” and those looking for a reason to say “no.” As a salesperson, you want to spend the bulk of your time focusing on the former because, let’s face it, if they are looking for reasons to say “no” they will certainly find something. Well, the same can be said for the stock market. You want to invest when most investors are looking for reasons to buy. If investors are looking for reasons to sell, they will certainly find them by interpreting any kind of news (good or bad) in the worst possible way.
Indeed, after an unprecedented period of low volatility, stocks went almost vertical in January, largely in anticipation of great things to come from the new tax bill and ongoing deregulation. But it became so overbought that investors were looking for reasons to sell, so of course they found a few, which under normal conditions might have led the market to merely consolidate in place for a week or two. There were: overblown fears of inflation and rapidly rising interest rates; an unfounded assumption that a dovish Fed and its long-standing “Fed Put” were no longer in place to support the market; and panic that structural problems in the market had been revealed by the collapse of inverse-VIX products. But the reality was that investors simply knew that stocks had gotten ahead of themselves, so they were just looking for reasons to protect profits and (for some) put on short positions. The aftermath was ugly and scary as investors were looking for reasons to sell.
As if on cue, the doomsayers came right out of hibernation to declare that the “next big correction” was upon us – and perhaps the end of the secular bull – with some comparing current market conditions to 1987, e.g., weak dollar, rising inflation, bonds selling off, big deficits, rising volatility, elevated valuations, and a new Fed chairperson. Moreover, asset classes have been highly correlated such that there is nowhere to hide, so to speak, when investors broadly hit the sell button. And as Goldman Sachs just pointed out, even the standard safe havens, like bonds and gold, have failed to provide positive beta to either rising VIX or rising 10-year yields.
But it wasn’t the end of the bull market – far from it. It turned out to be a mere technical correction from extremely overbought conditions, as support levels were successfully tested, and investors took advantage of more favorable valuations for a buying opportunity. Investors remain encouraged by a broadly positive market climate. Synchronized global economic expansion continues, as all 45 countries tracked by the OECD are in their fifth straight quarter of synchronous growth, boosting foreign demand for US exports. US economic reports continue to impress. Corporations are reporting strong (and improving) cash flow and earnings, as well as high cash balances. Unemployment remains near 1960 lows. Inflation is modest, with Tuesday’s February CPI report coming in below expectations at only 0.2%. The Fed remains accommodative (only somewhat “less dovish”). There is still over $2 trillion in excess bank reserves. Interest rates remain low. The yield curve is upsloping. There is continual progress in loosening the regulatory noose. And of course, the biggest tax overhaul in a generation is just starting to gain traction – incentivizing capital investment, expansion, onshoring of offshore operations, and hiring, as well as higher dividends, continued share buybacks, and additional M&A.
The February jobs report (BLS nonfarm payrolls) showed a gain of 313,000, clobbering expectations of 205,000, while the BLS household survey showed that total employment (including agricultural workers, self-employed, and small business startups) spiked strongly by 785,000. The unemployment rate remained steady at 4.1% for the fifth straight month as the labor participation rate rose. Wage inflation is only nominal and less than expected. US Industrial Production hit an all-time high of 107.24 in January. The Conference Board’s Consumer Confidence Index for February came in at 130.8, the highest reading since it hit 132.6 back in November 2000, while the NFIB Small Business Optimism Index rose yet again to 107.6. 4Q17 earnings season has been stellar with the vast majority of S&P 500 companies reporting both top and bottom-line beats. The BEA’s second estimate of real GDP in 4Q17 sits at 2.5%, and for 1Q18, the Atlanta Fed’s GDPNow model just came in Wednesday morning with an updated forecast of 1.9% (notably down from 5.4% on February 1), while the New York Fed’s Nowcast model projects 2.8% for 1Q18 and 3.0% for 2Q18. Fears of runaway inflation have suddenly subsided.
Although it is true that, from a historical perspective, stocks tend to lose steam, top out, and enter a bear phase well before the economy goes into recession, it seems to me that the next recession is a long ways off. In fact, I think it is entirely possible that, after several years of slow growth supported by monetary policy-driven asset inflation (a.k.a. “Ponzi financing”), punctuated by mini “stealth busts” like the profit recession from 1Q2014 through 2Q2016 and the capex recession (that is only now showing signs of ending), we may be just now entering a multi-year period of robust economic growth – supported by new “rules of the game” in the way of low corporate tax rates and less-onerous regulation, and enabled by accelerating technological breakthroughs. In other words, it’s a great time to be invested in the stock of strong companies sporting attractive forward valuations and sound earnings quality.
So, what about Trump’s new tariffs on steel and aluminum? Everyone seems worried about this, and the potential for a global trade war. I was frequently asked about this by financial advisors around the country during my latest travels. So, here is my perspective. Much like domestic welfare, in which a hand-up eventually turns into a permanent handout and a way-of-life entitlement for the recipient, countries around the world that have long enjoyed a hand-up from the US have become accustomed to the US always accepting the short end of the stick, and Trump is trying to say, “no more.” But I do not think we are on the path toward an economy-killing trade war. We are too deeply in debt, with $20 trillion in total federal debt and a newly jacked-up budget deficit to boot. Even Trump knows this to be the case, but that doesn’t stop him from trying to shake things up. It’s a classic example of his negotiating strategy. Rather than watch trade negotiations languish in committee for years on end with no resolution, he skips the diplomacy and instills a sense of urgency with the stroke of a pen and some tough language. Note that he has already given a temporary reprieve to Canada and Mexico so long as they are showing good faith in renegotiating NAFTA. Time will tell how this approach will work out, but I for one am rooting for success.
Last year was dominated by Momentum and Growth factors, albeit with sufficient market breadth (rather than FAANG alone) to include a lot of market segments. And so far this year, the trend persists as the Growth factor has continued to pummel Value on a head-to-head basis. Witness the S&P 500 Growth (SPYG) at +8.4% versus S&P 500 Value (SPYV) at only 0.69%, YTD through last Friday, as well as the Growth- and Tech-oriented Nasdaq 100 (QQQ) at +11.3%. Nevertheless, given that there was a big runup in prices in anticipation of fiscal stimulus, I believe this year ultimately will see greater focus on fundamentally sound companies, particularly among small and mid caps, as well as the Value and Quality factors. So far this month, small caps have been noticeably outperforming large caps. In any case – whether the market is dominated by Growth or Value – I think GARP (growth at reasonable price) should do well. Indeed, Sabrient’s GARP-focused portfolios (e.g., our monthly Baker’s Dozen) have been thriving in the current environment of strong market breadth. And while market conditions over the past few years have favored large-caps in general and large-cap Tech in particular, a rotation seems to be in place toward under-the-radar names that I like to call “Baker’s Dozen stocks.”
Everybody seems to be intimidated by the threat of rising interest rates, so let’s discuss it. The latest Fed "dot plot" still projects three rate hikes this year, which would bring the target rate to a 2.00-2.25% range by year end. CME fed funds futures currently place the odds of a rate hike at the March meeting next week at 89%. By the June meeting, the odds of a second rate hike are 72%, and by September there is a 51% chance of a third rate hike. By the December meeting, there is a 32% probability of a fourth quarter-point rate hike, which would bring the target rate to 2.25-2.50% range (and actually a 6.5% chance of a fifth hike). After briefly spiking on inflation fears, the 10-year Treasury seems to have caught a bid as it approached 3.0%. It settled Tuesday at 2.85%, while the 2-year is at 2.26%. The closely-watched 2-10 spread, which had been gradually flattening all last year before rising during the market turbulence and inflation fears, has fallen back to 59 bps – well under the 100 bps “normalcy threshold,” as well as the 101 bps on Election Day, and 136 bps immediately following the November 2016 election.
It looks like the weakening dollar is finally finding support at current levels – it has been forming a base since the end of January. And when you combine that with the increasing attractiveness of the 10-year Treasury yield compared to other “risk-free” alternatives around the world (e.g., 0.62% in Germany and 0.053% in Japan), it is enticing capital back into Treasuries, keeping a lid on yields. Moreover, passive capital inflows to fixed income funds (such as from strategic asset allocations for Baby Boomers) will perpetuate a demand for fixed income. And as equity investors feel comfortable that we are not on the verge of runaway inflation, and that the Fed is going to remain cautious and supportive under new chair Jerome Powell, they will feel confident in buying and holding stocks.
Nevertheless, the days of historically low volatility may be behind us for the foreseeable future. The CBOE Market Volatility Index (VIX), aka “fear gauge,” closed Tuesday at 16.46. Although that is above the “fear threshold” of 15, it is back below the “panic threshold” of 20 – which sounds pretty good when you consider that a closing high of 37.32 was hit just several weeks ago. But it remains elevated compared with the average daily close of 11 all last year. As you might expect, elevated volatility has been joined by elevated sector correlations (and some risk-on/risk-off behavior). Fortunately, market breadth and performance dispersion among stocks has held up, which is favorable for stock picking (as opposed to passive index investing).
I expect elevated volatility and correlations this year will somewhat dampen leverage in risk parity portfolios and equity allocations in general, so I expect some P/E compression at year-end compared to last year. The Next Twelve Months (NTM) forward P/E for the S&P 500 has already fallen from about 18.5x at the beginning of the year to about 17.5x today. And with forward EPS growth projected to be 14.1%, that implies a forward PEG of 1.24, versus 1.60 at the beginning of the year (18.5x forward P/E for 11.5% expected EPS growth). Furthermore, if you flip today’s forward P/E upside down, you get an earnings yield of 5.7%, which provides a solid risk premium (2.8%) versus the “risk-free” 10-year Treasury yield, especially when you consider that prior to the late-90s run-up into the Internet bubble, the S&P 500 forward earnings yield was about equal to the nominal 10-year Treasury yield.
So, I don’t see valuations as being unreasonable at all. And with such robust EPS growth in the pipeline, I expect the S&P 500 to see double-digit total return by year-end, even if there is some P/E compression, as share price growth falls back in better alignment with earnings growth (where it belongs). Moreover, the mega-trend of passive indexing has created too many distortions in valuations of mega-cap stocks, some of which simply don’t deserve it. Thus, I expect continued market breadth and rotation into small and mid caps (which stand to benefit the most from lower tax rates, deregulation, and M&A activity) such that a well-selected portfolio of attractive GARP stocks may perform a lot better than simply holding the SPY.
Speaking of which, next week, our March Baker’s Dozen portfolio launches with our latest 13 favorite US-listed stocks. David Brown and his analyst team have produced another interesting list that is heavy in small and mid caps, including some of those under-the-radar names that we are known for identifying.
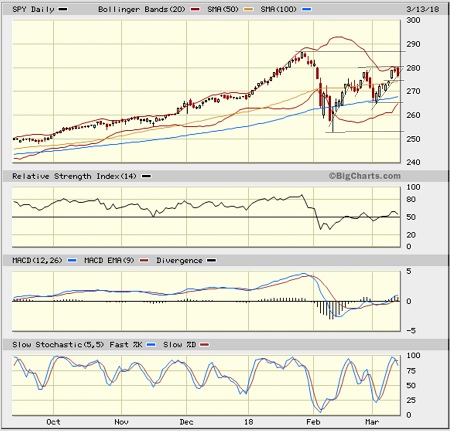
SPY Chart Review:
The SPDR S&P 500 ETF (SPY) closed Tuesday at 276.72, as it struggles to retake the 280 level (equivalent to 2,800 on the S&P 500 Index). After successfully testing support at its 200-day simple moving average (SMA) in February, it is stair-stepping its way back up toward its highs. But it likely won’t be a walk in the park like it was in January. Investors are “once burned, twice shy” given the re-emergence of volatility. A lot of technical damage was done. Now that the deeply oversold technical conditions have been mostly worked off, we shall see where the market wants to go next. I think it will be higher soon, but for the moment, oscillators RSI, MACD, and Slow Stochastic all have recovered a lot of ground and may need to cycle back down. Bollinger Bands are pinching back together after that big down-move made them spread wide. Price may either consolidate in place for a time, or it may fall a bit to test support levels. Tuesday gave us a bearish engulfing candle, which suggests lower prices in the near term. If the uptrend line for March doesn’t hold support, then price may retreat to close the Friday gap up from 274, which coincides with the 40 and 50-day SMAs. Next support after that is the 20-day SMA near 272, the 100-day near 268, prior support around 264 and 260, the 200-day SMA around 258, and then the prior selloff low at 253.
Latest Sector Rankings:
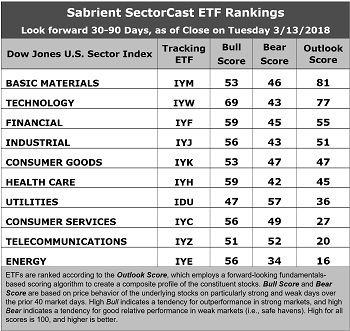
Relative sector rankings are based on our proprietary SectorCast model, which builds a composite profile of each of over 600 equity ETFs based on bottom-up aggregate scoring of the constituent stocks. The Outlook Score employs a forward-looking, fundamentals-based multifactor algorithm considering forward valuation, historical and projected earnings growth, the dynamics of Wall Street analysts’ consensus earnings estimates and recent revisions (up or down), quality and sustainability of reported earnings, and various return ratios. It helps us predict relative performance over the next 1-3 months.
In addition, SectorCast computes a Bull Score and Bear Score for each ETF based on recent price behavior of the constituent stocks on particularly strong and weak market days. A high Bull score indicates that stocks within the ETF recently have tended toward relative outperformance when the market is strong, while a high Bear score indicates that stocks within the ETF have tended to hold up relatively well (i.e., safe havens) when the market is weak.
Outlook score is forward-looking while Bull and Bear are backward-looking. As a group, these three scores can be helpful for positioning a portfolio for a given set of anticipated market conditions. Of course, each ETF holds a unique portfolio of stocks and position weights, so the sectors represented will score differently depending upon which set of ETFs is used. We use the iShares that represent the ten major U.S. business sectors: Financial (IYF), Technology (IYW), Industrial (IYJ), Healthcare (IYH), Consumer Goods (IYK), Consumer Services (IYC), Energy (IYE), Basic Materials (IYM), Telecommunications (IYZ), and Utilities (IDU). Whereas the Select Sector SPDRs only contain stocks from the S&P 500 large cap index, I prefer the iShares for their larger universe and broader diversity.
Here are some of my observations on this week’s scores:
1. Basic Materials has taken over the top of the rankings with a solid Outlook score of 81. The sector continues to see solid sell-side analyst sentiment (net positive revisions to EPS estimates), a modest forward P/E (17.2x), the best insider sentiment (net open market buying), and the highest return ratios. Forward PEG (ratio of forward P/E to forward EPS growth rate) is a middle-of-the-road 1.40. Technology takes the second spot with an Outlook score of 77, as it boasts the best sell-side analyst sentiment, the second highest projected year-over-year EPS growth rate (15.9%), a low forward PEG of 1.19, and strong return ratios. Financial comes in a distant third at 55, with a forward P/E of 16.4x and a forward PEG of 1.18. Rounding out the top six are Industrial, Consumer Goods (Staples/Noncyclical), and Healthcare. The lowest (best) forward PEG goes to Energy (0.50), while the highest (worst) goes to Utilities (3.09).
2. Energy returns to the bottom despite its strong projected year-over-year EPS growth rate of 40.2%. Telecom is also in the bottom two.
3. Looking at the Bull scores, Technology enjoys the top score of 69, as stocks within this sector have displayed relative strength on strong market days, while Utilities scores the lowest at 47. The top-bottom spread is 22 points, which reflects low sector correlations on strong market days. It is desirable in a healthy market to see low correlations reflected in a top-bottom spread of at least 20 points, which indicates that investors have clear preferences in the market segments and stocks they want to hold (rather than broad risk-on behavior).
4. Looking at the Bear scores, we find Utilities at the top with a score of 57, which means that stocks within this sector have been the preferred safe havens lately on weak market days. Energy has the lowest score of 34, as investors have fled during market weakness. The top-bottom spread is 23 points, which reflects low sector correlations on weak market days. Ideally, certain sectors will hold up relatively well while others are selling off (rather than broad risk-off behavior), so it is desirable in a healthy market to see low correlations reflected in a top-bottom spread of at least 20 points.
5. Technology displays the best all-around combination of Outlook/Bull/Bear scores, while Energy is the worst. Looking at just the Bull/Bear combination, Technology is stil the best, indicating superior relative performance (on average) in extreme market conditions (whether bullish or bearish), while Energy scores the worst, as investors have generally avoided the sector lately.
6. This week’s fundamentals-based Outlook rankings continue to reflect a bullish bias, given that the top four sectors are economically-sensitive, and all four score above 50. Keep in mind, the Outlook Rank does not include timing, momentum, or relative strength factors, but rather reflects the consensus fundamental expectations at a given point in time for individual stocks, aggregated by sector.
ETF Trading Ideas:
Our Sector Rotation model, which appropriately weights Outlook, Bull, and Bear scores in accordance with the overall market’s prevailing trend (bullish, neutral, or defensive), displays a bullish bias and suggests holding Technology (IYW), Financial (IYF), and Healthcare (IYH), in that order. (Note: In this model, we consider the bias to be bullish from a rules-based trend-following standpoint when SPY is above both its 50-day and 200-day simple moving averages.)
Besides iShares’ IYW, IYF, and IYH, other highly-ranked ETFs in our SectorCast model (which scores nearly 650 US-listed equity ETFs) from the Technology, Financial, and Healthcare sectors include VanEck Vectors Semiconductor (SMH), First Trust NASDAQ Bank ETF (FTXO), and PowerShares Dynamic Pharmaceuticals (PJP).
If you prefer a neutral bias, the Sector Rotation model suggests holding Basic Materials, Technology, and Financial, in that order. On the other hand, if you are more comfortable with a defensive stance on the market, the model suggests holding Utilities, Basic Materials, and Technology, in that order.
An assortment of other interesting ETFs that are scoring well in our latest rankings include PowerShares Dynamic Building & Construction (PKB), Alpha Architect US Quantitative Value (QVAL), US Global Jets (JETS), Pacer US Cash Cows 100 (COWZ), Cambria Value and Momentum (VAMO), First Trust Materials AlphaDEX (FXZ), Direxion All Cap Insider Sentiment (KNOW, which licenses and tracks a Sabrient index), SPDR MFS Systematic Value Equity (SYV), iShares Edge MSCI USA Value Factor (VLUE), and John Hancock Multifactor Materials (JHMA).
IMPORTANT NOTE: I post this information periodically as a free look inside some of our institutional research and as a source of some trading ideas for your own further investigation. It is not intended to be traded directly as a rules-based strategy in a real money portfolio. I am simply showing what a sector rotation model might suggest if a given portfolio was due for a rebalance, and I do not update the information on a regular schedule or on technical triggers. There are many ways for a client to trade such a strategy, including monthly or quarterly rebalancing, perhaps with interim adjustments to the bullish/neutral/defensive bias when warranted, but not necessarily on the days that I happen to post this article. The enhanced strategy seeks higher returns by employing individual stocks (or stock options) that are also highly ranked, but this introduces greater risks and volatility. I do not track performance of the ideas mentioned here as a managed portfolio.
Disclosure: The author has no positions in stocks or ETFs mentioned.
Disclaimer: This newsletter is published solely for informational purposes and is not to be construed as advice or a recommendation to specific individuals. Individuals should take into account their personal financial circumstances in acting on any opinions, commentary, rankings, or stock selections provided by Sabrient Systems or its wholly-owned subsidiary Gradient Analytics. Sabrient makes no representations that the techniques used in its rankings or analysis will result in or guarantee profits in trading. Trading involves risk, including possible loss of principal and other losses, and past performance is no indication of future results.