Sector Detector: Blowout earnings, low interest rates, and dovish Fed, but have stocks hit a peak?
 by Scott Martindale
President & CEO, Sabrient Systems LLC
Another positive month for the major indexes, despite plenty of new bricks in the proverbial Wall of Worry. That makes 7 months in a row – the longest streak in over 30 years – and 14 of the past 17 months (since the pandemic low). From a technical (chart) perspective, the S&P 500 has tested its 50-day simple moving average seven times this year, each time going on to hit a new high. And it’s not just the cap-weighted index (SPY) as the equal-weight version (RSP) has been moving in lockstep, illustrating good market breadth and confirming market conviction. Stocks seem to have already priced in some modest tapering of asset purchases by year end, so in the wake of Fed chairman Powell’s late-August speech in Jackson Hole indicating no plans for rate hikes, stocks surged yet again. Indeed, it has become a parabolic “melt-up,” which of course cannot go on forever.
Many investors have been patiently awaiting a significant market correction to use as a buying opportunity, but it remains elusive. What happened to the typical August low-volume technical correction? The big money institutions and hedge funds certainly have stuck to the script by reducing equity exposure and increasing exposure to volatility. But retail investors didn’t get the memo as every time it appears the correction has begun, they treat it like a buyable dip – not just in meme stocks but also the disruptive, secular-growth Tech stocks that so dominate total market cap and the cap-weighted, broad-market indexes. It seems like yet another market distortion caused by government intervention and de facto Modern Monetary Theory (MMT) that has flooded the economy with free money and kept workers at home to troll on social media, gamble on DraftKings, and speculate in Dogecoin, NFTs, SPACs, and meme stocks.
Will September finally bring a significant (and overdue) correction, or will the dip buyers, led by an active, brash, and risk-loving retail investor, continue to scare off the short sellers and prop up the market? Is this week’s pullback yet another head fake? And regardless, will the S&P 500 (both cap-weight and equal-weight) finish the year higher than last week’s all-time highs?
There is little doubt in my mind that the big institutional investors continue to wait patiently in the tall grass like a cheetah to pounce on any significant market weakness, like a 10+% selloff. Valuations are dependent on earnings, interest rates, and the equity risk premium (ERP, i.e., earnings yield minus the risk-free rate), and today we have robust corporate earnings, rising forward guidance, persistently low interest rates, a dovish Fed, and a low ERP – which is related to inflation expectations that are much lower than recent CPI readings would have you expect. I continue to expect inflation to moderate in 2022 while interest rates remain constrained by a stable dollar and Treasury demand. The Fed’s ongoing asset purchases (despite some expected tapering) along with robust demand among global investors (due to global QE and low comparative yields) has put a bid under bonds and kept nominal long term yields low (albeit with negative real yields). Indeed, bond yields today are less sensitive to inflationary signals compared to the past.
In this periodic update, I provide a comprehensive market commentary, offer my technical analysis of the S&P 500 chart, review Sabrient’s latest fundamentals based SectorCast quant rankings of the ten US business sectors, and serve up some actionable ETF trading ideas. To summarize, our SectorCast rankings reflect a solidly bullish bias; the technical picture has been strong but remains in dire need of significant (but healthy and buyable, in my view) correction; and our sector rotation model retains its bullish posture. We continue to believe in having a balance between value/cyclicals and secular growth stocks and across market caps, although defensive investors may prefer an overweight on large-cap, secular-growth Tech and high-quality dividend payers.
As a reminder, we post my latest presentation slide deck and Baker’s Dozen commentary on our public website.) Sabrient’s newer portfolios – including Q3 2021 Baker’s Dozen, Small Cap Growth, Dividend, and Forward Looking Value– all reflect the process enhancements that we implemented in December 2019 in response to the unprecedented market distortions that created historic Value/Growth and Small/Large performance divergences. With a better balance between cyclical and secular growth and across market caps, most of our newer portfolios once again have shown solid performance relative to the benchmark during quite a range of evolving market conditions.
By the way, I welcome your comments, feedback, or just a friendly hello! Read on….
Commentary:
The second estimate of Q2 GDP from the BEA came in at an annual rate of 6.6%, versus the consensus estimate of 8.4%. And with job growth disappointing last week and the COVID Delta variant spreading, the Federal Reserve is in no hurry to tighten its accommodative policy of low interest rates and asset purchases (despite suggesting some modest tapering), which has helped keep the bull train running. However, the GDP miss was largely due to inventory drawdown rather than dwindling consumer demand, so given order backlogs and unfulfilled pent-up demand, it bodes well for continued GDP growth. Looking toward Q3, the Atlanta Fed’s GDPNow estimate for annualized real GDP growth is 3.7% as of 9/2/21 (down from 5.3%).
Q2 corporate earnings reports showed that 87% of S&P 500 companies beat revenue expectations, which was the highest percentage since 2008. Strong EPS growth and raised guidance has allowed the forward P/E multiple to contract even as share prices have gone parabolic. For 2022, the most recent bottom-up full-year EPS estimate for the S&P 500 I have seen is $212/share, but it will likely be higher if estimates continue to prove cautious and companies continue with the big beats. Technology (including the reclassified juggernauts like Google, Amazon, and Facebook) and Healthcare sectors accounted for almost all that strong earnings growth. Energy and Materials were strong as well, but they are the two lowest weighted sectors in the index, so their impact on the total was minimal. But moving forward, the rest of “the team” is going to have to start pulling its weight as well, especially Consumer, Financial, and Industrial sectors.
For the S&P 500 to hit 5,000 at a reasonable forward P/E of 20, it requires full-year earnings of $250/share. But given that revenue growth in 2021 is only about 3% higher than pre-pandemic 2019 while earnings growth is closer to 23% – thanks to rising productivity, operating leverage, and ROE – investors should be asking whether earnings leverage alone can continue to fuel strong earnings growth and support valuations going forward. I think stronger top-line growth will be needed.
A number of Wall Street heavyweights like Savita Subramanian of BofA, Mike Wilson of MS, and Barry Bannister of Stifel are quite bearish on stocks right now, each with year-end S&P 500 price targets in the 3,800-4,000 range. In fact, the average Wall Street target is 4,240, which is about 6% lower than today’s price. Their bearish views seem to be tied primarily to rising bond yields and inflationary pressures. Although a priority for capital preservation might suggest heeding their defensiveness, I’m not at all convinced that yields are on the verge of spiking or that inflation will spiral – in fact, quite the opposite. Let me explain.
Interest rates and inflation:
“Everything that could go wrong has gone wrong at the same time,” said Isaac Larian, CEO of toymaker MGA Entertainment, as fulfilling Christmas demand is suddenly in doubt. COVID-related labor and supply shortages and other disruptions in global shipping and trucking, coupled with the spike in pent-up demand have created delays, port congestion, rising materials prices, and chip shortages, all of which are impacting global supply chains across the board. We were already well aware of the slowdown in auto manufacturing, but who thought about toys? Such supply chain issues have created order backlogs and higher product prices, but it should all be worked out eventually.
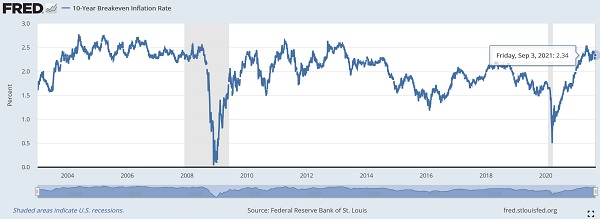
Indeed, US inflation expectations as measured by 5- and 10-year TIPS breakeven inflation rates peaked in mid-May at 2.72/2.54%, but today they sit at 2.48/2.34% and have been stuck in a narrow sideways trading range for the past few months, which suggests that markets now expect tamer inflation over the coming years. The 10-year chart is shown below. This has been great for large-cap growth stocks (as described in the next section below) and helped keep the CBOE Volatility Index (VIX) comfortably below 20 (with just a few brief exceptions) since the end of March – i.e., no worries and no selloffs.
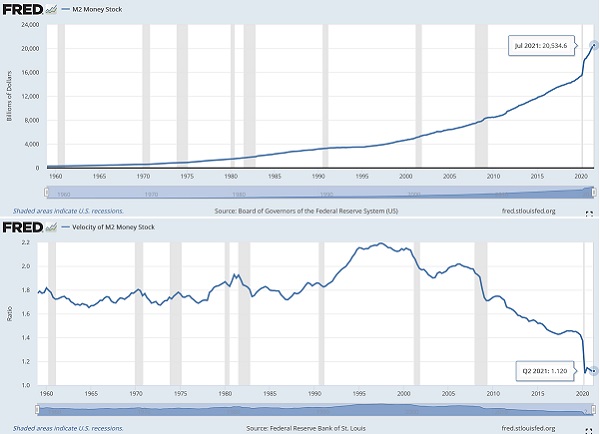
Much has been made about the inflationary potential of the astounding rise in M2 money supply growth since the end of 2019 to a record high today, as shown in the first chart below. But you also must consider the velocity of M2 money supply, as shown in the second chart. The US went off the gold standard in 1971, when velocity showed a 1.7x multiplier effect on every dollar printed, and eventually peaked in 1997 at 2.2x during the early days of the dot-com craze. But today it remains near a record low around 1.12, indicating little multiplier effect on the money being injected into the economy and thus little inflationary impact. In other words, money growth has surged since 1997 while the velocity of money has steadily fallen along with inflation. So, without the multiplier effect, money printing is not the strong economic force it once was. So much for monetarism. This is why Q2 GDP growth disappointed expectations and why “transitory” inflationary pressures are unlikely to persist. Moreover, AlpineMacro has pointed out that capital investment is far lower than private sector savings (as negative a gap as it was during the 2008 financial crisis), which is a “key reason why bond yields are still very low even though the US economy has rebounded strongly.”
As for Fed tapering of asset purchases (QE), Fed chair Jay Powell said at the Jackson Hole Economic Symposium that lingering slack in the labor market and an ongoing (and mutating) pandemic create too much uncertainty such that a policy mistake (i.e., tapering too soon) could be “particularly harmful.” In addition, there are uncertainties about the debt ceiling, additional fiscal stimulus, and the new Fed chairperson appointment (will there be a change?). Although Powell suggested that tapering could start before year end “if the economy evolved broadly as anticipated,” he left little chance for a rate hike any time soon – and will be basing it on a “different and substantially more stringent test.” Moreover, he pointed out that unit labor costs (wage growth) have not displayed outsized growth.
In addition, I believe the dollar will remain firm, further holding back inflation, given that the rest of the developed world has been similarly employing QE while the US is signaling a possible start to tapering. At the end of the day, the dollar remains a safe haven currency when there is any kind of global uncertainty. This is generally considered to be helpful for small caps, which are less impacted by currency exchange rates.
And finally, let me reiterate my ongoing view of the many disinflationary drivers that will predominate for the foreseeable future, including aging demographics, slowing global population growth, re-globalization of trade and supply chains, and the unstoppable force of disruptive innovation (or is it innovative disruption?) in science, technology, and medicine that create prosperity while improving productivity and efficiency. For example, the next generation of the internet (aka Web 3.0) is being built on blockchain technology today, which is setting the stage for mass adoption of both the technology (to revolutionize banking, contracts, cybersecurity, voting, and pretty much anything else you can think of) and cryptocurrencies. In fact, holding cryptocurrencies based on the most popular or highest-potential blockchain platforms has fast become an acceptable way to diversify an investor’s portfolio.
Value/Growth and Small/Large convergence update:
Ultimately, the Value/Growth and Small/Large relative performance story is reflected in market breadth. Narrow market leadership in a rising market usually indicates outperformance of the large-cap, secular-growth Tech juggernauts and, by extension, the cap-weighted indexes. Broad market participation in a rising market often indicates outperformance of the equal-weighted indexes, small and mid-caps, the value factor, and cyclical sectors (particularly the transportation segment). The chart below illustrates various performance differentials so far in 2021 for several representative ETFs, including the cap weighted SPDR S&P 500 (SPY), Invesco S&P 500 Equal Weight (RSP), Invesco S&P 600 Small Cap Pure Value (RZV), Invesco S&P 500 Large Cap Pure Growth (RPG), and the iShares Transportation Average (IYT).
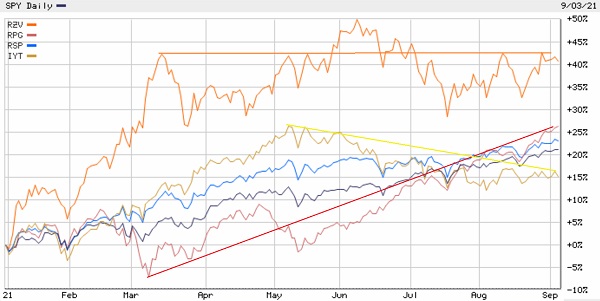
You can see that the resurgence of small caps and the value factor (along with bond yields – i.e., the “reflation trade”) culminated in a “blow-off top” in mid-March. Since then, the RZV (orange line) has gone sideways (except for a brief burst in June) while large caps and the growth factor (red line) have been surging ahead (and bond yields have fallen). The transports (yellow line) peaked in May and have been in a downtrend since then, which is worrisome for the economy, from an historical perspective, but might be simply another reflection of disrupted supply chains. With the global economy moving past the speculative recovery period, the market bifurcation in Value/Growth and Small/Large appears to be reestablishing itself, at least for the moment, in what I believe is a portfolio rebalancing due to: 1) concern about a possible global economic slowdown, and 2) tacit acknowledgement that inflation won’t be so big of a deal a year from now.
Not surprisingly, according to S&P Dow Jones Indices, the Pure Growth and Momentum factors led the pack in August, and the mega caps outperformed. Many of the small, high-growth stocks have taken a hit despite great earnings reports, including top-performing Baker’s Dozen holding Digital Turbine (APPS) – although it just got a boost when it was picked to be added to the S&P MidCap 400 Index. It seems that investors have been seeking the perceived safety of large-cap, secular-growth Tech (which has boosted the major cap-weighted indexes) given their market dominance, strong cash flows and cash balances, high margins and operating leverage, and low correlation with the economic cycle (i.e., “all-weather” performance).
Final comments:
Some observers have suggested that a broad market correction has already been in progress but has been disguised by the internal capital rotation into mega-cap growth stocks since June. This is reminiscent of the summer of 2018, driven by escalation in the trade war with China, which of course culminated in the Q4 2018 selloff. This is one reason why institutional investors have taken some chips off the table. Moreover, I think the defensive rotation and institutions lightening up on equities (while going long volatility) also being driven by: 1) an acknowledgement that nothing goes up in a straight line, so a correction is likely…and the longer it goes without a correction the more severe the correction is likely to be, and 2) uncertainty about how much underlying damage was actually done to our previously strong economy and how long it might actually take to fully recover.
To further drive home the point about economic uncertainty, the New York Fed’s Nowcast model has been temporarily suspended. Here is the notification: “The uncertainty around the pandemic and the consequent volatility in the data have posed a number of challenges to the Nowcast model. Therefore, we have decided to suspend the publication of the Nowcast while we continue to work on methodological improvements to better address these challenges.” Pretty amazing. We at Sabrient can certainly relate to external factors and market manipulations causing a quant model to be less predictive, necessitating the need for enhancements. In our case, the anomalous market conditions of 2018-19 led us to develop important changes to our model to make it more all-weather.
But ultimately, share prices are driven by earnings and interest rates – both of which are highly supportive – but also by investor sentiment, i.e., how much do they believe in the future strength of the economy and what valuations are they willing to pay. For example, if investors have no interest or faith in owning cyclical stocks (like was the case in summer 2018) due to a lack of confidence in the economy, then those share prices will languish no matter how low their P/Es fall (even to low single digits). One way of assessing sentiment is through the equity risk premium (ERP), which is the additional return investors demand for owning equities rather than a “risk free” bond. The inverse of P/E is E/P, or earnings yield, and a common way of measuring equity risk premium is to subtract the risk-free interest rate from earnings yield. Today, with the market P/E still elevated (although lower than it was at the start of the year), the ERP remains low, meaning that investors are generally comfortable holding equities (even if they rotate a bit more defensive at times). By the way, this is further corroborated by the low VIX and tight credit spreads (both IG and HY).
Yes, I still believe we are in a “Roaring ‘20s redux” from 100 years ago, with a more modest inflationary climate than many are forecasting and an extended expansionary economic cycle. Thus, I continue to suggest that long-term investors remain bullish and invested in both value/cyclicals and secular growth stocks, and across market caps, but with a greater focus on quality now that we are past the exuberant speculative phase. Defensive investors may prefer an overweight on large-cap, secular-growth Tech and high-quality dividend payers.
SPY Chart Review:
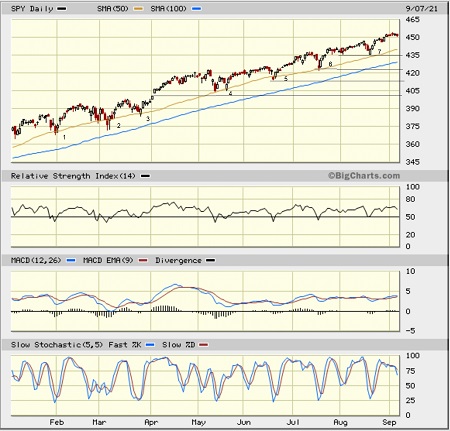
The SPDR S&P500 Trust (SPY) hit a new high of 454.05 last week. Looking at the 2021 YTD chart, we can see that it has tested the 50-day simple moving average (SMA) seven times this year and then reversed to hit a new all-time high each time. It has seen quite a long stretch without a 5% correction, and there hasn’t been a test of support at the 200-day SMA since June 2020. The gap between the uptrend line and the 200-day has remained pretty constant all year. If you pull up a monthly chart, it looks more parabolic and ominous, with 7 positive months in a row (the longest streak in over 30 years) and 14 of the past 17 months (since the March 2020 pandemic low). There are bullish gaps that remain unfilled, including down around 400, and a test of the 200-day SMA will come at some point. Oscillators RSI, MACD, and Slow Stochastics are all curling over and pointing downward for perhaps another test of the 50-day. But again, I would see any significant correction as a long-term buying opportunity.
Latest Sector Rankings:
Relative sector rankings are based on our proprietary SectorCast model, which builds a composite profile of each of over 1,000 equity ETFs based on bottom-up aggregate scoring of the constituent stocks. The Outlook Score employs a forward-looking, fundamentals-based multifactor algorithm considering forward valuation, historical and projected earnings growth, the dynamics of Wall Street analysts’ consensus earnings estimates and recent revisions (up or down), quality and sustainability of reported earnings, and various return ratios. It helps us predict relative performance over the next 2-6 months.
In addition, SectorCast computes a Bull Score and Bear Score for each ETF based on recent price behavior of the constituent stocks on particularly strong and weak market days. A high Bull score indicates that stocks within the ETF recently have tended toward relative outperformance when the market is strong, while a high Bear score indicates that stocks within the ETF have tended to hold up relatively well (i.e., safe havens) when the market is weak.
Outlook score is forward-looking while Bull and Bear are backward-looking. As a group, these three scores can be helpful for positioning a portfolio for a given set of anticipated market conditions. Of course, each ETF holds a unique portfolio of stocks and position weights, so the sectors represented will score differently depending upon which set of ETFs is used. We use the iShares that represent the ten major U.S. business sectors: Financial (IYF), Technology (IYW), Industrial (IYJ), Healthcare (IYH), Consumer Goods (IYK), Consumer Services (IYC), Energy (IYE), Basic Materials (IYM), Telecommunications (IYZ), and Utilities (IDU). Whereas the Select Sector SPDRs only contain stocks from the S&P 500 large cap index, I prefer the iShares for their larger universe and broader diversity.
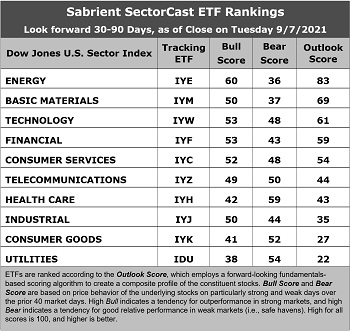
Here are some of my observations on this week’s scores:
1. The rankings look quite bullish, topped by deep cyclicals Energy and Basic Materials with Outlook scores of 83 and 69, respectively. You would expect strength in cyclical sectors given their high earnings leverage within a robust expansionary economy and solid oil and commodity prices. Technology moves up to the third spot with a 61. Energy enjoys strong analyst sentiment (recent positive net revisions to EPS estimates), strong insider sentiment, the most attractive forward P/E of 12.2x, and a modest forward PEG (forward P/E divided by projected EPS growth rate) of 1.29. After dwelling in or near the cellar for much of the past few years, Energy has been looking quite solid all year, with oil again challenging $70. Basic Materials displays good analyst sentiment, an attractive forward P/E of 15.1x, and the lowest forward PEG of 1.03. Rounding out the top five are Financial and Consumer Services (Discretionary/Cyclical), and all five have Outlook scores above 50.
2. At the bottom are Utilities and Consumer Goods (Staples/Noncyclical) with Outlook scores of 22 and 27, respectively. Utilities is in the cellar primarily due to having little in the way of positive earnings revisions, a low projected EPS growth rate of 5.5%, and by far the highest forward PEG of 3.82.
3. Looking at the Bull scores, Energy has the top score of 60, as stocks within these sectors have displayed relative strength on strong market days. Utilities scores the lowest at 38. The top-bottom spread of 22 points reflects low sector correlations on strong market days. It is desirable in a healthy market to see low correlations reflected in a top-bottom spread of at least 20 points, which indicates that investors have clear preferences in the market segments and stocks they want to hold.
4. Looking at the Bear scores, Healthcare scores the highest at 59 followed by Utilities at 54, as stocks within these sectors have been the preferred safe havens on weak market days. Energy displays the lowest score of 36, as investors have fled the sector during market weakness. The top-bottom spread of 23 points reflects low sector correlations on weak market days. Ideally, certain sectors will hold up relatively well while others are selling off (rather than broad risk-off behavior), so it is desirable in a healthy market to see low correlations reflected in a top-bottom spread of at least 20 points.
5. Energy displays the best all-around combination of Outlook/Bull/Bear scores, while Utilities is the worst. Looking at just the Bull/Bear combination, Technology and Healthcare display the highest score, indicating superior relative performance (on average) in extreme market conditions whether bullish or bearish, while Basic Materials scores the worst.
6. This week’s fundamentals-based Outlook rankings display a solidly bullish bias given that the top 5 sectors are considered either cyclical (i.e., highly economically sensitive) or all-weather, while the bottom two are both defensive sectors. Keep in mind, the Outlook Rank does not include timing, momentum, or relative strength factors, but rather reflects the consensus fundamental expectations at a given point in time for individual stocks, aggregated by sector.
ETF Trading Ideas:
Our Sector Rotation model, which appropriately weights Outlook, Bull, and Bear scores in accordance with the overall market’s prevailing trend (bullish, neutral, or defensive), continues to display a bullish bias and suggests holding Energy (IYE), Technology (IYW), and Financial (IYF), in that order. (Note: In this model, we consider the bias to be bullish from a rules-based trend-following standpoint when SPY is above both its 50-day and 200-day simple moving averages.)
If you prefer a neutral bias, the Sector Rotation model suggests holding Energy, Basic Materials, and Technology, in that order. Or, if you are more comfortable with a defensive stance, the model suggests holding Healthcare, Technology, and Utilities, in that order.
An assortment of other interesting ETFs that are scoring well in our latest rankings include VanEck Vectors Steel (SLX), First Trust Indxx Global Natural Resources Income (FTRI), AdvisorShares Dorsey Wright ADR (AADR), Invesco Dynamic Market (PWC), WBI BullBear Yield 3000 (WBIG), Fidelity Stocks for Inflation (FCPI), Invesco Dynamic Semiconductors (PSI), Pacer US Small Cap Cash Cows 100 (CALF), iShares US Home Construction (ITB), Global X Blockchain (BKCH), First Trust Dorsey Wright Momentum & Value (DVLU), Sound Equity Income (SDEI), Invesco S&P SmallCap Consumer Discretionary (PSCD), First Trust Rising Dividend Achievers (RDVY), VanEck Vectors Unconventional Oil & Gas (FRAK), LeaderShares AlphaFactor US Core Equity (LSAF), Invesco S&P SmallCap Value with Momentum (XSVM), Invesco Dynamic Building & Construction (PKB), AdvisorShares Alpha DNA Equity Sentiment (SENT).
As always, I welcome your thoughts on this article! Please email me anytime. Any and all feedback is appreciated!
IMPORTANT NOTE: I post this information periodically as a free look inside some of our institutional research and as a source of some trading ideas for your own further investigation. It is not intended to be traded directly as a rules-based strategy in a real money portfolio. I am simply showing what a sector rotation model might suggest if a given portfolio was due for a rebalance, and I do not update the information on a regular schedule or on technical triggers. There are many ways for a client to trade such a strategy, including monthly or quarterly rebalancing, perhaps with interim adjustments to the bullish/neutral/defensive bias when warranted, but not necessarily on the days that I happen to post this article. The enhanced strategy seeks higher returns by employing individual stocks (or stock options) that are also highly ranked, but this introduces greater risks and volatility. I do not track performance of the ideas mentioned here as a managed portfolio.
Disclosure: At the time of this writing, among the securities mentioned, the author held a long position in APPS and protective puts on SPY and IWM.
Disclaimer: This newsletter is published solely for informational purposes and is not to be construed as advice or a recommendation to specific individuals. Individuals should take into account their personal financial circumstances in acting on any opinions, commentary, rankings, or stock selections provided by Sabrient Systems or its wholly owned subsidiary, Gradient Analytics. Sabrient makes no representations that the techniques used in its rankings or analysis will result in or guarantee profits in trading. Trading involves risk, including possible loss of principal and other losses, and past performance is no indication of future results.
