Sector Detector: A surprisingly strong 2017 makes way for a promising 2018
 by Scott Martindale
President, Sabrient Systems LLC
The S&P 500 finished 2017 by completing an unusual feat. Not only was the index up +22% (total return), but every single month of the year saw positive performance on a total return basis, and in fact, the index is on a 14-month winning streak (Note: the previous record of 15 straight was set back in 1959!). So, as you might expect, volatility was historically low all year, with the VIX displaying an average daily closing value of 11 (versus a “fear threshold” of 15 and a “panic threshold” of 20). But some of 2017’s strength was due to expansion in valuation multiples in anticipation of tax reform and lower effective tax rates boosting existing earnings, not to mention incentives for repatriating overseas cash balances, expansion, and capex.
Sector correlations also remained low all year, while performance dispersion remained high, both of which are indications of a healthy market, as investors focus on fundamentals and pick their spots for investing – rather than just trade risk-on/risk-off based on the daily news headlines and focus on a narrow group of mega-cap technology firms (like 2015), or stay defensive (like 1H2016). And Sabrient’s fundamentals-based portfolios have thrived in this environment.
Now that the biggest tax overhaul in over 30 years is a reality, investors may do some waiting-and-watching regarding business behavior under the new rules and the impact on earnings, and there may be some normalization in valuation multiples. In other words, we may not see 20% gains in the S&P 500 during 2018, but I still expect a solidly positive year, albeit with some elevated volatility.
In this periodic update, I provide a market outlook, conduct a technical analysis of the S&P 500 chart, review Sabrient’s latest fundamentals-based SectorCast rankings of the ten US business sectors, and offer up some actionable ETF trading ideas. In summary, our sector rankings still look bullish, while the sector rotation model also maintains its bullish bias. Read on....
Market Commentary:
As I start another year of writing this newsletter, it would be great to get some feedback from my readers. For example, would you prefer to see shorter market commentary? Is the SPY chart analysis interesting to you? Do you find useful our sector rankings and highly-ranked ETFs? I don’t want to spend my time on content that you don’t find valuable. You can either reply to the email version of the newsletter or send your comments to sectordetector@sabrient.com.
It was an unusually eventful year when you consider all the turmoil surrounding President Donald Trump’s first year in office and divisive political rhetoric hitting a fever pitch, as well as synchronized global economic recovery, the biggest tax overhaul in over 30 years, historically low interest rates (including negative rates overseas), appointment of a new Federal Reserve chair (who is dovish like the outgoing chair), the marked rebound in oil and commodities, the bitcoin rocket ship (ultimately spilling into other cryptocurrencies), historically massive wildfires, floods, and hurricanes, North Korea missile launches and nuclear threats, national anthem protests against social injustice, eons of workplace sexual harassment finally confronted, the concert massacre in Las Vegas, a rare total solar eclipse, and incredible sports comebacks (including a Super Bowl having a record-breaking comeback and first-ever overtime). Also noteworthy this year, in April Sabrient began publishing a new Baker’s Dozen top picks list every month, rather than just twice a year – all of which have performed well in a climate in which fundamentals matter to investors.
US stocks were buoyed all year by strong global economic reports, rising corporate earnings, domestic deregulation, and massive global QE generating demand for the relative safety of US assets, resulting in a persistent uptrend with no significant corrections. The S&P 500 closed the year at 2673, so the 3000 mark is a mere 12% higher, which I think is achievable. I also think stocks may finally endure the significant correction that was so elusive last year, but it would mark a healthy cleansing that ultimately leads to higher prices for the next few years – barring any major disruptions from the myriad geopolitical risks, not the least of which is the global credit bubble and the need for careful deleveraging, especially in China (as it also navigates through a fundamental transition from disinflationary state-owned manufacturing to inflationary consumption and spending among its burgeoning middle class).
Looking at ETFs representing various market segments, the S&P 500 (SPY) was up only +0.7% in December, but some segments did much better. Standouts during the month included Oil & Gas Equipment (XES), Steel (SLX), Transportation (IYT), and Retail (XRT). For the full-year, the SPY finished +22%, the Dow (DIA) +28%, Nasdaq 100 (QQQ) +32%, Nasdaq Composite (ONEQ) +29%, S&P Mid Cap 400 (MDY) +16%, Russell 2000 Small Caps (IWM) +13%, and S&P Small Cap 600 (SLY) +13%.
The year was characterized by strong performance in the Momentum factor at the expense of Value, Quality, and Low-Volatility factors, although Value and Quality kept pace or outperformed after the market’s slight dip in August, when investors noticeably started focusing more on fundamentals. While the SPY was up +22% for full-year 2017, S&P 500 Growth (SPYG) was +28% versus S&P 500 Value (SPYV) +15%. Looking at the sectors within the S&P 500, Information Technology was by far the top performer for 2017 at +40%, followed by Materials, Consumer Discretionary, Financial, and Healthcare, which were all around +22-23%, and then Industrials at +20%. Energy and Telecom were the only sectors to be in the red for the year, although Energy had a nice resurgence late in the year.
Oil closed the year right at $60, and its strength has provided a welcome boost to the US and Canada. Commodities are suddenly perking up, as well, as they are historically cheap relative to stocks. Jeffrey Gunlach of DoubleLine Capital observed, “…the value in commodities is, historically, exactly where you want it to be a buy.”
Emerging markets have benefited, too, including Brazil and Russia, both of which had been languishing in deep recession. India also has been quite strong. Looking at other developed markets, Japan has benefited from new fiscal stimulus added to continued monetary stimulus, while the Eurozone has been boosted by its own continued monetary stimulus coupled with improving domestic demand.
As for China, rather than continuing to grow through manufacturing and exports (and a large current account surplus) by leveraging low labor costs, state-run enterprises, and state support of private business, which is disinflationary, the country’s leadership has been trying to boost domestic consumer consumption and spending (reducing its current account surplus), which is inflationary, while simultaneously deleveraging its dangerous credit bubble. Nevertheless, the World Bank has bumped up its expected 2017 GDP to +6.8% and forecasts only a modest slowdown to +6.4% in 2018 and +6.3% in 2019. My hope is that China can indeed engineer its way through this fundamental transition and deleveraging process without a major disruption to the global economy.
In the US, The BEA’s final estimate of real GDP in Q3 came in at 3.2%, and for Q4, the Atlanta Fed’s GDPNow model is now forecasting 2.8% (as of December 19, down from 3.3% on December 19, but an update is coming on January 3), while the New York Fed’s Nowcast model projects 3.9% (as of December 29). Corporate Profits surged to a new high of an annualized $1.854 trillion, putting the year-over-year change at +10%. Housing has been particularly strong, with some calling it the biggest story of 2017. Investor Sentiment, Consumer Sentiment, and Consumer Confidence (a 17-year high in November!) all remain strong. New Jobless Claims remain near the lows of the economic expansion, so despite hearing a constant storyline about the labor market under attack by robots, AI, and productivity-improving technologies, hiring has still managed to achieve a post-recession high.
The CBOE Market Volatility Index (VIX), aka “fear gauge,” closed the year at a modest 11.04, which is about equal to the year’s average daily closing value. There hasn’t been a significant market correction since February 2016, and VIX has not approached the 20 “panic threshold” since right before the November 2016 election. But low volatility is the historical norm when economic growth is stable and positive, and it is further supported by the healthy market breadth and low sector correlations. IndexIQ analysis showed that the annualized volatility for 2017 was 6.75%, which is second only to 1964 (at 5.24%) as the lowest, while the largest drawdown during the year was 2.80%, which is second only to 1993 (at 2.53%).
The December FOMC meeting resulted in another quarter-point hike, as expected, which was the third such hike in 2017, putting the fed funds rate in a range of 1.25-1.50%. For 2018, the latest Fed "dot plot" projects another three rate hikes, which would bring the target rate to a 2.00-2.25% range. The median long-run short-term rate is 2.75%. Meanwhile, the 10-year Treasury closed 2017 at 2.41%, with the 2-year at 1.88%. So, the closely-watched 2-10 spread continues to flatten, sitting at only 53 bps (the lowest since 2007), which is well under the 100 bps “normalcy threshold,” 101 bps on Election Day, and 136 bps immediately following the November 2016 election.
Rather than steepening as almost all observers predicted, the spread continues to narrow, and in fact, Morgan Stanley has predicted that the yield curve will become completely flat sometime in 2018 with all Treasury yields converging in the 2.00-2.25% range. But I have been saying for quite a while that global dynamics would keep Treasury yields low, so long as the Fed remains slow and cautious in their path toward normalization while other central banks continue QE. For example, 10-year government yields are 0.42% in Germany and 0.04% in Japan, sending global investors into the US seeking risk-free returns on the carry trade, and demand is further supported by aging demographics in developed countries and consistent capital inflows into fixed income funds (largely from 401k and IRA accounts for formulaic strategic allocations). When the 10-year Treasury yield reaches 3.0% again is anyone’s guess, but it appears to me that 2.6% is a yield that has attracted a strong bid. Moreover, the global economy has become heavily leveraged on cheap debt, while investors have increasingly exposed themselves to higher duration at lower yields as their investment capital has poured into fixed income, so all central banks will likely take great pains to avoid upsetting the applecart via aggressive tightening.
Of course, the big news in December was the passage of a tax reform bill, right before Christmas, which cut corporate rates to 21% – the lowest in 68 years and instantly making the US one of the world’s most business-friendly countries. You might recall that I have long advocated for such fiscal stimulus as a way to offset much of the inequity that has arisen from our sole reliance on the Federal Reserve’s monetary policy for the past 9 years, which rather than incentivizing capex and hiring, has served only to create asset inflation, which has served well those who already owned assets (such that an oil painting actually sold for $450 million!), but also has produced byproducts like wage stagnation, income inequality, and a huge wealth gap, leading to a troubling populist movement and class warfare. In support of the tax bill, Republican Congressman Peter Roskam of Illinois said, “It is the status quo that is serving the few...We're proposing the economics of opportunity, not the economics of envy.” I second his sentiment, although “the system” (including an entrenched Deep State with unfettered spending, entitlements, waste, regulation, and pension liabilities) needs a lot more fixing than just this tax bill will be able to provide. Nevertheless, it’s a promising start. Notably, passage of tax reform immediately changed the nature of money flows into sector ETFs, with Technology being passed over – at least temporarily – in favor of Financials, Energy, Materials, Industrials, as these are the sectors widely expected to benefit the most from lower effective tax rates, deregulation, and infrastructure spending.
So, equity investors are encouraged by synchronized global economic expansion, impressive US economic reports, strong (and improving) corporate cash flow and earnings (perhaps 10% or more earnings growth for 2018), high corporate cash balances, low inflation (and the futures market isn’t expecting much of it even five years out), a still-accommodative Fed (guarding against causing disruptive financial shocks), low interest rates, an upsloping yield curve, persistent investor caution (especially among institutions and hedge funds), no threat of recession anytime soon, continual progress in loosening the regulatory noose, and the biggest tax overhaul in a generation – incentivizing business expansion; domestic relocation and reversed tax inversions; new capex, hiring, and production; higher dividends, more share buybacks, and M&A (targeting small and micro caps). Moreover, technological breakthroughs continue to disrupt and revolutionize the economy; there is a dwindling number of publicly-traded companies and shares outstanding being chased by abundant global capital (i.e., supply/demand dynamics); and we seem to be seeing the start of a sustained rotation and broadening from the mega caps and the Growth and Momentum factors into small caps and the Value and Quality factors. In addition, investors like the US for its safety, stability, innovation, productivity, and work ethic.
Some say the bull market has become long in the tooth, but bull markets historically tend to end with economic recessions and inverted yield curves, neither of which are imminent. And with our government’s legacy method of computing GDP unable to appropriately account for the huge productivity-boosting and disinflationary impact of disruptive technologies like cloud computing, mobile devices, robotics, nanotech, and artificial intelligence (AI), inflation remains muted, keeping aggressive Fed tightening at bay. It seems to me that our sluggish economic growth has allowed us to avoid the usual “boom” part of the boom & bust cycle, thus deferring the “bust” stage. In fact, I think it is possible that the corporate profit recession from 1Q2014 through 2Q2016 may have been a de facto mild recession for the economy that led to a fresh early recovery stage of the business cycle (historically led by Industrials, Materials, and Energy sectors).
Furthermore, history shows that a relatively flat (but not inverted) yield curve has been a leading indicator of a prolonged economic expansion, and not a warning flag of imminent recession. History also indicates that stocks tend to do well during this phase of the Fed tightening cycle. Longer term Treasuries are unlikely to either rise or fall very much, further making equities attractive for capital appreciation potential. And rather than the irrational exuberance of 2000, “Rational exuberance is the stock market’s theme for 2018”, says Goldman Sachs’ chief US equity strategist, David Kostin. So, even beyond 2018, it seems to me that US stocks have some years left in this uptrend.
As we enter 2018, our SectorCast model gives top rankings to economically-sensitive sectors Financial and Technology, and I think Technology is likely to remain at or near the top long into the future for a couple of reasons. First, Tech is the only sector in the S&P 500 that gets more than 50% of its revenue from overseas, so it will benefit from the expected synchronized global growth. Second, all other sectors rely on new technologies to improve service and productivity, so Tech rides along with (and often drives) growth in all other sectors. In 2018, some of the biggest growth trends are expected to be in robotics and automation – with changes coming more quickly than most people expect.
Other market positives include lower sector correlations and higher performance dispersion among stocks. Nicholas Colas and Jessica Rabe write an insightful market newsletter called DataTrek that I enjoy reading. In a recent article, they observed that, rather than seeing only a handful of mega-caps leading the market higher while the rest languished, almost half of the stocks in the S&P 500 outperformed the overall index during 2017, while nearly a quarter of the stocks actually had negative absolute performance (in a year in which the S&P 500 was up +22%). They further pointed out that sector correlations from 2009 (when the Federal Reserve’s QE printing press and ZIRP policies kicked in) until the US presidential election in November 2016 consistently averaged around 80%, but then correlations plummeted immediate following the election and have remained desirably low ever since. For most of 2017, sector correlations fluctuated around 50%, which reflects a healthy market, with both winners and losers as fundamentals mattered to investors. This bodes well for fundamentals-based strategies and active management in which sound research and skilled security selection pays off.
Indeed, Sabrient’s fundamentals-based GARP (growth at reasonable price) selection strategy has thrived in these market conditions. From launch dates through year end, the theoretical performance of equal-weighted versions of our 2017 monthly Baker’s Dozen portfolios (having at least a couple of monthly history) have outperformed the S&P 500 benchmark (with some more than doubling the benchmark). You can see the performance of these model portfolios and their constituent holdings by visiting: http://bakersdozen.sabrient.com. (Of course, past performance is no guarantee of future results, and investors would be wise to remember that trading and investing always involve risk.)
But our flagship product since 2009 has been our January portfolio, and we have been hard at work running our models and analyzing candidate stocks for the new portfolio, which will be announced on January 19. For the January portfolio, we publish a detailed report that includes a market outlook, a process overview, and a rundown of the 13 new selections, and you can get ahold of this report either by purchasing it online or by becoming a subscriber to our Financial Advisor research package. Alternatively, advisors who intend to buy the associated unit investment trust (UIT) offered by First Trust Advisors in their clients’ accounts can request the report sent to them for free by emailing us at support@sabrient.com.
I will provide more information on our market outlook, including discussion of market valuations and risks to our bullish thesis, in the Baker’s Dozen report that we will publish on January 19. So today, I thought it would be worthwhile to remind you about our Baker’s Dozen selection process, which I like to describe as “a quantamental GARP approach with a forensic accounting backstop”:
Sabrient Systems LLC was founded in 2000 by David Brown, a former NASA scientist whose team designed the landing gear for the Apollo 11 lunar landing module. He also earned an MBA and later began applying his techniques in building multifactor quantitative models to the investment world. At Sabrient, he brought on other engineers who also hold MBAs or economics degrees (for example, I began my career as a structural engineer for Chevron, designing offshore oil platforms). For our first several years, we strictly ran quantitative fundamentals-based multifactor models to create purely algorithmic rankings of stocks and ETFs, as well as 100% rules-based indexes for ETFs. In 2009, we began publishing an annual top picks list that we dubbed the Baker’s Dozen. But rather than letting an algorithm select this more-concentrated portfolio, we initiated a process that starts with a bottom-up quantitative GARP model to prescreen a large eligible universe, and then employs an in-depth (but still mostly number-driven) fundamental analysis of approximately 50 candidates – i.e., a “quantamental” approach.
Because Sabrient’s models rely on historical trends and forward projections of earnings (which are based on – and can be manipulated by – a company’s accounting practices), we felt it was important to have in-house expertise in the critical examination of financial statements (especially trends in accruals, working capital, and cash flow metrics) to help vet long positions. So, in 2011, Sabrient acquired Gradient Analytics LLC and its team of forensic accounting specialists, many of whom hold CFA and CPA credentials, having advanced training in the analysis of the quality and sustainability of reported earnings as well as anomalous insider trading activity. Gradient reviews 10-Ks and 10-Qs, including the footnotes and disclosures, as well as equity incentives and insider selling activity, and corporate governance. They are not investigative reporters, so they only have access to public information, but their analysis helps us stack the odds a little bit more in our favor. Although they can’t catch everything that may be lurking in a company’s closet, there are numerous examples of stocks that initially scored well in the raw quant model but were eliminated during Gradient’s under-the-hood examination and ultimately performed poorly.
In essence, Sabrient’s quantitative GARP prescreen considers historical and forecasted earnings trends and valuations, the dynamics of sell-side analysts’ recent revisions to EPS estimates, and earnings quality. We seek an average forward PEG (current share price divided by EPS estimates for the next 12 months divided by expected year-over-year EPS growth rate) that is well under the broad index, targeting under 0.5 while S&P500 is usually over 1.5. Indeed, our monthly Baker’s Dozen portfolios during 2017 have averaged even lower forward PEG ratios in the range of 0.20-0.30. So, although the market is generally considered to be highly valued, it has been driven primarily by the mega-cap names and the major cap-weighted market indexes, while we continue to find many other stocks displaying attractive forward valuations.
Looking back, our annual January Baker’s Dozen portfolios have, on a cumulative basis, substantially outperformed the S&P 500 benchmark over their 9-year history (2009-2017), and the only period of persistent underperformance was a 12-month timeframe from June 2015 through June 2016 (impacting both the 2015 and 2016 portfolios) in which the market was narrow (led by “FANG” or “FAAMG”), news-driven, and risk-on/risk-off rather than fundamentals-driven. However, investors have been more rational and quality-oriented since the Brexit vote in June 2016, and especially since the US presidential election, which has led to the healthy fundamentals-driven climate.
With elevated valuations among the big-cap Technology names, we continue to see indications of a passing of the baton to smaller players and other market segments that not only display more attractive forward valuations but also may be the bigger beneficiaries of the tax bill, deregulation, and potential infrastructure spending. Sabrient’s fundamentals-based models are designed to outperform in a healthy “rational” market. As David Brown and his team make final selections for the January 2018 Baker’s Dozen over the next couple of weeks, I and others from the team (including Gradient’s Brent Miller and Byron MacLeod) are looking forward to spending some time on the road traveling with our partners at First Trust and speaking with financial advisors across the country!
SPY Chart Review:
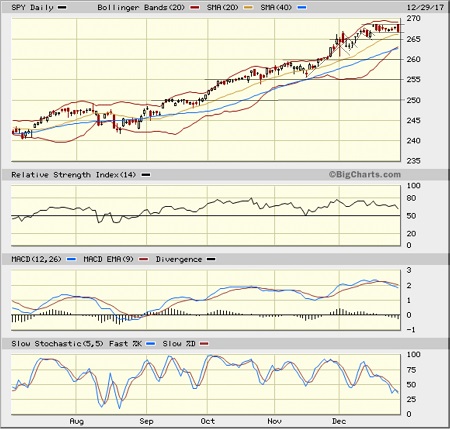
The SPDR S&P 500 ETF (SPY) closed 2017 at 266.94 in its persistent march higher. As I said last month, one convincing breakout above resistance is followed by another, with each round-number level (e.g., 250, 255, 260, 265) providing temporary resistance. After the strong breakout through 260 in late November, SPY quickly ran up to 265 where it formed a bull flag continuation pattern, followed by another one with a shorter “pole,” each time seemingly pausing to wait for the moving averages to catch up as the proverbial “rubber band” got too far stretched. After the last flag pattern, price gapped up (on good news about the tax bill), but immediately moved back down to “fill the gap,” and then started forming a narrow sideways channel through year-end, as Bollinger Bands pinch closer together. Notably, the last trading day displayed a bearish engulfing candle, with a steep late-day selloff (taking it to the bottom of the sideways channel), likely due to institutional rebalancing, booking solid profits on their winners, and taking offsetting tax losses on losers. We will see whether the bearish finish spills over into early January, and indeed oscillators RSI, MACD, and Slow Stochastic all seem to want to cycle further down. But given the positive fundamentals and rising optimism about the impact of the tax bill, the bearish last day of the year might be just a short-lived one-day event. SPY closed the year just above its 20-day SMA (now near 266), which has been providing strong support since the recovery from the late-August dip. Further support levels come in at the 50-day SMA near 262, a prior breakout level at 260, the 100-day SMA around 255, another previous breakout level at 250, and the critical 200-day SMA down near 248. As a reminder, SPY hasn’t tested its 200-day SMA since the November 2016 election.
Latest Sector Rankings:
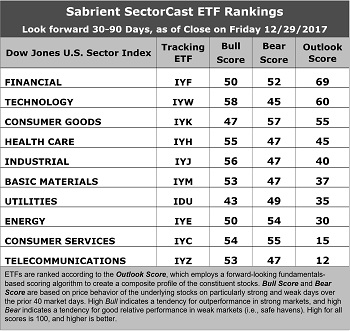
Relative sector rankings are based on our proprietary SectorCast model, which builds a composite profile of each of over 600 equity ETFs based on bottom-up aggregate scoring of the constituent stocks. The Outlook Score employs a forward-looking, fundamentals-based multifactor algorithm considering forward valuation, historical and projected earnings growth, the dynamics of Wall Street analysts’ consensus earnings estimates and recent revisions (up or down), quality and sustainability of reported earnings, and various return ratios. It helps us predict relative performance over the next 1-3 months.
In addition, SectorCast computes a Bull Score and Bear Score for each ETF based on recent price behavior of the constituent stocks on particularly strong and weak market days. High Bull score indicates that stocks within the ETF recently have tended toward relative outperformance when the market is strong, while a high Bear score indicates that stocks within the ETF have tended to hold up relatively well (i.e., safe havens) when the market is weak.
Outlook score is forward-looking while Bull and Bear are backward-looking. As a group, these three scores can be helpful for positioning a portfolio for a given set of anticipated market conditions. Of course, each ETF holds a unique portfolio of stocks and position weights, so the sectors represented will score differently depending upon which set of ETFs is used. We use the iShares that represent the ten major U.S. business sectors: Financial (IYF), Technology (IYW), Industrial (IYJ), Healthcare (IYH), Consumer Goods (IYK), Consumer Services (IYC), Energy (IYE), Basic Materials (IYM), Telecommunications (IYZ), and Utilities (IDU). Whereas the Select Sector SPDRs only contain stocks from the S&P 500 large cap index, I prefer the iShares for their larger universe and broader diversity.
Here are some of my observations on this week’s scores:
1. Financial has suddenly leapt to the top of the rankings with an Outlook score of 69, although this is relatively low for the top ranking. Sell-side analysts have broadly revised EPS estimates upward for stocks within the sector likely due to passage of the tax bill and an expectation of higher interest rates. Also, the forward P/E (17.5x) is among the lowest (along with Healthcare at 17.4x). Technology takes the second spot with an Outlook score of 60. Tech displays a strong projected EPS year-over-year growth rate of 15.0%, the highest return ratios, and a low forward PEG of 1.20 (ratio of forward P/E to forward EPS growth rate), although sell-side analysts have not been offering up as much in the way of positive revisions lately. Still, Tech’s forward PEG is second only to Energy at 0.72. In third place sits Consumer Goods (Staples/Noncyclical) at 55, and the rest of the sectors all score below 50. Rounding out the top six are Healthcare, Industrial, and Basic Materials.
2. Energy continues to stay out of the bottom two on the strength of its sell-side analyst sentiment (i.e., positive EPS revisions) and the strongest projected year-over-year EPS growth rate (33%), which is why its forward PEG is so low (0.72) despite a high forward P/E (24.0x). Telecom and Consumer Services (Discretionary/Cyclical) sit at the bottom with Outlook scores of 12 and 15, respectively. Telecom displays generally weak scores across the board, including the highest forward P/E (25.7x) and second-highest forward PEG (3.27), while Consumer Services has seen reductions to its projected year-over-year EPS growth rate and so a rising forward PEG.
3. Looking at the Bull scores, Technology has the top score of 58, followed by Industrial at 56, as these sectors have displayed relative strength on strong market days. Two defensive sectors have the lowest scores: Utilities at 43 and Consumer Goods (Staples/Noncyclical) at 47. The top-bottom spread is 15 points, which reflects somewhat low sector correlations on strong market days. It is desirable in a healthy market to see low correlations reflected in a top-bottom spread of at least 20 points, which indicates that investors have clear preferences in the market segments and stocks they want to hold (rather than broad risk-on behavior).
4. Looking at the Bear scores, we find Consumer Goods (Staples/Noncyclical) at the top with a score of 57, followed by Consumer Services (Discretionary/Cyclical) at 55, which means that stocks within these sectors have been the preferred safe havens lately on weak market days. Technology has the lowest score of 45, as investors have fled during market weakness. However, the top-bottom spread is only 10 points, which reflects somewhat high sector correlations on weak market days. Ideally, certain sectors will hold up relatively well while others are selling off (rather than broad risk-off behavior), so it is desirable in a healthy market to see low correlations reflected in a top-bottom spread of at least 20 points.
5. Technology displays the best all-around combination of Outlook/Bull/Bear scores, while Telecom is by far the worst. Looking at just the Bull/Bear combination, Technology and Utilities are the best, indicating superior relative performance (on average) in extreme market conditions (whether bullish or bearish), while Telecom scores the worst, as investors have generally avoided the sector.
6. This week’s fundamentals-based Outlook rankings still reflect a bullish bias, given that five of the top six sectors are economically-sensitive or all-weather (Financial, Technology, Healthcare, Industrial, Materials). However, I am somewhat concerned about a lack of conviction in that only the top three are scoring above 50 and none are scoring above 70. Keep in mind, the Outlook Rank does not include timing, momentum, or relative strength factors, but rather reflects the consensus fundamental expectations at a given point in time for individual stocks, aggregated by sector.
ETF Trading Ideas:
Our Sector Rotation model, which appropriately weights Outlook, Bull, and Bear scores in accordance with the overall market’s prevailing trend (bullish, neutral, or defensive), still displays a bullish bias and suggests holding Technology (IYW), Industrial (IYJ), and Healthcare (IYH), in that order. (Note: In this model, we consider the bias to be bullish from a rules-based trend-following standpoint when SPY is above both its 50-day and 200-day simple moving averages.)
Besides iShares’ IYW, IYJ, and IYH, other highly-ranked ETFs in our SectorCast model (which scores nearly 700 US-listed equity ETFs) from the Technology, Industrial, Materials sectors include PowerShares Dynamic Semiconductors (PSI), US Global Jets (JETS), and PowerShares Dynamic Pharmaceuticals (PJP).
If you prefer a neutral bias, the Sector Rotation model suggests holding Financial, Technology, and Consumer Goods (Staples/Noncyclical), in that order. On the other hand, if you are more comfortable with a defensive stance on the market, the model suggests holding Consumer Goods (Staples/Noncyclical), Energy, and Financial, in that order.
An assortment of other interesting ETFs that are scoring well in our latest rankings include several Financial sector funds, including SPDR Regional Banking (KRE, which is the top-ranked ETF in our system right now), PowerShares KBW Bank (KBWB), iShares US Insurance (IAK), First Trust NASDAQ ABA Community Bank (QABA), iShares US Financial Services (IYG), and SPDR S&P Capital Markets (KCE). Others include Arrow QVM Equity Factor (QVM), PowerShares Contrarian Opportunities (CNTR), PowerShares S&P 500 High Beta (SPHB), First Trust Dow Jones Select MicroCap (FDM), WBI Tactical SMY Shares (WBIC), and iShares Edge MSCI USA Value (VLUE).
IMPORTANT NOTE: I post this information periodically as a free look inside some of our institutional research and as a source of some trading ideas for your own further investigation. It is not intended to be traded directly as a rules-based strategy in a real money portfolio. I am simply showing what a sector rotation model might suggest if a given portfolio was due for a rebalance, and I do not update the information on a regular schedule or on technical triggers. There are many ways for a client to trade such a strategy, including monthly or quarterly rebalancing, perhaps with interim adjustments to the bullish/neutral/defensive bias when warranted, but not necessarily on the days that I happen to post this article. The enhanced strategy seeks higher returns by employing individual stocks (or stock options) that are also highly ranked, but this introduces greater risks and volatility. I do not track performance of the ideas mentioned here as a managed portfolio.
Disclosure: The author has no positions in stocks or ETFs mentioned.
Disclaimer: This newsletter is published solely for informational purposes and is not to be construed as advice or a recommendation to specific individuals. Individuals should take into account their personal financial circumstances in acting on any opinions, commentary, rankings, or stock selections provided by Sabrient Systems or its wholly-owned subsidiary Gradient Analytics. Sabrient makes no representations that the techniques used in its rankings or analysis will result in or guarantee profits in trading. Trading involves risk, including possible loss of principal and other losses, and past performance is no indication of future results.