Sector Detector: Stocks break out as investors place their bets on endless monetary stimulus
The market broke out to the upside, as I predicted it would -- although the breakout came a good bit sooner than I anticipated. My expectation was that stocks would remain within their long-standing trading range until a clear upside catalyst emerged, such as improving Q2 earnings reports and forward guidance. But investors aren’t waiting around. Clearly, they are positioning in advance of the emergence of such catalysts. For now, fear of missing liftoff is stronger than fear of getting caught in a selloff. Rather than take the laundry list of uncertainties -- including Brexit, the US presidential election, global terrorism, civil strife here at home -- as reasons to run for the hills, investors seem to be confident that it means a continuation of the easy money spigot of accommodative monetary policies at home and abroad, and no Fed rate hikes. Some commentators are even predicting that “helicopter money” is in the cards. The expectation is that no stone will be left unturned to shore up the economy.
In this periodic update, I give my view of the current market environment, offer a technical analysis of the S&P 500 chart, review our weekly fundamentals-based SectorCast rankings of the ten U.S. business sectors, and then offer up some actionable ETF trading ideas.
Market overview:
Yes, the market broke out right smack dab in the middle of summer. The S&P 500 is now up about 6% YTD as of Monday’s close, and all year I have been predicting a double-digit gain by year end. However, given elevated valuation multiples, a continuation of this technical breakout will depend upon fundamental catalysts like improving forward revenue and earnings guidance. This would also help ensure improving internals, like growing market breadth, lower sector correlations, and a continued flight to fundamental quality, which we would expect to benefit fundamentals-based portfolio strategies like Sabrient’s. Notably, the fact that financials and transports have joined the rally bodes well for the bulls. Those were two lagging sectors that had been causing me some concern.
The Atlanta Fed’s GDPNow model is predicting an expected Q2 GDP growth rate of 2.4%. However, FactSet shows that 2016 S&P 500 EPS consensus estimates have dropped to $118.66, which implies a forward P/E of about 18x. Not so great. But for 2017, estimates are indicating $134.50/share, or a forward P/E of 16x, which seems ambitious.
The most unusual part of the current market action is that stocks are hitting all-time highs right after Treasury prices had just done the same. Normally, such strength in Treasuries indicates investor fear and a flight to extreme safety amidst a recessionary economic environment. But the difference today is the extreme levels of monetary stimulus (aka, free money) around the world facilitating a no-brainer carry trade and foreign capital flows into a nice safe return from US Treasuries, in addition to the money pouring into US stocks in search of even higher returns than what bonds currently offer.
Nevertheless, after weeks of falling to new all-time lows, Treasury yields have suddenly surged higher, with the 10-year Treasury yield closing Monday at 1.59% and the 30-year at 2.30%. This is up from the record lows a couple of weeks ago of 1.34% on the 10-year and 2.10% on the 30-year, but still quite low. The spread between the 10-year and 2-year (0.68%) has increased somewhat to 93 bps, but the yield curve remains relatively flat.
CME fed funds futures are now indicating a 12% probability of a rate hike in September, and 43% for at least one hike by December. This is up significantly from a couple of weeks ago (right after the Brexit vote) in which there was a distinct probability of a rate cut. In any case, monetary policy remains quite loose as M2 money supply has accelerated to an 8.2% annual rate in the first half of 2016, which is the fastest pace since 2012.
The dividend yield on the S&P 500 is 2.09%. The 30-year Treasury fell to that same level in February, which turned out to be a springboard for equities. After all, low interest rates make stocks all the more attractive, whether an investor is seeking income or growth -- at least until either bond yields increase substantially or corporate earnings fall. Today, markets continue to look healthier and investors appear to be betting on improving reports of growth in GDP and corporate earnings.
Looking back, market conditions during the August-February timeframe frustrated fundamental-driven portfolio strategies, as news about China growth rate, oil prices, and Fed policy buffeted stocks in a risk-on/risk-off fashion. Although on the surface, the major cap-weighted indexes held up okay during that period, if you pulled back the curtain there was very narrow market breadth characterized by a handful of big winners while most stocks languished, regardless of fundamentals.
To illustrate market breadth, you need only look at how large caps have performed versus smalls, and how cap-weighted indexes have performed against equal-weighted. In a healthy market, equal-weighting typically outperforms cap-weighting as stocks from various market segments garner investor attention, including many well-positioned small caps. But for 2015, the cap-weighted SPDR S&P 500 Index Trust (SPY) was up +1.2% while the Russell 2000 Equal Weight Index was down -10.7%, indicating an unhealthy performance spread of +12% in favor of the cap-weighted large caps.
However, ever since the market turned to the upside on February 11, the spread has swung dramatically the other way, indicating to me a significant broadening of the market, which is good both for active stock-picking (vs. passive indexing) and for equal weighting (vs. cap weighting). Indeed, from February 11 through Monday’s close (July 18), SPY is up +19.0% while the Russell 2000 Equal Weight Index is up +31.7%. Thus, the performance spread shows equal-weighted small caps outperforming the cap-weighted large caps by +12.7%. This illustrates improving market breadth and investor confidence.
Sabrient’s core portfolio selection approach is fundamentals-based, bottom-up, and numbers-driven, and relies on our data feed of forward estimates of earnings and revenue expectations from the Wall Street community of sell-side research analysts who closely follow these companies and their industries. Thus, our performance depends upon two things: First, fundamentals matter to investors, rather than simple risk-on/risk-off characterized by narrow leadership. Second, that Wall Street’s consensus estimates are “in the ballpark.” Last summer, those two essential characteristics didn’t exist, but now it appears that markets are broadening as uncertainty has been largely discounted and fundamentals seem to matter once again. (Note: Sabrient’s summer Baker’s Dozen portfolio will launch in mid-August.)
Crude oil closed Monday at around $45.20, which is in the Goldilocks range (not too hot, not too cold) of about $40-60. The CBOE Market Volatility Index (VIX), aka fear gauge, closed Monday at 12.44. It reached as high as 26.7 after the Brexit vote, but since then it has steadily fallen, and it is now well below the 15 threshold between fear and complacency.
SPY chart review:
The SPY closed Monday at 216.47 and is now at new all-time highs, eclipsing the previous high around 214 from May 2015. The market had been mired in a long-standing sideways channel, or trading range, generally between 200 and 210, with occasional failed breakouts above and below this range. A wider interpretation of the channel ranges from 190 to 212. With last week’s breakout, which has since been confirmed, the market is now somewhat overbought and likely to consolidate and perhaps test former resistance-turned-support at 214, 212, or 210. SPY is well above its 50-day, 100-day, and 200-day simple moving averages, but oscillators RSI, MACD, and Slow Stochastic all look ready to cycle lower. I said two weeks ago that the path of least resistance was to the upside, and indeed it was. But for now, bulls will be looking for corroborating evidence to take it higher.
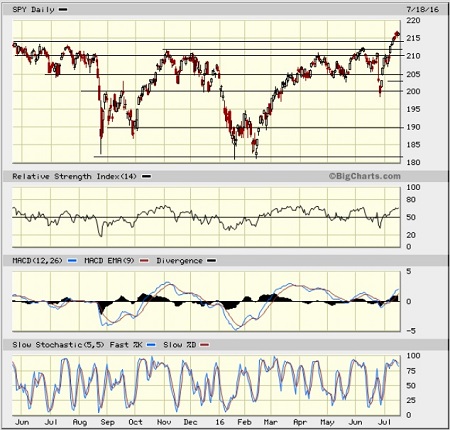
Again, the fact that the financials and transports are now participating is quite encouraging. Those were two lagging sectors that had been causing me some concern.
Latest sector rankings:
Relative sector rankings are based on our proprietary SectorCast model, which builds a composite profile of each equity ETF based on bottom-up aggregate scoring of the constituent stocks. The Outlook Score employs a forward-looking, fundamentals-based multifactor algorithm considering forward valuation, historical and projected earnings growth, the dynamics of Wall Street analysts’ consensus earnings estimates and recent revisions (up or down), quality and sustainability of reported earnings (forensic accounting), and various return ratios. It helps us predict relative performance over the next 1-3 months.
In addition, SectorCast computes a Bull Score and Bear Score for each ETF based on recent price behavior of the constituent stocks on particularly strong and weak market days. High Bull score indicates that stocks within the ETF recently have tended toward relative outperformance when the market is strong, while a high Bear score indicates that stocks within the ETF have tended to hold up relatively well (i.e., safe havens) when the market is weak.
Outlook score is forward-looking while Bull and Bear are backward-looking. As a group, these three scores can be helpful for positioning a portfolio for a given set of anticipated market conditions. Of course, each ETF holds a unique portfolio of stocks and position weights, so the sectors represented will score differently depending upon which set of ETFs is used. We use the iShares that represent the ten major U.S. business sectors: Financial (IYF), Technology (IYW), Industrial (IYJ), Healthcare (IYH), Consumer Goods (IYK), Consumer Services (IYC), Energy (IYE), Basic Materials (IYM), Telecommunications (IYZ), and Utilities (IDU). Whereas the Select Sector SPDRs only contain stocks from the S&P 500, I prefer the iShares for their larger universe and broader diversity. Fidelity also offers a group of sector ETFs with an even larger number of constituents in each.
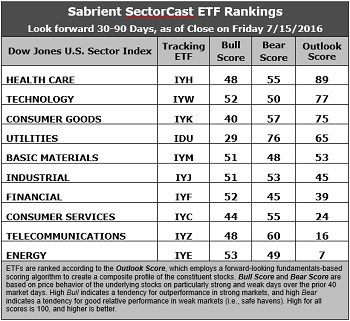
Here are some of my observations on this week’s scores:
1. Healthcare stays at the top of the rankings with an Outlook score of 89, displaying generally good factor scores across the board, including a forward P/E of about 16.5x and among the best Wall Street analyst sentiment (net revisions to earnings estimates). However, none of the sectors is reflecting very much in the way of positive sentiment at the moment. Technology remains in second place with a score of 77 and also shows good factor scores across the board, including a strong forward long-term growth rate (13.9%), solid return ratios, and the lowest forward PEG of 1.2. Consumer Goods (Staples/Noncyclical) takes the third spot with an Outlook score of 75, boasting the highest return ratios but also a relatively high forward PEG of 2.0. Rounding out the top of the rankings are Utilities, Basic Materials, Industrial, and Financial.
2. Although Utilities displays the best sell-side analyst sentiment (in the form of the least reduction to consensus earnings estimates), it also has by far the highest forward PEG of 3.8. Financial has fallen to seventh place despite displaying the lowest aggregate forward P/E (15.2x).
3. Energy and Telecom remain in the bottom two. Nevertheless, Energy displays the highest forward long-term growth rate of 14.7% (albeit because of such poor trailing earnings) and good sell-side sentiment (net revisions to earnings estimates), but it is held back by a high (and rising) forward P/E (32x) and weak return ratios. Telecom also displays a forward P/E of 26.7x and a forward long-term growth rate of only 9.4%, indicating a high (unattractive) forward PEG of 2.85.
4. Looking at the Bull scores, Energy has the top score of 53, followed closely by Technology and Financial, as they display relative strength on strong market days, while Utilities is the lowest at 29. The top-bottom spread is 24 points, which reflects low sector correlations on strong market days, which can be good for stock picking. It is desirable in a healthy market to see low correlations reflected in a top-bottom spread of at least 20 points, which indicates that investors have clear preferences in the stocks they want to hold (rather than broad risk-on behavior).
5. Looking at the Bear scores, Utilities (as usual) displays the top score of 76, which means that stocks within this sector have been the preferred safe havens on weak market days. Financial scores the lowest at 45, as investors flee during market weakness. The top-bottom spread is a big 31 points, which reflects quite low sector correlations on weak market days, which can be good for stock picking. Ideally, certain sectors will hold up relatively well while others are selling off (rather than broad risk-off behavior), so it is desirable in a healthy market to see low correlations reflected in a top-bottom spread of at least 20 points.
6. Healthcare displays the best all-around combination of Outlook/Bull/Bear scores, while Energy is the worst. However, looking at just the Bull/Bear combination, Telecom has suddenly become the best, followed by Utilities, indicating superior relative performance (on average) in extreme market conditions (whether bullish or bearish), while Financial, Consumer Goods (Staples/Noncyclical), and Consumer Services (Discretionary/Cyclical) are among the worst.
7. This week’s fundamentals-based Outlook rankings again look neutral to me, given that the top five include all-weather Healthcare, economically-sensitive Technology and Basic Materials, and defensive sectors Utilities and Consumer Goods (Staples/Noncyclical), while Industrial, Financial, and Consumer Services (Discretionary/Cyclical) all are scoring below 50. Keep in mind, the Outlook Rank does not include timing, momentum, or relative strength factors, but rather is a reflection of the fundamental expectations for individual stocks aggregated by sector.
ETF Trading Ideas:
Our Sector Rotation model, which appropriately weights Outlook, Bull, and Bear scores in accordance with the overall market’s prevailing trend (bullish, neutral, or defensive), still reflects a bullish bias and suggests holding Technology, Healthcare, and Basic Materials, in that order. (Note: In this model, we consider the bias to be bullish from a rules-based trend-following standpoint when SPY is above both its 50-day and 200-day simple moving averages.)
Besides iShares’ IYW, IYH, and IYM, other highly-ranked ETFs in our SectorCast model from the Technology, Healthcare, and Basic Materials sectors include First Trust NASDAQ Technology Dividend Index Fund (TDIV), SPDR S&P Pharmaceuticals ETF (XPH), and SPDR S&P Metals & Mining ETF (XME).
Others scoring near the top of the rankings include iShares US Home Construction ETF (ITB), Global X SuperDividend REIT ETF (SRET), VanEck Vectors Morningstar Wide Moat ETF (MOAT), and the First Trust LongShort Equity ETF (FTLS), which employs Sabrient’s proprietary Earnings Quality Rank as a key input factor.
If you prefer a neutral bias, the Sector Rotation model suggests holding Healthcare, Technology, and Consumer Goods (Staples/Noncyclical), in that order. On the other hand, if you prefer a defensive stance on the market, the model suggests holding Utilities, Healthcare, and Consumer Goods (Staples/Noncyclical), in that order.
IMPORTANT NOTE: I post this information periodically as a free look inside some of our institutional research and as a source of some trading ideas for your own further investigation. It is not intended to be traded directly as a rules-based strategy in a real money portfolio. I am simply showing what a sector rotation model might suggest if a given portfolio was due for a rebalance, and I may or may not update the information on a regular schedule. There are many ways for a client to trade such a strategy, including monthly or quarterly rebalancing, perhaps with interim adjustments to the bullish/neutral/defensive bias when warranted -- but not necessarily on the days that I happen to post this article. The enhanced strategy seeks higher returns by employing individual stocks (or stock options) that are also highly ranked, but this introduces greater risks and volatility. I do not track performance of the ideas mentioned here as a managed portfolio.
Disclosure: Scott Martindale is president of Sabrient Systems, LLC. The author has no positions in stocks or ETFs mentioned.
Disclaimer: This newsletter is published solely for informational purposes and is not to be construed as advice or a recommendation to specific individuals. Individuals should take into account their personal financial circumstances in acting on any rankings or stock selections provided by Sabrient. Sabrient makes no representations that the techniques used in its rankings or selections will result in or guarantee profits in trading. Trading involves risk, including possible loss of principal and other losses, and past performance is no indication of future results.