Sector Detector: Stocks break out again but may be running on fumes
Despite low trading volume, a strong dollar, mixed economic and earnings reports, paralyzing weather conditions throughout much of the U.S., and ominous global news events, stocks continue to march ever higher. The world remains on edge about potential Black Swan events from the likes of Russia, Greece, or ISIS (or lone wolf extremists). Moreover, the economic recovery of the U.S. may be feeling the pull of the proverbial ball-and-chain from the rest of the world’s economies. Nevertheless, awash in investable cash, global investors see few choices better than U.S. equities.
In this weekly update, I give my view of the current market environment, offer a technical analysis of the S&P 500 chart, review our weekly fundamentals-based SectorCast rankings of the ten U.S. business sectors, and then offer up some actionable trading ideas, including a sector rotation strategy using ETFs and an enhanced version using top-ranked stocks from the top-ranked sectors.
Market overview:
Happy days are here again, or so the U.S. stock market would have us believe, as all major indices are hitting or challenging new highs. The S&P 500 long ago eclipsed the 2000 mark and is now holding above 2100. The Dow Jones Industrials is solidly above 18,000. Even small caps and mid caps have joined the new-high party. The NASDAQ, which hasn’t challenged its Internet-bubble high of 5,048 in 15 years, managed to close Monday above 5,000 and seems determined to make its own new high -- perhaps this week. As a reminder, next Monday, the bull market will reach its 6-year anniversary.
Stock buybacks and M&A continue at a robust pace, even though these aren’t the most popular uses of cash reserves among activist investors, who tend to prefer capital expenditures, hiring, and increased dividends. Nevertheless, the market has applauded some recent M&A that involved some of our favorites. Last week, Valeant Pharmaceuticals (VRX) spiked +14% after announcing it would acquire former Sabrient favorite Salix Pharmaceuticals (SLXP), which 16 months ago bought another of our former favorites Santarus. Then today, NXP Semiconductor (NXPI) announced it will acquire Freescale Semiconductor (FSL), which is also highly ranked in our system. NXPI was up over +17% for the day.
Earnings season is winding down, and FactSet reported Q4 earnings growth to be +3.7% overall, which is pretty good, although revenue growth has been much more muted. Q4 GDP was revised downward to +2.2% and the ISM manufacturing index fell to 52.9 (due in part to the West Coast port slowdown), but both are still pretty good. So, economic growth continues to slog ahead, and the Fed is expected to continue on its path toward normalizing monetary policy. Although there might be some short-term hits to stocks when rates start bumping up, the consensus is that it would take a fed funds rate of over 3% before there would be any meaningfully negative impact on the economy. With inflation nowhere in sight, it is unlikely we will see fed funds rate that high anytime soon.
Overseas, China has again cut rates by 25 bps as its economy sputters (relatively speaking), inflation remains low, and credit continues to expand. And in Europe, Greece seems to be more willing to work out a deal than the new government’s bluster initially suggested. Nevertheless, global demand for U.S. Treasury bonds remains strong, and much of that demand is from Europe. Indeed, the 10-year Treasury yield closed Monday at 2.08% as it consolidates after its February spike, and Bloomberg reported last week that institutions are piling into bond ETFs at the fastest pace on record, taking in $32 billion globally this year.
Given that the Fed is likely to start tightening later this year, does that necessarily suggest poor stock performance and widening credit spreads? Apparently not. Scott Minerd of Guggenheim points out that during the nine months leading up to first rate increase over the past six tightening periods since 1980, the S&P 500 has returned an average of +23.5% while high-yield bonds have outperformed investment-grade bonds by 4.0%.
The CBOE Market Volatility Index (VIX), a.k.a. fear gauge, closed Monday at 13.04 and remains below the 15 threshold, reflecting investor complacency.
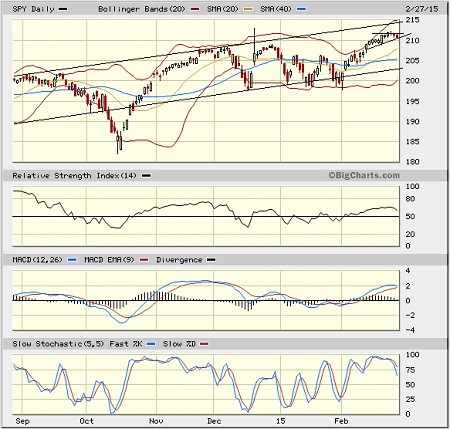
SPY chart review:
The SPDR S&P 500 Trust (SPY) closed Friday at 210.66 and continues to make new highs on modest volume. It is in a minor uptrend that appears to be setting up as a bullish ascending triangle, with higher lows. However, oscillators RSI, MACD, and Slow Stochastic are all somewhat overbought and look overdue for a more significant pullback -- which would be healthy by testing support levels and recharging bullish conviction. Support resides at the 20-day simple moving average currently near 208, the 50-day SMA around 206, the 100-day SMA and the lower uptrend line, which are both near 203, and then the critical 200-day SMA that is now approaching 200. With blue skies overhead, a further rally could make it up to the upper trend line of the long-standing bullish channel, which is approaching 215. Even with the overbought conditions and the need for a corrective pullback, the chart remains bullish in the mid and longer term.
Latest sector rankings:
Relative sector rankings are based on our proprietary SectorCast model, which builds a composite profile of each equity ETF based on bottom-up aggregate scoring of the constituent stocks. The Outlook Score employs a forward-looking, fundamentals-based multifactor algorithm considering forward valuation, historical and projected earnings growth, the dynamics of Wall Street analysts’ consensus earnings estimates and recent revisions (up or down), quality and sustainability of reported earnings (forensic accounting), and various return ratios. It helps us predict relative performance over the next 1-3 months.
In addition, SectorCast computes a Bull Score and Bear Score for each ETF based on recent price behavior of the constituent stocks on particularly strong and weak market days. High Bull score indicates that stocks within the ETF recently have tended toward relative outperformance when the market is strong, while a high Bear score indicates that stocks within the ETF have tended to hold up relatively well (i.e., safe havens) when the market is weak.
Outlook score is forward-looking while Bull and Bear are backward-looking. As a group, these three scores can be helpful for positioning a portfolio for a given set of anticipated market conditions. Of course, each ETF holds a unique portfolio of stocks and position weights, so the sectors represented will score differently depending upon which set of ETFs is used. We use the iShares that represent the ten major U.S. business sectors: Financial (IYF), Technology (IYW), Industrial (IYJ), Healthcare (IYH), Consumer Goods (IYK), Consumer Services (IYC), Energy (IYE), Basic Materials (IYM), Telecommunications (IYZ), and Utilities (IDU). Whereas the Select Sector SPDRs only contain stocks from the S&P 500, I prefer the iShares for their larger universe and broader diversity. Fidelity also offers a group of sector ETFs with an even larger number of constituents in each.
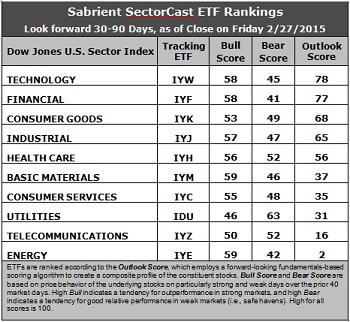
Here are some of my observations on this week’s scores:
1. Technology has moved back into first place with an Outlook score of 78, followed closely by Financial at 77. Technology displays the best return ratios, a good forward long-term growth rate and forward P/E, and among the best sell-side analyst sentiment (i.e., only minor net downward revisions to earnings estimates). Financial displays by far the lowest forward P/E, reasonably good forward long-term growth rate, and reasonably good sentiment among both insiders (buying activity) and sell-side analysts. Consumer Goods/Staples, Industrial, and Healthcare round out the top five. Notably, Utilities took the brunt of the net downward earnings revisions and fell pretty far down the rankings, while Industrial and Basic Materials have seen a solid improvement in their scores, which is bullish.
2. Once again, Energy continues to hold the bottom spot given the persistent weakness in oil prices and the ongoing downward earnings revisions, although the Wall Street onslaught has greatly diminished. Energy is among the worst in all factors in the model, with the exception of return ratios. Joining Energy in the bottom two is Telecom.
3. Looking at the Bull scores, Energy and Basic Materials display the top score of 59, followed by Financial and Technology at 58. Utilities scores the lowest at 46. The top-bottom spread is 13 points, which is still somewhat on the low side but better than the tight spreads we were seeing several weeks ago. It is generally desirable in a healthy market to see low correlations reflected in a top-bottom spread of at least 20 points, which indicates that investors have clear preferences in the stocks they want to hold.
4. Looking at the Bear scores, Utilities displays the highest score of 63 this week, which means that stocks within this sector have been the preferred safe havens on weak market days. Financial has the lowest score of 41, followed closely by Energy. The top-bottom spread has widened to 22 points, which indicates low sector correlations on particularly weak market days. Ideally, certain sectors will hold up relatively well while others are selling off. Again, it is generally desirable in a healthy market to see low correlations and a top-bottom spread of at least 20 points.
5. Technology displays the best all-around combination of Outlook/Bull/Bear scores, while Energy is the worst. Looking at just the Bull/Bear combination, Utilities is the strongest, followed closely by Healthcare, indicating superior relative performance (on average) in extreme market conditions (whether bullish or bearish), while Financial is the worst due to its low Bear score. Healthcare displays the most balanced performance overall.
6. Overall, this week’s fundamentals-based Outlook rankings look a lot more bullish to me, with economically-sensitive sectors Tech, Financial, Industrial, and all-weather Healthcare in the top five and the emergence of Basic Materials. Pushed back down near the bottom are defensive sectors Utilities and Telecom, which also have some of the higher Bear scores. What would further enhance the bullishness of the rankings would be if Technology had a score above 90 and if Consumer Services/Discretionary switched place with Consumer Goods. But overall, I would call this a bullish ranking for stocks. However, keep in mind, the Outlook Rank does not include timing or momentum factors, but rather is a reflection of the fundamental expectations of individual stocks aggregated by sector.
Stock and ETF Ideas:
Our Sector Rotation model, which appropriately weights Outlook, Bull, and Bear scores in accordance with the overall market’s prevailing trend (bullish, neutral, or defensive), retains its bullish bias, and the model suggests holding Technology, Financial, and Industrial, in that order. (Note: In this model, we consider the bias to be bullish from a rules-based trend-following standpoint when SPY is above both its 50-day and 200-day simple moving averages.)
Other highly-ranked ETFs from the Technology, Financial, and Industrial sectors include iShares North American Tech-Multimedia Networking (IGN), iShares US Financial Services ETF (IYG), and iShares Transportation Average ETF (IYT).
For an enhanced sector portfolio that enlists some top-ranked stocks (instead of ETFs) from within the top-ranked sectors, some long ideas from Technology, Financial, and Industrial sectors include CommScope (COMM), Brocade Communications Systems (BRCD), Intercontinental Exchange (ICE), Affiliated Managers Group (AMG), Union Pacific (UNP), and JetBlue Airways (JBLU). All are highly ranked in the Sabrient Ratings Algorithm.
However, if you prefer to maintain a neutral bias, the Sector Rotation model suggests holding Technology, Financial, and Consumer Goods/Staples, in that order. And if you prefer a defensive stance on the market, the model suggests holding Utilities, Healthcare, and Consumer Goods/Staples, in that order.
IMPORTANT NOTE: I post this information each week as a free look inside some of our institutional research and as a source of some trading ideas for your own further investigation. It is not intended to be traded directly as a rules-based strategy in a real money portfolio. I am simply showing what a sector rotation model might suggest if a given portfolio was due for a rebalance, and I may or may not update the information each week. There are many ways for a client to trade such a strategy, including monthly or quarterly rebalancing, perhaps with interim adjustments to the bullish/neutral/defensive bias when warranted -- but not necessarily on the days that I happen to post this weekly article. The enhanced strategy seeks higher returns by employing individual stocks (or stock options) that are also highly ranked, but this introduces greater risks and volatility. I do not track performance of the ETF and stock ideas mentioned here as a managed portfolio.
Disclosure: Author has no positions in stocks or ETFs mentioned.
Disclaimer: This newsletter is published solely for informational purposes and is not to be construed as advice or a recommendation to specific individuals. Individuals should take into account their personal financial circumstances in acting on any rankings or stock selections provided by Sabrient. Sabrient makes no representations that the techniques used in its rankings or selections will result in or guarantee profits in trading. Trading involves risk, including possible loss of principal and other losses, and past performance is no indication of future results.