Sector Detector: Stellar Q1 performance confronts a brief yield curve inversion
 by Scott Martindale
President, Sabrient Systems LLC
You might not have realized it given the technical consolidation in March, but Q1 2019 ended up giving the S&P 500 its best Q1 performance of the new millennium, and the best quarterly performance (of any quarter) since Q3 2009. Investors could be forgiven for thinking the powerful rally from Christmas Eve through February was nothing more than a proverbial “dead cat bounce,” given all the negative news about a global economic slowdown, the still-unresolved trade skirmish with China, a worsening Brexit, reductions to US corporate earnings estimates, and the Fed’s sudden about-face on rate hikes. But instead, stocks finished Q1 with a flourish and now appear to be poised to take another run at all-time highs. The S&P 500, for example, entered Q2 less than 4% below its all-time high.
Overall, we still enjoy low unemployment, rising wages, and strong consumer sentiment, as well as a supportive Fed (“Don’t fight the Fed!”) keeping rates “lower for longer” (and by extension, debt servicing expenses and discount rates for equity valuation) and maintaining $1.5 trillion in excess reserves in the financial system. Likewise, the ECB extended its pledge to keep rates at record lows, and China has returned to fiscal and monetary stimulus to revive its flagging growth stemming from the trade war. Meanwhile, Corporate America has been quietly posting record levels of dividends and share buybacks, as well as boosting its capital expenditures – which is likely to accelerate once a trade deal with China is signed (which just became more likely with the apparently-benign findings of the Mueller investigation). In addition, the bellwether semiconductor industry is presenting a more upbeat tone and an upturn from a cyclical bottom (due to temporary oversupply), while crude oil has broken out above overhead resistance at $60.
On the other hand, there is some understandable concern that US corporate earnings forecasts have been revised downward to flat or negative for the first couple of quarters of 2019. Of course, it would be preferable to see a continuation of the solid earnings growth and profitability of last year, but the good news is that revenue growth is projected to remain solid (at least 4.5% for all quarters), and then earnings is expected to return to a growth track in 2H2019. Moreover, the concurrent reduction in the discount rate (due to lower interest rates) is an offsetting factor for stock valuations.
All of this leads me to believe that economic conditions remain generally favorable for stocks. In addition, I think we may see upside surprises in Q1 and Q2 earnings announcements, especially given the low bar that has been reset. But it also may mean that investors will become more selective, with some stocks doing quite well even if the broad market indexes show only modest growth this year.
In this periodic update, I provide a market commentary, offer my technical analysis of the S&P 500, review Sabrient’s latest fundamentals-based SectorCast rankings of the ten US business sectors, and serve up some actionable ETF trading ideas. In summary, our sector rankings remain bullish and the technical picture suggests an imminent upside breakout, while the sector rotation model maintains its a bullish posture. Read on…
Market Commentary:
No doubt, market distortions due to things like central bank monetary policies, trade wars, algorithmic trading, and massive capital flows into passive indexes rather than active selection, not to mention fear-based or headline-driven trading, can lead individual investors to lose confidence in the rational behavior of markets. But history suggests that although valuations can become disconnected from fundamentals for stretches of time (whether too exuberant or too pessimistic), share prices eventually do reflect fundamentals.
I started my career in the 1980’s as an engineer for Gulf Oil and later Chevron (after what was at the time the biggest merger in corporate history), and although I haven’t done engineering design in a long time, I’m still very much a quant (aka numbers geek) at heart – as are Sabrient founder David Brown (former NASA engineer) and the rest of the combined team at Sabrient Systems and Gradient Analytics, with our engineering, accounting, and finance backgrounds. And despite periods of fear-driven market behavior, like 2H2015 (China weakness and currency devaluation leading to narrow “FANG” or nothing) and 2H2018 (trade wars and Fed “autopilot” rate hikes leading to unwarranted risk-off defensive rotation), we continue to stick to our guns that active selection based on a disciplined growth-at-a-reasonable-price (GARP) investing approach is timeless and tends to outperform passive market benchmarks over time. Nevertheless, history has shown that investors tend to throw in the towel at precisely the wrong time.
The V-bottom recovery following the Christmas Eve selloff is a great case in point. The S&P 500 started 2018 at a forward P/E of around 18.5x, a speculative valuation based on the passage of the tax reform bill but finished the year all the way down at 14.5x, a defensive valuation based on trade wars and a hawkish Fed that seemed more reflective of imminent global recession and Treasury yields of 5%. And risk-on cyclical sectors fared even worse, with a sector like Steel (represented by SLX) falling from a forward P/E of 14.2x down to only 6.4x at year-end (a 55% fall!). But those investors who engaged in panic-selling to preserve capital and didn’t reenter right away missed out as stocks have repriced higher to better align with the positive fundamental outlook (despite the recent slowdown in the global economy that I see as temporary). Following a tough stretch during 2H2018 starting with the defensive rotation and leading to the Q4 market selloff, many of Sabrient’s various GARP portfolios have significantly outperformed since Christmas Eve.
Q1 2019 performance of the S&P 500 large caps (SPY) was +13.5% (and +21.1% since Christmas Eve’s “capitulation day”), Nasdaq 100 (QQQ) +16.7%, S&P 400 mid-caps (MDY) +14.4%, and S&P 600 small caps (SLY) +11.5% (and +18.7% since Christmas Eve). Every US business sector rose, led by Technology at +19.9% (for risk-on growth investors) and Real Estate at +17.5% (for yield-seeking investors). Meanwhile, the CBOE Volatility Index (VIX) closed Q1 at a modest 13.71, while “junk bonds” were up about +7% and crude oil surged 32%! Notably, China stocks are up +27% through Q1 (in US dollars), which is the best since 2014 and the best performance among all global regions, as government stimulus has boosted production and optimism about an imminent trade deal has lifted investor confidence. In addition, more global capital is passively flowing into Chinese equities due to the recent increases in MSCI index allocations to China.
The third estimate from the BEA of Q4 US real GDP growth (as of March 29) is +2.2% (versus the prior estimate of 2.6% and compared to +3.4% for Q3). Moreover, according the official release, real GDP increased +2.9% year-over-year from the 2017 annual level to the 2018 annual level), compared with a YOY increase of +2.2 % in 2017. I am eager to see the Q4 reading for real Gross Output (GO), which is gaining traction as a key metric among economists since it measures total economic activity including transactions within the supply chain and not just final products. For Q3, when real GDP measured 3.4%, GO came in at 3.9%, and historically, when GO grows faster than GDP, it foreshadows continued strong growth. Looking ahead to 1Q2019, the Atlanta Fed’s GDPNow model (as of April 2) is forecasting 2.1% GDP growth for 1Q2019 (up from only 0.3% on March 1), while the New York Fed’s Nowcast model (as of March 29) forecasts 1.3% for Q1 and 1.6% for Q2.
At the March FOMC meeting, the Fed kept rates unchanged and lowered its rate hike projection for 2019 from two to zero and stated that its balance sheet run-off would end in September. It also lowered its official forecasts of inflation from 1.9% down to 1.8% and GDP growth from 2.3% down to 2.1%. In the immediate aftermath of their report, global capital rotated defensively out of equities and into Treasuries, driving up prices to overbought conditions and creating the first yield curve inversion (albeit only slightly) since 2007 when the 10-year T-note yield fell below the 3-month T-bill yield. Ultimately, the 10-year yield fell 28 bps during Q1. So, with the Fed on the sidelines with respect to any further rate hikes, the CME Group fed funds futures now are placing zero probability of another rate hike by January 2020 and instead they indicate a 63% probability of at least one 25-bp rate cut by then (and a 23% chance of more than one rate cut).
But after a brief inversion of the yield curve that drove the talking heads into a tizzy, spreads quickly recovered, with the 10-year US T-note closing Monday at 2.50%, the 2-year at 2.34%, and the 3-month T-bill at 2.39%, the 2-10 spread is at 13 bps while the 3-month-to-10-year spread is only 11 bps – but at least it’s no longer inverted. Of course, all the commotion was due to the fact that inversion historically has been a reliable indicator of recession over the ensuring 16-24 months.
So, what to make of that recent inversion of the yield curve? Well, even if that fleeting inversion does eventually lead to recession over the next 18 months or so, Robert Buckland of Citi says that the history of past inversions suggests to him that US equities still could rise 32% by year-end 2020. But I think everyone jumped the gun a bit, searching for scary things to talk about. First of all, did it ever really invert from a market-based pricing standpoint? The fed funds rate is set by the FOMC while longer-dated Treasury yields are set by the market, and the 2-10 spread never inverted. But even if it did qualify as an inversion, Research Affiliates published an interview with Cam Harvey (who conducted pioneering studies in the 1980’s on inverted yield curve), and he says an inversion needs to persist for a full quarter, not just a few days. Similarly, Fed Chair Powell has downplayed the risk of recession, noting that prior situations in which Fed tightening pushed the economy into recession were necessitated by rising inflationary pressures that are not present today. To be sure, the Fed is taking great care not to be responsible for tightening the economy into a recession, and notably, over the past 50 years, there has never been a recession when the fed funds rate was under 4% (current cap is 2.50%), nor (as pointed out by First Trust’s Brian Wesbury) has there been a recession with such massive levels of excess reserves in the financial system (currently at $1.5 trillion). Krishna Memani of OppenheimerFunds concurs, saying that more important than the shape of the curve is the level of rates, which are quite low compared with prior periods when inversion led to recession. And JPMorgan analyst Marko Kolanovic suggested that our 10-year yield has been kept artificially depressed by low (or negative) yields abroad, global QE, and carry trades.
Indeed, Monday’s closing rate of 2.50% on a US 10-year looks pretty good compared with other risk-free developed market 10-year yields, like France at +0.38%, and with Germany and Japan at -0.02% and -0.08%, respectively -- yes, both offer negative yields (which means they don’t pay you interest and instead you must pay them for the honor of holding their bonds). Even troubled Italy only pays 2.52%.
To me, this worry about the brief yield-curve inversion is yet another example of a single metric being taken out of context (I have cited several such examples in this column in the past). According to Westpac Banking foreign-exchange strategy head Richard Franulovich, “a broader recession probability model that incorporates equities, credit spreads, and the ISM manufacturing survey points to very negligible recession risk.” To many analysts, global QE has created market distortions that have led to false signals like this. Although the yield curve indeed inverted briefly, it wasn’t caused by rising inflation that the Fed had to stomp out. Instead, it was caused by falling rates at the long end of the curve due to low inflation, low (or negative) yields abroad, dovish moves in monetary policy by global central banks, and elevated political risks. In such circumstances, a lower long-term Treasury yield supports higher equity valuations via less discounting of future corporate earnings.
Furthermore, renewed optimism in the economy toward the end of March led to a rotation out of overbought bonds and back into the relatively attractive valuations in equities. US equities continue to return value back to investors via dividends and share buyback programs. Notably, according to S&P Dow Jones Indices, S&P 500 Index companies paid out a record of nearly $120 billion in dividends in 4Q18 and $456 billion for full-year 2018 (which was up 8.7% versus 2017), while buybacks totaled a record $223 billion in Q4 and $806 billion for full-year 2018 (which was up 55% versus 2017 and could reach $1 trillion in 2019). For comparison, the total market cap of the S&P 500 companies is around $24 trillion. And while corporate capital investment has been growing, as well, suggesting that companies are confidently investing in future growth, I still think there will be a marked upturn in planned capex once the US and China sign a trade deal (not to mention the improvement in optimism now that the threat of further disruptive indictments and impeachment seems to be off the table).
Meanwhile, reports continue to suggest that trade talks between the US and China are in their final stages, as negotiators go line-by-line through the wording of a written agreement that both presidents can sign. With Mueller’s Russian-collusion investigation out of the way and Trump set to at least finish his current term (and possibly stay in office for another term), there is no longer any incentive for China to drag its feet in these negotiations.
Looking ahead, Sabrient’s GARP model (which is essentially a Value/Growth hybrid model) continues to steer us toward cyclical sectors and small-mid caps for the most attractive forward valuations among quality companies. But its worth noting that broad market performance continues to show that the Growth factor in general has been greatly outperforming the Value factor for a while now, and a key reason for that is the predominance of the high-performing Technology sector in Growth indexes versus Financials in Value indexes. This leadership from Technology has led to the sector’s elevated aggregate P/E approaching 20x, so the Tech sector hasn’t scored quite as well lately in Sabrient’s short-term (2-6 month) SectorCast model. Nevertheless, I think Tech will remain the go-to sector for long-term growth investors for several reasons, including consistently higher profit margins and stronger sales growth than the broad market over the past five years, higher-quality balance sheets (with low leverage and high cash balances), stable product demand, and perhaps most importantly, all other sectors rely on new technologies to improve service and productivity, so the Tech sector can actually help drive – or at the very least coattail along with – growth in all other sectors.
Of course, Tech provides disruptive innovations to fuel growth, and the technologies seem to keep on coming at a more furious pace than ever, such as 5G wireless, artificial intelligence (AI), robotics, automation, and telemedicine/telesurgery, and yet the forward P/E valuation for the sector remains roughly in-line (or perhaps at a slight premium) with the five-year average. Perhaps the most important technology at the moment is the global race for 5G wireless dominance (primarily between the US and China), which promises a massive improvement in data capacity (bandwidth) and Internet speed necessary to enable the full potential of those other technologies.
In closing, with the Fed on the sidelines (and other central banks back in dovish mode), I think that once a trade deal with China is consummated we will see US companies further ramp up capital spending plans and restate guidance higher, leading the analyst community to raise estimates and enticing risk capital back into stocks – particularly high-quality dividend payers (among yield-seeking investors) and companies from cyclical sectors that typically thrive in a growing economy (among growth-focused investors).
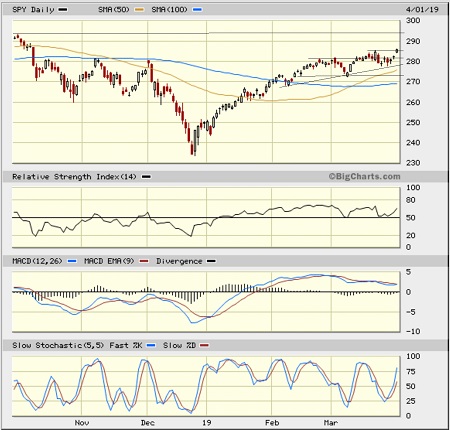
SPY Chart Review:
The SPDR S&P 500 ETF (SPY) closed Monday (April 1) just below 286. After some much-needed technical consolidation in March following the huge recovery rally from the Q4 selloff, price is threatening an upside breakout and a challenge to the all-time high. As I said at the beginning of April, I expected some profit-taking and consolidation of gains to work off overbought technicals and gather bullish conviction, which it did with little pullback in price as investors were loath to sell for fear of missing out on further gains. After a failed first attempt in mid-March at a sustained breakout through the 280 level, the current rally seems to have the energy and conviction required. Oscillators RSI, Slow Stochastic, and MACD all continue to point bullishly upward, and price remains above all of its key daily moving averages. I think an upside breakout is imminent.
Latest Sector Rankings:
Relative sector rankings are based on our proprietary SectorCast model, which builds a composite profile of each of nearly 500 equity ETFs based on bottom-up aggregate scoring of the constituent stocks. The Outlook Score employs a forward-looking, fundamentals-based multifactor algorithm considering forward valuation, historical and projected earnings growth, the dynamics of Wall Street analysts’ consensus earnings estimates and recent revisions (up or down), quality and sustainability of reported earnings, and various return ratios. It helps us predict relative performance over the next 2-6 months.
In addition, SectorCast computes a Bull Score and Bear Score for each ETF based on recent price behavior of the constituent stocks on particularly strong and weak market days. A high Bull score indicates that stocks within the ETF recently have tended toward relative outperformance when the market is strong, while a high Bear score indicates that stocks within the ETF have tended to hold up relatively well (i.e., safe havens) when the market is weak.
Outlook score is forward-looking while Bull and Bear are backward-looking. As a group, these three scores can be helpful for positioning a portfolio for a given set of anticipated market conditions. Of course, each ETF holds a unique portfolio of stocks and position weights, so the sectors represented will score differently depending upon which set of ETFs is used. We use the iShares that represent the ten major U.S. business sectors: Financial (IYF), Technology (IYW), Industrial (IYJ), Healthcare (IYH), Consumer Goods (IYK), Consumer Services (IYC), Energy (IYE), Basic Materials (IYM), Telecommunications (IYZ), and Utilities (IDU). Whereas the Select Sector SPDRs only contain stocks from the S&P 500 large cap index, I prefer the iShares for their larger universe and broader diversity.
Here are some of my observations on this week’s scores:
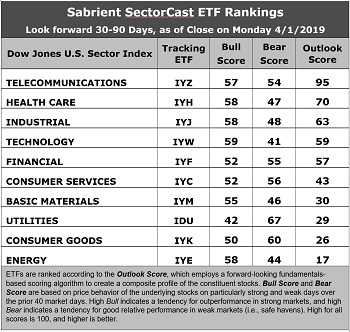
1. Telecom returns to the top spot with a robust Outlook score of 95. It displays the lowest forward P/E of 14.0x, good sell-side analyst sentiment (net revisions to EPS estimates), and good return ratios. However, it has absorbed some significant reductions to earnings estimates and its pure GARP metrics are only average, with projected year-over-year EPS growth rate of only 8.7% and a forward PEG ratio (forward P/E divided by projected EPS growth rate) of 1.61, which ranks it 6th out of 10 sectors on PEG (which is why we don’t see many Telecoms as candidates for Sabrient’s GARP portfolios, which have a 12-24 month outlook rather than 2-6 months). Healthcare takes second with an Outlook score of 70, as it displays positive analyst and insider sentiment, but like Telecom, its pure GARP metrics are less attractive (forward P/E of 16.8, projected EPS growth of 10.3%, forward PEG of 1.63). Industrial remains in third with reasonably good factor scores across the board. Technology, Financial, Consumer Services (Discretionary/Cyclical), and Basic Materials round out the top seven.
2. At the bottom of the rankings we find Energy and Consumer Goods (Staples/Noncyclical). Energy has the highest forward P/E of 19.4x and lowest return ratios, although it also displays the strongest projected year-over-year EPS growth rate of 26.5% and the lowest forward PEG of 0.73 (which is why we often see Energy names as candidates for Sabrient’s GARP portfolios, which have a 12-24 month outlook rather than 2-6 months).
3. Looking at the Bull scores, Technology enjoys the top score of 59, followed by Industrial, Energy, and Healthcare at 58, as stocks within these sectors have displayed relative strength on strong market days. Defensive sector Utilities scores the lowest at 42. The top-bottom spread is 17 points, which reflects fairly low sector correlations on strong market days. It is desirable in a healthy market to see low correlations reflected in a top-bottom spread of at least 20 points, which indicates that investors have clear preferences in the market segments and stocks they want to hold (rather than broad risk-on behavior).
4. Looking at the Bear scores, as usual we find defensive sector Utilities alone in the top spot with a score of 67, followed by Consumer Goods (Staples/Noncyclical) at 60, which means that stocks within these sectors have been the preferred safe havens lately on weak market days. Technology has the lowest score of 41, as investors have fled during recent market weakness. The top-bottom spread is 19 points, which reflects low sector correlations on weak market days. Ideally, certain sectors will hold up relatively well while others are selling off (rather than broad risk-off behavior), so it is desirable in a healthy market to see low correlations reflected in a top-bottom spread of at least 20 points.
5. Telecom displays the best all-around combination of Outlook/Bull/Bear scores, followed by Healthcare, while Energy is the worst. Looking at just the Bull/Bear combination, Telecom is again the best, followed by Consumer Goods, indicating superior relative performance (on average) in extreme market conditions (whether bullish or bearish), while Technology scores the worst.
6. This week’s fundamentals-based Outlook rankings reflect a mostly bullish bias, given that six of the top seven sectors are economically-sensitive or all-weather. Keep in mind, the Outlook Rank does not include timing, momentum, or relative strength factors, but rather reflects the consensus fundamental expectations at a given point in time for individual stocks, aggregated by sector.
ETF Trading Ideas:
Our Sector Rotation model, which appropriately weights Outlook, Bull, and Bear scores in accordance with the overall market’s prevailing trend (bullish, neutral, or defensive), still displays a bullish bias and suggests holding Telecom (IYZ), Healthcare (IYH), and Technology (IYW), in that order. (Note: In this model, we consider the bias to be bullish from a rules-based trend-following standpoint when SPY is above both its 50-day and 200-day simple moving averages.)
Besides iShares’ IYZ, IYH, and IYW, other highly-ranked ETFs in our SectorCast model (which scores nearly 500 US-listed equity ETFs) from the Telecom, Healthcare, and Technology sectors include SPDR S&P Pharmaceuticals (XPH), ProShares Ultra Telecommunications (LTL), and First Trust NASDAQ Technology Dividend (TDIV).
If you prefer a neutral bias, the Sector Rotation model suggests holding Telecom, Healthcare, and Industrial, in that order. On the other hand, if you are more comfortable with a defensive stance on the market, the model suggests holding Utilities, Telecom, and Financial, in that order.
An assortment of other interesting ETFs that are scoring well in our latest rankings include iShares NASDAQ Biotechnology (IBB), SPDR S&P Insurance (KIE), VanEck Vectors Biotech (BBH), VanEck Vectors BDC Income (BIZD), Forensic Accounting Long-Short (FLAG), VanEck Vectors Uranium Nuclear Energy (NLR), WBI BullBear Value 2000 (WBIB), Schwab US Dividend Equity (SCHD), Deep Value ETF (DVP), VanEck Vectors High Income MLP (YMLP), SPDR S&P Metals & Mining (XME), Arrow QVM Equity Factor ETF (QVM), SPDR SSGA Gender Diversity (SHE), and AlphaClone Alternative Alpha (ALFA).
IMPORTANT NOTE: I post this information periodically as a free look inside some of our institutional research and as a source of some trading ideas for your own further investigation. It is not intended to be traded directly as a rules-based strategy in a real money portfolio. I am simply showing what a sector rotation model might suggest if a given portfolio was due for a rebalance, and I do not update the information on a regular schedule or on technical triggers. There are many ways for a client to trade such a strategy, including monthly or quarterly rebalancing, perhaps with interim adjustments to the bullish/neutral/defensive bias when warranted, but not necessarily on the days that I happen to post this article. The enhanced strategy seeks higher returns by employing individual stocks (or stock options) that are also highly ranked, but this introduces greater risks and volatility. I do not track performance of the ideas mentioned here as a managed portfolio.
Disclosure: The author has no positions in stocks or ETFs mentioned.
Disclaimer: This newsletter is published solely for informational purposes and is not to be construed as advice or a recommendation to specific individuals. Individuals should take into account their personal financial circumstances in acting on any opinions, commentary, rankings, or stock selections provided by Sabrient Systems or its wholly-owned subsidiary Gradient Analytics. Sabrient makes no representations that the techniques used in its rankings or analysis will result in or guarantee profits in trading. Trading involves risk, including possible loss of principal and other losses, and past performance is no indication of future results.