Sector Detector: Fundamentals suggest impressive risk-on recovery will continue
 by Scott Martindale
President, Sabrient Systems LLC
The first two months of 2019 have treated Sabrient’s portfolios quite well. After a disconcerting 3Q2018, in which small-cap and cyclicals-heavy portfolios badly trailed the broad market amid a fear-driven defensive rotation, followed by a dismal Q4 for all stocks, the dramatic V-bottom recovery has been led by those same forsaken small-mid caps and cyclical sectors. All of our 12 monthly all-cap Baker’s Dozen portfolios from 2018 have handily outperformed the S&P 500 benchmark since then, as fundamentals seem to matter once again to investors. Indeed, although valuations can become disconnected from fundamentals for a given stretch of time (whether too exuberant or too pessimistic), share prices eventually do reflect fundamentals. Indeed, it appears that institutional fund managers and corporate insiders alike have been scooping up shares of attractive-but-neglected companies from cyclical sectors and small-mid caps in what they evidently saw as a buying opportunity.
And why wouldn’t they? It seems clear that Q4 was unnecessarily weak, with the ugliest December since the Great Depression, selling off to valuations that seem more reflective of an imminent global recession and Treasury yields of 5%. But when you combine earnings beats and stable forward guidance with price declines – and supported by a de-escalation in the trade war with China and a more “patient and flexible” Federal Reserve – it appears that the worst might be behind us, as investors recognize the opportunity before them and pay less attention to the provocative news headlines and fearmongering commentators. Moreover, I expect to see a renewed appreciation for the art of active selection (rather than passive pure-beta vehicles). However, we must remain cognizant of 2018’s lesson that volatility is not dead, so let’s not be alarmed if and when we encounter bouts of it over the course of the year.
Looking ahead, economic conditions appear favorable for stocks, with low unemployment, rising wages, strong consumer sentiment, and solid GDP growth. Moreover, Q4 corporate earnings are still strong overall, with rising dividends, share buybacks at record levels, and rejuvenated capital investment. So, with the Fed on the sidelines and China desperately needing an end to the trade war, I would expect that any positive announcement in the trade negotiations will recharge the economy in supply-side fashion, as US companies further ramp up capital spending and restate guidance higher, enticing risk capital back into stocks (but again, not without bouts of volatility). This should then encourage investors to redouble their current risk-on rotation into high-quality stocks from cyclical sectors and small-mid caps that typically flourish in a growing economy – which bodes well for Sabrient’s growth-at-a-reasonable-price (GARP) portfolios.
In this periodic update, I provide a market commentary, offer my technical analysis of the S&P 500, review Sabrient’s latest fundamentals-based SectorCast rankings of the ten US business sectors, and serve up some actionable ETF trading ideas. In summary, our sector rankings remain bullish, while the sector rotation model has returned to a bullish posture. Read on…
Market Commentary:
Year-to-date through Friday’s close (3/1), the S&P 500 large caps (SPY) reflect a total return of +11.8%, Nasdaq 100 (QQQ) +13.0%, S&P 400 mid-caps (MDY) +15.9%, and S&P 600 small caps (SLY) +16.0%. If we look at performance from the close on Christmas Eve (“capitulation day”) through Friday, the SPY is +19.7%, QQQ is +21.5%, MDY is +22.6%, and SLY is +23.5%. Leading sectors have been risk-on cyclicals like Industrials, Technology (including the semiconductor segment), Energy, and Consumer Discretionary (including the homebuilding segment). And looking ahead, according to S&P Dow Jones Indices based on data starting in 1938, when both January and February have been positive, the S&P 500 finished the year in positive territory 29 of 30 times with an average return of more than 20%. And small caps seem to me to be even better poised for further gains. As DataTrek pointed out, small caps are heavily levered to high-yield corporate spreads due to external financing, and those spreads have tightened (reflecting lower credit risk) quite a bit this year, given the expectation of continued US economic growth, a supportive Fed, ongoing deregulation, and the fact that small caps are more US-focused and so are less impacted by dollar strength.
China stocks are up +23% in US dollars, as government stimulus and optimism about a trade deal improve investor confidence. In addition, its weighting in the MSCI Emerging Markets index was tripled to 2.82%, which suggests roughly $125 billion in new capital will passively flow into Chinese equities this year. But with China's manufacturing sector in contraction and its lowest growth target in 30 years, an end to the trade war with the US is imperative. Indeed, the news on this front has been quite positive and the recovery rally in global equity markets reflects this expectation.
The federal government shutdown resulted in the BEA releasing a combined first-and-second estimate of Q4 US real GDP growth. The results showed that the U.S. economy grew at an annualized rate of 2.6% during Q4, which was lower than Q2 and Q3. However, total 4Q2018 GDP was actually 3.1% higher than total 4Q2017 GDP, so we need to keep in perspective short-term fluctuations in annualized growth rates. Moreover, it will be interesting to see the Q4 reading on real Gross Output (GO), which is gaining traction as a key metric among economists since it measures total economic activity including transactions within the supply chain and not just final products. For Q3, when GDP measured 3.4%, GO came in at 3.9%, and historically, when GO grows faster than GDP, it foreshadows continued strong growth. Moreover, business investment grew 7.2% during 2018, which First Trust Advisors pointed out was the fastest growth for any year since 2011. And Consumer Confidence recently came in at 131.4, which is back to its lofty levels, and consumer credit default rates continue to drop. Nevertheless, looking ahead to 1Q2019, the Atlanta Fed’s GDPNow model (as of March 4) is forecasting only 0.3% GDP growth for 1Q2019, while the New York Fed’s Nowcast model (as of March 1) forecasts 0.88%.
Of course, the key drivers of equity valuations are earnings and interest rates. Expected corporate EPS growth is only about 5% for 2019 (down from 23% growth in 2018), and some commentators are seeing the slowdown in Q4 GDP growth and the possibility of an outright earnings recession in Q1 as evidence that we are in a late-cycle economy, with a recession on the horizon. But to me, all of this is simply reflecting hesitation among businesses to boost capital spending until there is resolution on the China trade negotiations (and perhaps to a lesser extent on the final Brexit deal). Once such major issues are out of the way, the underlying fiscal stimuli should kick into higher gear, enticing companies to boost capital spending plans and increase guidance, thus fueling stronger growth in supply-side fashion. There are plenty of macro indicators that suggest the economy is still mid cycle, including the significant contributions to GDP from nonresidential fixed investment and private inventory investment.
As for interest rates, there is another FOMC meeting coming up in March, so investors will be listening intently for any changes to the Fed’s language that recently transitioned from “autopilot” rate hikes and balance sheet reduction to patience, flexibility, and a commitment to data-dependence given the economic and political environment. Fed chair Jay Powell seems to have concluded that the fed funds rate is now essentially at the elusive “neutral rate,” and that it indeed matters to a heavily-indebted and inter-dependent global economy when US rates rise and liquidity is pulled out of the financial system. Inflation is still not a concern these days, as the BLS last reported CPI inflation of 1.6%, while the 5-year break-even for US TIPS is 1.85%. Moreover, given that wages and the labor force participation rate are finally starting to rise, and given that this helps address income inequality (which has become such a political hot-button), the Fed will be reluctant to do anything to change the direction of this dynamic. The CME Group fed funds futures are placing only a 6% probability of another rate hike by January 2020, and they actually show a 10% probability of at least one rate cut by then.
Thus, Treasury yields still haven’t moved this year. The 10-year US T-note closed Monday at 2.72% while the 2-year closed at 2.55%, so, the 2-10 spread is only 17 bps. If instead use the shorter-term 3-month T-bill at 2.46%, the spread versus the 10-year T-note is 26 bps. This flattening of the yield curve has caused concern among some analysts of a potential inversion, ultimately leading to a recession. But in my view, because such inversions historically have been caused by Fed rate hikes, this FOMC is going to be very cautious about playing any role in inverting the curve. So, with the Fed on the sidelines with respect to any further rate hikes, current rates look pretty good compared with other risk-free developed market 10-year yields, like France at +0.56%, Germany at +0.65%, and Japan at 0.00%. Even troubled Italy only pays 2.74%. Notably, ten years after the end of the Financial Crisis, $11 trillion in sovereign debt still trades at negative yields.
Moreover, I still believe that the geopolitical risks coupled with the relative safety, stability and low inflation here at home will continue to maintain strength in the dollar and a demand for US Treasuries by attracting foreign capital flows. There is rising demand for yield among the aging populations in developed markets and rising institutional portfolios (including pensions and superannuation funds), not to mention the large fixed-income mutual funds and ETFs whose mandate is to track the cap-weighted market indexes (i.e., they must buy Treasuries in their proportion to the broad fixed-income market). As a result, rising Treasury yields largely become self-limiting in that they ultimately attract a bid.
In addition, the Fed has signaled an end to quantitative tightening this year. After peaking in January 2015 at $4.5 trillion, the Fed’s balance sheet has shrunk to $4 trillion, so let's say it goes on hold at about $3.5 trilliion. But as I pointed out back in 2017, there are some good reasons why the Fed may need to maintain a larger balance sheet than it has historically, such as an increased foreign demand for U.S. dollars. The Fed itself estimated back in 2017 that the global economy likely would require dollar circulation to grow to $2.5 trillion over the ensuing decade. So, what’s another $1 trillion among friends?
I also have read opinions suggesting that international developed and emerging stock markets may outperform the US this year on a relative basis, citing that the MSCI All Country World (ACWI) ex-USA sports a P/E ratio 20% cheaper than the S&P 500. But I see this as yet another example of taking a single metric out of context. Regarding the MSCI ACWI, the largest sector exposure is Financial at 22%, with InfoTech at only 8%, while the S&P 500 has a 21% weighting in InfoTech and only 13% in Financial. Given that Financial is traditionally considered value-oriented with a lower P/E while InfoTech is traditionally growth-oriented with a higher P/E, it makes perfect sense that the more value-oriented MSCI ACWI index will display a much lower P/E. Thus, I do not think that this P/E gap is destined to close in a significant way (unless the global economy goes into a steep recession).
Comments on the February Baker’s Dozen portfolio:
As Sabrient’s February Baker’s Dozen passes its 1-year mark, let me take a moment to comment on the changing market conditions over the past year and their impact on portfolio performance. As you might expect given the strong economic climate and solid corporate earnings estimates, our growth-at-a-reasonable-price (GARP) model pointed us toward cyclicals and small-mid caps, which typically thrive when the economy is strong. But on 6/11/2018, the trade war with China escalated from rhetoric to reality, and when combined with increasingly hawkish Federal Reserve seemingly hellbent on raising rates and withdrawing liquidity from the financial system, the market embarked upon a fear-based risk-off rotation into defensive sectors (like Healthcare, Utilities, Consumer Staples, and Telecom) and mega-caps (including AAPL, AMZN, MSFT – the three largest holdings in the S&P 500), despite little change in the positive economic outlook.
Thus, most of the underperformance of portfolios occurred during the timeframe 6/11–9/20 as the market starkly bifurcated, with the S&P 500 large-cap index continuing to rise on the backs of defensive sectors and mega-caps while risk-on cyclical sectors and small-mid caps fell. But this was not healthy behavior (and unwarranted, according to our model), and ultimately, the broad market sold off in Q4, led to the downside by mega-caps AMZN and AAPL. As the S&P 500 hit the depths of its selloff on the Christmas Eve “capitulation day,” investors in my view were essentially pricing stocks for a global recession and 5% Treasury yields.
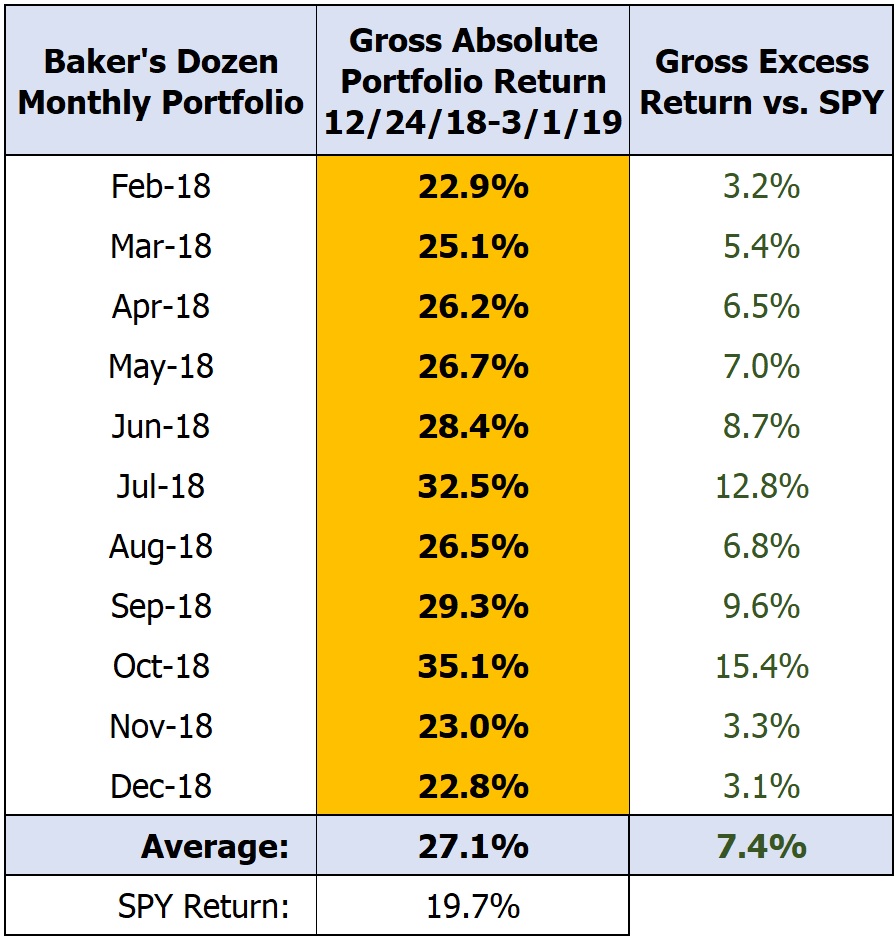
But the reality is that the economic outlook and corporate forward guidance remained stable, or in many cases improved, while interest rates remained low. So, as a result of the selloff, forward stock valuations were much more attractive going into 2019, setting up a terrific buying opportunity – particularly among the small-mid caps and cyclical sectors that typically thrive in a growing economy. For example, a cyclical industry like Steel (using an ETF proxy like SLX) started 2018 at a 14.2 forward P/E, but by the end of the year it had fallen to a meager 6.4 despite little change in outlook. Not surprisingly, the market has been quite strong ever since that panic-stricken Christmas Eve, led by cyclicals and small-mid caps. In fact, all 12 of our 2018 Baker’s Dozen monthly portfolios have handily outperformed the benchmark on a gross performance basis ever since – averaging +27.0% vs +18.8% for the S&P 500 from through 2/20/19 when the Jan portfolio terminated, and the 11 Feb-Dec portfolios have averaged +27.1% through 3/1/19, vs +19.7% for the S&P 500. This even outperforms the +25.7% performance put up by a pure small-cap index like the Russell 2000. This impressive performance has served as an encouraging reminder that timeless growth-at-a-reasonable-price (GARP) investing is not dead.
Of course, holding small-mid caps and cyclicals displaying strong growth forecasts, solid earnings quality, and attractive forward valuations is normally the profitable thing to do when the economy is growing and interest rates are low, but it sure didn’t work very well in 2H2018. Overall, the actual aggregate earnings growth of our February 2018 portfolio came in 18% better than expectations at launch, but the forward P/E fell 20%, as shown in the table below.
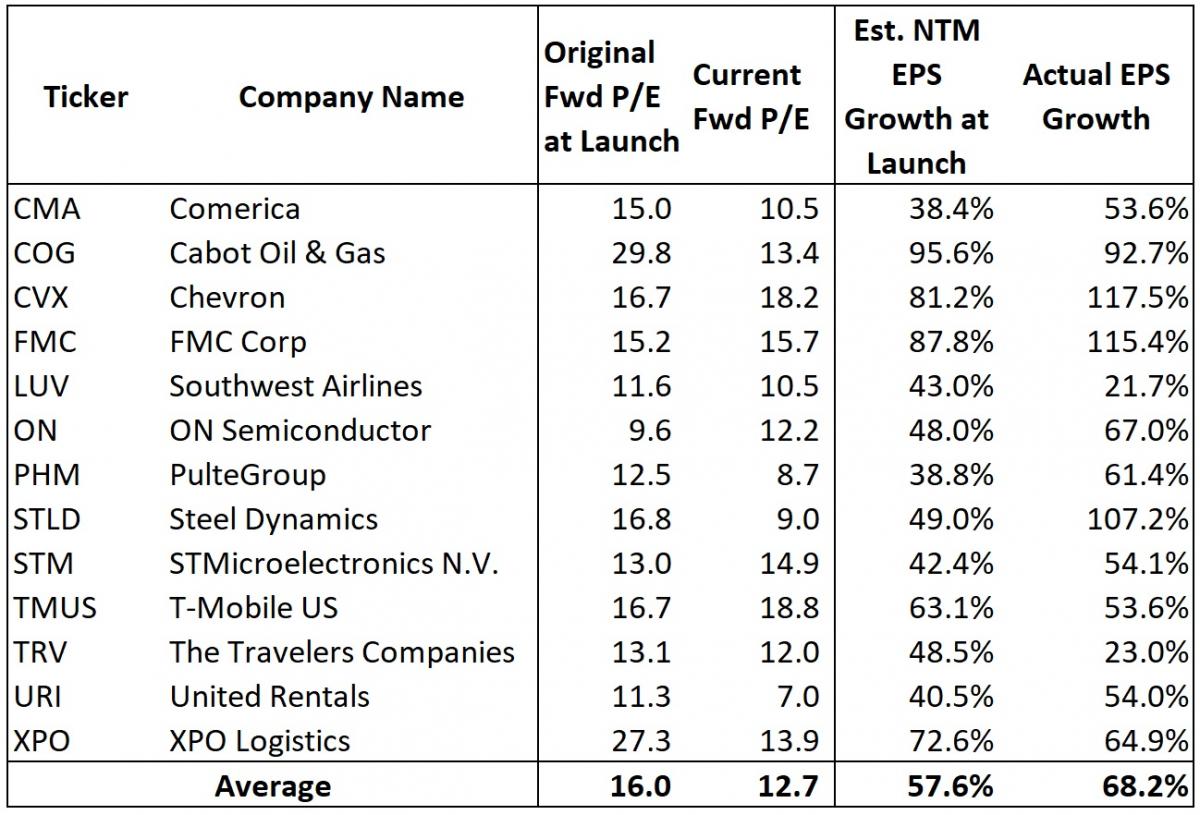
That’s not the way it’s supposed to work when your stocks produce even better earnings than expected. As a result, the forward valuations of these names are much more attractive today, with some displaying single-digit forward P/Es, even after the bullish recovery of the past two months. Our model-driven approach simply seeks strong growth at a reasonable price, but we can’t predict irrational investor behavior. Fortunately, investors being nonaligned with fundamentals is normally a transitory phenomenon, and history has shown that stock prices eventually reflect fundamentals. And unless guidance is suddenly slashed due to a major unforeseen macro event, we expect quality stocks like these from risk-on market segments to continue their impressive recovery, as valuations seem more reflective of a recessionary economy and much higher interest rates.
SPY Chart Review:
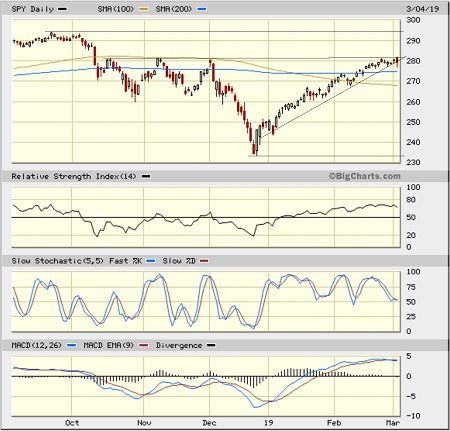
The SPDR S&P 500 ETF (SPY) closed Monday (March 4) just below 279.38. After that scary “capitulation” day on Christmas Eve, investors have been loath to do much selling, likely in fear of missing out on further upside. I continue to expect price to pullback for some much-needed consolidation and profit-taking – if for no other reason than working off overbought technicals. Price has hit strong overhead resistance around 280, and the last two daily candlesticks (a doji and a “hanging man”) indicate a likely pullback. Oscillators RSI, Slow Stochastic, and MACD are all seeking to pull back from extremely overbought territory. This should finally bring price down a bit and allow the bulls to gather new troops and renew conviction before another challenge of the 280 level. All of the key daily moving average curves were successfully recaptured, including the 20, 50, 100, and 200-day. You can see in the chart that the 200-day simple moving average offered temporary resistance in early February, but the second attempt several days later was successful.
Latest Sector Rankings:
Relative sector rankings are based on our proprietary SectorCast model, which builds a composite profile of each of over 600 equity ETFs based on bottom-up aggregate scoring of the constituent stocks. The Outlook Score employs a forward-looking, fundamentals-based multifactor algorithm considering forward valuation, historical and projected earnings growth, the dynamics of Wall Street analysts’ consensus earnings estimates and recent revisions (up or down), quality and sustainability of reported earnings, and various return ratios. It helps us predict relative performance over the next 2-6 months.
In addition, SectorCast computes a Bull Score and Bear Score for each ETF based on recent price behavior of the constituent stocks on particularly strong and weak market days. A high Bull score indicates that stocks within the ETF recently have tended toward relative outperformance when the market is strong, while a high Bear score indicates that stocks within the ETF have tended to hold up relatively well (i.e., safe havens) when the market is weak.
Outlook score is forward-looking while Bull and Bear are backward-looking. As a group, these three scores can be helpful for positioning a portfolio for a given set of anticipated market conditions. Of course, each ETF holds a unique portfolio of stocks and position weights, so the sectors represented will score differently depending upon which set of ETFs is used. We use the iShares that represent the ten major U.S. business sectors: Financial (IYF), Technology (IYW), Industrial (IYJ), Healthcare (IYH), Consumer Goods (IYK), Consumer Services (IYC), Energy (IYE), Basic Materials (IYM), Telecommunications (IYZ), and Utilities (IDU). Whereas the Select Sector SPDRs only contain stocks from the S&P 500 large cap index, I prefer the iShares for their larger universe and broader diversity.
Here are some of my observations on this week’s scores:
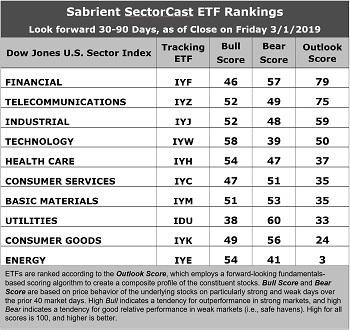
1. Financial remains in the top spot with an Outlook score of 79. It displays an attractive forward P/E of 14.6x, a good forward year-over-year EPS growth rate of 14.0%, a forward PEG (ratio of forward P/E to forward EPS growth rate) of 1.05, good insider sentiment (open market buying), and good sell-side analyst sentiment (net positive revisions to EPS estimates), since most of the sectors have been seeing negative revisions. Telecom stays in the second spot with an Outlook score of 75, as it displays the lowest forward P/E of 13.6x and good return ratios. However, it has absorbed some significant reductions to earnings estimates and its pure GARP metrics are only average, with projected year-over-year EPS growth rate of only 8.6% and a forward PEG ratio of 1.57, which ranks it only 7th out of 10 sectors on PEG (this is why we don’t see many Telecoms as candidates for Sabrient’s GARP portfolios, which have a 12-24 month outlook rather than 3-6 months). Industrial remains in third with reasonably solid scores across the board. Technology, Healthcare, Consumer Services (Discretionary/Cyclical), and Basic Materials round out the top seven.
2. At the bottom of the rankings we find Energy and Consumer Goods (Staples/Noncyclical). Energy continues to get hit with downward earnings revisions for 2019 (although 2020 looks much better), and it has the highest forward P/E of 19.5x (least attractive, and weak return ratios, although it also displays the strongest projected year-over-year EPS growth rate of 27% and the lowest forward PEG of 0.72 (which has increased quite a bit since last month).
3. Looking at the Bull scores, Technology enjoys the top score of 58, followed by Energy and Healthcare at 54, as stocks within these sectors have displayed relative strength on strong market days. Defensive sector Utilities scores the lowest at 38. The top-bottom spread is 20 points, which reflects low sector correlations on strong market days. It is desirable in a healthy market to see low correlations reflected in a top-bottom spread of at least 20 points, which indicates that investors have clear preferences in the market segments and stocks they want to hold (rather than broad risk-on behavior).
4. Looking at the Bear scores, as usual we find defensive sector Utilities alone in the top spot with a score of 60, followed by Financial at 57 and Consumer Goods at 56, which means that stocks within these sectors have been the preferred safe havens lately on weak market days. Technology has the lowest score of 39, as investors have fled during recent market weakness. The top-bottom spread is 21 points, which reflects low sector correlations on weak market days. Ideally, certain sectors will hold up relatively well while others are selling off (rather than broad risk-off behavior), so it is desirable in a healthy market to see low correlations reflected in a top-bottom spread of at least 20 points.
5. Financial displays the best all-around combination of Outlook/Bull/Bear scores, followed by Telecom, while Energy is the worst. Looking at just the Bull/Bear combination, Consumer Goods is the best, followed by Materials (which has the better balance between the Bull and Bear scores), indicating superior relative performance (on average) in extreme market conditions (whether bullish or bearish), while Energy scores the worst.
6. This week’s fundamentals-based Outlook rankings reflect a bullish bias, given that five of the top seven sectors are economically-sensitive or cyclical, and one (Healthcare) is all-weather. Keep in mind, the Outlook Rank does not include timing, momentum, or relative strength factors, but rather reflects the consensus fundamental expectations at a given point in time for individual stocks, aggregated by sector.
ETF Trading Ideas:
Our Sector Rotation model, which appropriately weights Outlook, Bull, and Bear scores in accordance with the overall market’s prevailing trend (bullish, neutral, or defensive), now displays a bullish bias and suggests holding Technology (IYW), Telecom (IYZ), and Industrials (IYJ), in that order. (Note: In this model, we consider the bias to be bullish from a rules-based trend-following standpoint when SPY is above both its 50-day and 200-day simple moving averages.)
Besides iShares’ IYW, IYZ, and IYJ, other highly-ranked ETFs in our SectorCast model (which scores nearly 500 US-listed equity ETFs) from the Technology, Telecom, and Industrial sectors include ProShares Ultra Semiconductors (USD), ProShares Ultra Telecommunications (LTL), and VanEck Vectors Steel (SLX).
If you prefer a neutral bias, the Sector Rotation model suggests holding Financial, Telecom, and Industrial, in that order. On the other hand, if you are more comfortable with a defensive stance on the market, the model suggests holding Financial, Utilities, and Telecom, in that order.
An assortment of other interesting ETFs that are scoring well in our latest rankings include WBI BullBear Yield 2000 (WBIC), SPDR S&P Capital Markets (KCE), First Trust NASDAQ Bank (FTXO), Global X SuperDividend REIT (SRET), Oppenheimer S&P Financials Revenue (RWW), WBI BullBear Value 1000 (WBIF), InfraCap MLP (AMZA), SPDR S&P Buyback (SPYB), WisdomTree US SmallCap Quality Dividend Growth (DGRS), SPDR S&P Pharmaceuticals (XPH), Pacer US Cash Cows 100 (COWZ), ALPS Alerian MLP (AMLP), ProShares Ultra Nasdaq Biotechnology (BIB), and VanEck Vectors Uranium Nuclear Energy (NLR).
IMPORTANT NOTE: I post this information periodically as a free look inside some of our institutional research and as a source of some trading ideas for your own further investigation. It is not intended to be traded directly as a rules-based strategy in a real money portfolio. I am simply showing what a sector rotation model might suggest if a given portfolio was due for a rebalance, and I do not update the information on a regular schedule or on technical triggers. There are many ways for a client to trade such a strategy, including monthly or quarterly rebalancing, perhaps with interim adjustments to the bullish/neutral/defensive bias when warranted, but not necessarily on the days that I happen to post this article. The enhanced strategy seeks higher returns by employing individual stocks (or stock options) that are also highly ranked, but this introduces greater risks and volatility. I do not track performance of the ideas mentioned here as a managed portfolio.
Disclosure: The author has no positions in stocks or ETFs mentioned.
Disclaimer: This newsletter is published solely for informational purposes and is not to be construed as advice or a recommendation to specific individuals. Individuals should take into account their personal financial circumstances in acting on any opinions, commentary, rankings, or stock selections provided by Sabrient Systems or its wholly-owned subsidiary Gradient Analytics. Sabrient makes no representations that the techniques used in its rankings or analysis will result in or guarantee profits in trading. Trading involves risk, including possible loss of principal and other losses, and past performance is no indication of future results.