Sector Detector: Fed drops the green flag and bulls are off to the races
 Well, Fed Chairman Bernanke has proved me wrong by dipping his toe into the dreaded tapering of QE3. In retrospect, I suppose he preferred to take this first step on his own rather than put the onus (and any associated fallout) on the back on his successor. However, by wrapping his announcement with a pink bow and couching it in reassuring terms, stocks reacted favorably -- and on strong volume, to boot. In fact, I think it’s safe to say that Bernanke said all the right things and equity investors took it as the green flag for their widely-anticipated year-end rally. It’s always easier to forge ahead into uncharted territory when you know there’s someone powerful who’s got your back.
Despite an initially negative knee-jerk reaction to the Fed’s taper announcement, the Dow Industrials and S&P 500 both closed Wednesday at new highs, and the NASDAQ and Russell 2000 are not far behind. The late-day rally was led by Financial and Healthcare sectors. Over the past week, Industrial and Materials also have been strong. Notably, ever since interest rates began rising in late-October, Telecom has fallen behind, trading in line with Utilities.
Also contributing to the bullish mood, the Senate passed the two-year budget bill that the House had already passed last week. After the President signs it, the next hurdle is for the respective Appropriations committees to figure out the details on how to allocate the funds among thousands of programs. More sparks are sure to fly.
The Fed will make a token start to tapering by reducing monthly bond-buying from $85 million to $75 million, the money printing has ballooned its balance sheet to nearly $4 trillion in assets -- which is exceeded only by BlackRock’s $4.1 trillion in AUM. Although the economy has shown sufficient signs of recovery to spur the Fed’s move, the reality is that the M1 Multiplier (MULT) remains historically low as banks are loath to lend at these interest rate spreads, while at the same time corporations are hoarding cash and issuing bonds at an unprecedented rate to back shares rather than investing in future growth. At this point in the recovery cycle, continued earnings growth will depend upon revenue growth, and for that to occur we need to see companies expand, build, and hire.
For investors, ETFs continue to gain traction and acceptance. The latest ETP (Exchange-Traded Products) Landscape report from BlackRock shows that developed markets were responsible for the growth in assets, with U.S. listings in particular growing the fastest. Money flows into emerging markets have lagged considerably.
By the way, Sabrient’s renowned “Baker’s Dozen” annual portfolio of high-potential GARP stocks will unveil its 2014 picks on January 13. The 2013 portfolio continues to outperform by a wide margin, more than doubling the S&P 500 return, with all 13 positions comfortably positive by double-digit percentages, led by Jazz Pharmaceuticals (JAZZ). It has endured none of those upsetting meltdowns that can offset the strong performers, and we largely attribute this to screening with our proprietary Earnings Quality Rank (EQR), which is a pure accounting-based risk assessment signal based on the forensic accounting expertise of subsidiary Gradient Analytics. Note that Gradient’s prowess at identifying unsustainability in reported earnings was put on display recently when OSI Systems (OSIS) and Ulta Salon, Cosmetics & Fragrance (ULTA) both melted down after their earnings reports.
The SPY chart: The SPDR S&P 500 Trust (SPY) closed Wednesday at 181.70, which is another new closing high. It had been clinging to recent support around 178, and actually touched the 50-day simple moving average intraday before rocketing higher. Oscillators like RSI, MACD and Slow Stochastic all have turned back up from their consolidations. The Russell 2000 small caps have been even stronger the past several days. All systems are go for the year-end rally. Even if the SPY remains within its long-standing bullish rising channel, there’s room to run.
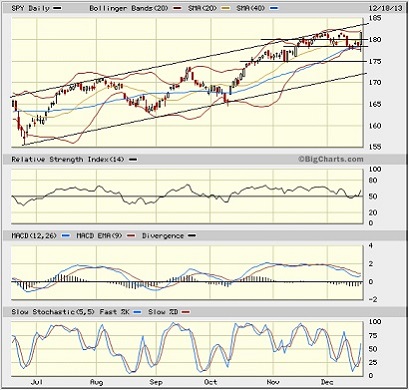
On Wednesday, the CBOE Market Volatility Index (VIX), a.k.a. “fear gauge,” fell 15% to close back below 15 at 13.80. Investors are showing no fear. However, some market observers are warning that we should expect higher volatilities in 2014.
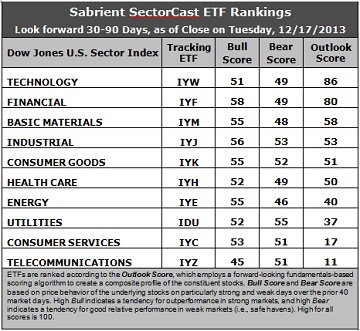
Latest rankings: The table ranks each of the ten U.S. business sector iShares ETFs by Sabrient's proprietary Outlook Score, which employs a forward-looking, fundamentals-based, quantitative algorithm to create a bottom-up composite profile of the constituent stocks within the ETF. The multi-factor model considers forward valuation, historical earnings trends, earnings growth prospects, the dynamics of Wall Street analysts' consensus estimates, accounting practices and earnings quality, and various return ratios. In addition, the table also shows Sabrient's proprietary Bull Score and Bear Score for each ETF.
High Bull score indicates that stocks within the ETF have tended recently toward relative outperformance during particularly strong market periods, while a high Bear score indicates that stocks within the ETF have tended to hold up relatively well during particularly weak market periods. Bull and Bear are backward-looking indicators of recent sentiment trend.
As a group, these three scores can be quite helpful for positioning a portfolio for a given set of anticipated market conditions.
Observations:
1. The rankings remain most stable again this week. Technology (IYW) retains the top spot with an Outlook score of 86. IYW still displays one of the lowest forward P/Es, a solid long-term forward growth rate, and the best return ratios, and strong sentiment among Wall Street analysts (upgrades to earnings estimates). Financial (IYF) takes second place again with an 80. It displays one of the lowest forward P/Es and excellent sentiment among both Wall Street analysts and company insiders. IYW and IYF continue to sit well above the rest of the field, with a 22-point gap above third place Basic Materials (IYM).
2. Telecom (IYZ) is in the cellar yet again with an Outlook score of 11. IYZ scores the among the lowest on every factor in the model, including the highest forward P/E, lowest return ratios, a low projected long-term growth rate, and poor sentiment among insiders and Wall Street analysts. Consumer Services (IYC) remains in the bottom two with an Outlook score that has fallen to 17. Although it enjoys the best projected long-term growth rate, IYC’s forward P/E is still too high relative to the other sectors.
3. This week’s fundamentals-based rankings seem to have maintained their bullish bias, with economically-sensitive sectors Tech, Financial, Materials, and Industrial making up the top four.
4. Looking at the Bull scores, Financial (IYF) has been the leader on strong market days, scoring 58. It is notable that 9 of the 10 sectors are scoring above 50, with the Telecom (IYZ) the notable laggard with a score of 45. The top-bottom spread has expanded to 13 points, which reflects somewhat lower sector correlations on particularly strong market days.
5. Looking at the Bear scores, Technology (IYW) has lost support during weak market days, and Utilities (IDU) has reemerged as the favorite “safe haven,” scoring 55. Energy (IYE) has the lowest score of 46. The top-bottom spread narrowed this week to 9 points, which indicates somewhat higher sector correlations on particularly weak market days.
6. Overall, IYF shows the best all-weather combination of Outlook/Bull/Bear scores. Adding up the three scores gives a total of 187. IYZ is the by far the worst at 107. Looking at just the Bull/Bear combination, IYJ displays the highest score of 109 this week. Their scores indicate good relative performance in extreme market conditions (whether bullish or bearish), while IYZ is the lowest at 96, which indicates investor avoidance (relatively speaking) during extreme conditions.
These Outlook scores represent the view once again that Technology and Financial sectors are still relatively undervalued, while Telecom and Consumer Services may be relatively overvalued based on our 1-3 month forward look.
Some highly-ranked stocks that are components of IYW and IYF include SanDisk (SNDK), Google (GOOG), Prudential Financial (PRU), and MasterCard (MA). Other ETFs worth considering from the Financial and Technology sectors include the PowerShares KBW High Dividend Yield Financial Portfolio (KBWD) and the First Trust NASDAQ Technology Dividend Index Fund (TDIV).
Disclosure: Author has no positions in stocks or ETFs mentioned.
About SectorCast: Rankings are based on Sabrient’s SectorCast model, which builds a composite profile of each equity ETF based on bottom-up aggregate scoring of the constituent stocks. The Outlook Score employs a fundamentals-based multi-factor approach considering forward valuation, earnings growth prospects, Wall Street analysts’ consensus revisions, accounting practices, and various return ratios. It has tested to be highly predictive for identifying the best (most undervalued) and worst (most overvalued) sectors, with a 1-3 month forward look.
Bull Score and Bear Score are based on the price behavior of the underlying stocks on particularly strong and weak days during the prior 40 market days. They reflect investor sentiment toward the stocks (on a relative basis) as either aggressive plays or safe havens. So, a high Bull score indicates that stocks within the ETF have tended recently toward relative outperformance during particularly strong market periods, while a high Bear score indicates that stocks within the ETF have tended to hold up relatively well during particularly weak market periods.
Thus, ETFs with high Bull scores generally perform better when the market is hot, ETFs with high Bear scores generally perform better when the market is weak, and ETFs with high Outlook scores generally perform well over time in various market conditions.
Of course, each ETF has a unique set of constituent stocks, so the sectors represented will score differently depending upon which set of ETFs is used. For Sector Detector, I use ten iShares ETFs representing the major U.S. business sectors.
About Trading Strategies: There are various ways to trade these rankings. First, you might run a sector rotation strategy in which you buy long the top 2-4 ETFs from SectorCast-ETF, rebalancing either on a fixed schedule (e.g., monthly or quarterly) or when the rankings change significantly. Another alternative is to enhance a position in the SPDR Trust exchange-traded fund (SPY) depending upon your market bias. If you are bullish on the broad market, you can go long the SPY and enhance it with additional long positions in the top-ranked sector ETFs. Conversely, if you are bearish and short (or buy puts on) the SPY, you could also consider shorting the two lowest-ranked sector ETFs to enhance your short bias.
However, if you prefer not to bet on market direction, you could try a market-neutral, long/short trade—that is, go long (or buy call options on) the top-ranked ETFs and short (or buy put options on) the lowest-ranked ETFs. And here’s a more aggressive strategy to consider: You might trade some of the highest and lowest ranked stocks from within those top and bottom-ranked ETFs.