Sector Detector: Bulls gather conviction as fundamentals regain importance in eyes of investors
March Madness is in its full glory with some of the most epic displays of competition, controversy, surprises, and visuals we have ever seen. Oh, and the NCAA basketball tournament is pretty incredible, too, but that’s not what I’m talking about. I’m talking about the U.S. presidential election. And it has produced some crazy headlines, news clips, and sound bites. We have hugely popular candidates ranting about topics ranging from massive walls, to repealing laws, to the size of one’s private parts, to riots if there is a brokered convention, to targeting corporations that seem to be “predatory,” to Denmark as the appropriate model for American political policies.
But in the midst of all this misdirection, corporate America seems to be finding a path to climb out of its rut. So, although earnings might remain weak for the short term, the prognosis is good for the back half of the year, and stocks seem to be reflecting an expectation of improving fundamentals rather than the latest attention-grabbing headline. I told advisors during my travels earlier this year (during the market meltdown) that I believe we will see a flight back to quality this year, a return to valuation-driven investing, including value, GARP, and dividend strategies, along with a stabilization and slight recovery in oil and commodity prices. I also said that we could see new highs in the S&P 500 later this year, and perhaps a double-digit total return for the year. I still think these are in the cards.
In this periodic update, I give my view of the current market environment, offer a technical analysis of the S&P 500 chart, review our weekly fundamentals-based SectorCast rankings of the ten U.S. business sectors, and then offer up some actionable ETF trading ideas.
Market overview:
Yes, the headlines are often borderline crazy, but the good news is that investors seem to be ready to move on from their short-term focus and look toward longer-term fundamentals. From an investor’s standpoint, at least three of the four main headline grabbers (China, oil, Fed, election) of the recent past may have finally moved themselves to page two of the newspaper. China appears to be on a workable path to stabilizing the yuan, although global currency wars continue. Oil prices have rallied substantially, which has not only bolstered some Energy sector balance sheets but also helped lessened the doom-and-gloom in the high yield market. And the Federal Reserve has calmed nerves by demonstrating a willingness to adjust its rate hike intentions.
As for the election, however, it is pretty evident this year just how polarized our society has become, with candidates ranging from Tea Party conservatives to democratic socialists, and populist messages of all sorts gaining plenty of traction. Donald Trump might not like it, but the GOP’s system of electing delegates to a convention where a party representative is then chosen for the general election, has been in place for 160 years. During that time there have been ten instances (roughly 25% of the time) in which no GOP candidate earned a majority of delegates, and in seven of those instances a candidate was chosen who didn’t have a plurality of the delegates (the most recent being 1952 with General Eisenhower) but instead was deemed most likely to win the election.
Meanwhile, improving economic data has been a boon to risk assets over the past several weeks, but the February retail sales report and the January revised number were quite disappointing. However, if we focus solely on core retail sales (i.e., ex-auto and gasoline), the numbers were solid -- setting a record in February and gaining more than 4% year-over-year.
Stocks have indeed responded. Surprise! The S&P 500 total return turned positive YTD on Monday, albeit ever so slightly (less than 1%). ETF money flows have pushed over $5 billion into domestic equity ETFs over the past week. Moreover, the S&P 500 is now providing a 2.17% dividend yield, while interest rates remain at historical lows with the 10-year Treasury yield closing Monday at 1.92% and the 2-year yield closed at 0.87%, with the spread between them rising slightly from 99 bps two weeks ago to 105 bps today.
As widely expected, the March FOMC meeting concluded with no change in the fed funds rate and the announcement that it will likely raise rates only twice this year instead of the previously indicated four times. Thus, the Fed has been able to create the illusion that it is easing -- at least relative to the prior timetable. Fed funds futures are now pricing the probability of at least one quarter-point hike in April at 7%, June 38%, September 60%, and by December there is a 74% probability of at least one hike and a 34% chance that we will see two rate hikes.
Yes, the Fed is your friend, and “Don’t fight the Fed” is still the operative adage as it is committed to supporting the U.S. economy even while trying to normalize rates. Note that the December rate hike was the first one in history in which bank reserves did not contract, with $2 trillion in excess reserves still in place. Monetary policy is actually loosening as M2 money supply has accelerated to 8% annualized growth. Nevertheless, I will say yet again that monetary policy is not a long-term structural answer to slow growth. Rather, a coherent fiscal policy (e.g., taxes, spending, and regulation) is essential, as implored by the G-20 consensus.
As for corporate earnings, Q1 2016 is likely to reveal the biggest contraction in earnings since the Great Recession, thus marking the fourth consecutive quarter of YOY declines, and Q2 might not be much better. But Wall Street’s consensus is that the second half of 2016 looks much stronger than the first half, and investors appear to be looking ahead.
Moreover, much has been made of the lack of inflation, slow GDP growth, and sluggish corporate revenue growth despite the open spigot of liquidity around the world, but smart investors realize that most of the incredible technological advances that entrepreneurs continually create are inherently deflationary in that they create higher productivity or lower cost solutions. For example, when I left the oil industry in 2000, the prevailing expectation was for peak oil in which global demand would overwhelm supply, driving prices above $200/bbl until shale oil and other tight formations would become economic to produce, and the U.S. would be 100% dependent on oil imports and at the mercy of hostile regimes overseas. But intrepid capitalists and entrepreneurs have made such tight oil economic at more like $40/bbl, and North America is now essentially energy independent, with Congress recently lifting its 40-year ban on oil exports.
And then there are entrepreneurial icons like Jeff Bezos and Elon Musk, motivated by dreams more than riches, and launching private enterprise into areas once controlled totally by inefficient government agencies. Thus, the Fed’s 2% inflation target seems arbitrary and outdated as entrepreneurial activity in new technologies accelerates innovation and its inevitable byproducts of productivity and yes, deflation -- but most importantly, prosperity.
As stocks have begun reflecting a prognosis for improving fundamentals and earnings, it bodes well for the fundamentals-based, quality-oriented, GARP (growth at a reasonable price) strategies preferred by firms like Sabrient as well as many famous valuation-driven investors and large activist hedge funds. Last year, news headlines, competing global central banks’ monetary policies, currency wars, Fed watch, falling oil and commodity prices, widening credit spreads, China’s economic and currency manipulations, ISIS-inspired terrorism, and election cycle rhetoric all buffeted stocks and created a narrow trader’s market -- making almost irrelevant a disciplined quantitative numbers-driven approach that had worked so well for us for so long. Indeed, much equity investment has shifted from active management and stock-picking products into passive index funds. But we might be seeing signs that stock picking is coming back in vogue.
The CBOE Market Volatility Index (VIX), a.k.a. fear gauge, closed Friday at 14.02 and Monday at 13.79, which is the lowest reading since August 18. It is back below 15 and solidly in the zone of complacency.
SPY chart review:
The SPDR S&P 500 Trust (SPY) closed Monday at 204.67 and is back above all its major moving averages. In mid-February it formed a double-bottom and bounced strongly from the long-standing support line of “last resort” near 182. In the process it also formed a bullish W-pattern, which needed confirmation via a solid break above the mid-line of the W at the 195 level, which also happened to be the 50-day simple moving average. After consolidating around that level for several days, SPY finally broke out, but with a succession of resistance lines offering up stiff challenges. Next up was a test of strong round-number resistance at 200, which also happened to be the 100-day SMA. After consolidating around that level for several days, the magnetic pull of the bearish gap down from 204 on the first trading day of the year kicked in, but first it took a few days to test bullish conviction at the downtrend line from early November, which also happened to converge with the 200-day SMA. After breaking above that line last week, the gap up to 204 was filled, and SPY is now consolidating at this level. However, bulls may be getting a bit gassed at this point and may need to let price pull back to test resistance-turned-support at 200. Oscillators RSI, MACD, and Slow Stochastic are all overbought. Notably, the iShares MSCI Emerging Markets (EEM) is challenging its 200-day SMA, as well, while the important iShares Transportation Average (IYT) is up 7.7% YTD and well above its 200-day.

Latest sector rankings:
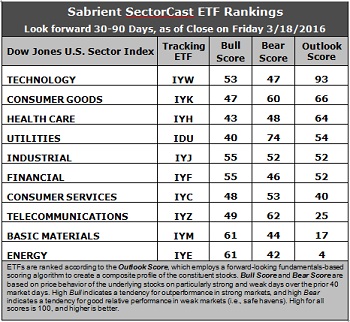
Relative sector rankings are based on our proprietary SectorCast model, which builds a composite profile of each equity ETF based on bottom-up aggregate scoring of the constituent stocks. The Outlook Score employs a forward-looking, fundamentals-based multifactor algorithm considering forward valuation, historical and projected earnings growth, the dynamics of Wall Street analysts’ consensus earnings estimates and recent revisions (up or down), quality and sustainability of reported earnings (forensic accounting), and various return ratios. It helps us predict relative performance over the next 1-3 months.
In addition, SectorCast computes a Bull Score and Bear Score for each ETF based on recent price behavior of the constituent stocks on particularly strong and weak market days. High Bull score indicates that stocks within the ETF recently have tended toward relative outperformance when the market is strong, while a high Bear score indicates that stocks within the ETF have tended to hold up relatively well (i.e., safe havens) when the market is weak.
Outlook score is forward-looking while Bull and Bear are backward-looking. As a group, these three scores can be helpful for positioning a portfolio for a given set of anticipated market conditions. Of course, each ETF holds a unique portfolio of stocks and position weights, so the sectors represented will score differently depending upon which set of ETFs is used. We use the iShares that represent the ten major U.S. business sectors: Financial (IYF), Technology (IYW), Industrial (IYJ), Healthcare (IYH), Consumer Goods (IYK), Consumer Services (IYC), Energy (IYE), Basic Materials (IYM), Telecommunications (IYZ), and Utilities (IDU). Whereas the Select Sector SPDRs only contain stocks from the S&P 500, I prefer the iShares for their larger universe and broader diversity. Fidelity also offers a group of sector ETFs with an even larger number of constituents in each.
Here are some of my observations on this week’s scores:
1. Technology retains the top spot with a robust Outlook score of 93. It is the only sector this week displaying net positive Wall Street analyst sentiment (net upward revisions to earnings estimates). It also has the highest forward long-term growth rate, solid return ratios, a reasonably low forward P/E, and the best insider sentiment. After Technology there is a 27-point gap down to Consumer Goods (Staples/Noncyclical) in the second spot with an Outlook score of 66. However, this sector’s scores are primarily driven by two factors: strong return ratios and relatively good sell-side sentiment (i.e., not so much in the way of downward revisions to earnings estimates), which you would expect from firms offering a non-cyclical product line. Healthcare takes the third spot, followed by Utilities, Industrial, and Financial, which all score above 50. Notably, Financial still displays the lowest aggregate forward P/E (14.5x), although Healthcare is a close second at 14.9x, given how the sector has sold off due to negative election year rhetoric. Also notable is the continued rise in Industrial, which is bullish.
2. Energy remains mired firmly at the bottom with an Outlook score of 4 as the sector scores among the worst in all factors of the GARP model, including the highest forward P/E (30.7x), which has risen dramatically as the sector has rallied in correlation with the rise in oil prices. Note that it is the only sector to display a negative long-term growth rate. Basic Materials again takes the other spot in the bottom two with an Outlook score of 17 and continues to bear the brunt of the downward revisions to earnings estimates, although the forward P/E of 18.1x is much lower than Energy.
3. Looking at the Bull scores, Energy and Basic Materials top the list with a 61, as short-covering and bottom-fishing kick in on strong market days, while Utilities is the lowest at 40. The top-bottom spread is 21 points, which continues to reflect low sector correlations on strong market days, which is good for stock picking. It is generally desirable in a healthy market to see low correlations reflected in a top-bottom spread of at least 20 points, which indicates that investors have clear preferences in the stocks they want to hold (rather than broad risk-on behavior).
4. Looking at the Bear scores, Utilities (as usual) displays the top score of 74, which is quite robust, followed by Telecom at 62, which means that stocks within Utilities have been the preferred safe havens on weak market days. Energy scores the lowest at 42, as investors flee during market weakness (which is usually correlated with falling oil prices these days). The top-bottom spread is 20 points, which reflects low sector correlations on weak market days, which is good for stock picking. Ideally, certain sectors will hold up relatively well while others are selling off (rather than broad risk-off behavior), so it is generally desirable in a healthy market to see low correlations reflected in a top-bottom spread of at least 20 points.
5. Technology displays the best all-around combination of Outlook/Bull/Bear scores, while Energy is the worst. However, looking at just the Bull/Bear combination, Utilities is the best, followed by Telecom, indicating superior relative performance (on average) in extreme market conditions (whether bullish or bearish), while Healthcare is by far the worst.
6. This week’s fundamentals-based Outlook rankings still look neutral, with continuing signs of defensiveness given that Consumer Goods (Staples/Noncyclical) and Utilities are in the top four. On the other hand, Technology, Industrial, Financial, and all-weather Healthcare are all in the top six and scoring above 50, which is bullish. Keep in mind, the Outlook Rank does not include timing, momentum, or relative strength factors, but rather is a reflection of the fundamental expectations of individual stocks aggregated by sector.
ETF Trading Ideas:
Our Sector Rotation model, which appropriately weights Outlook, Bull, and Bear scores in accordance with the overall market’s prevailing trend (bullish, neutral, or defensive), now reflects a bullish bias and suggests holding Technology, Industrial, and Financial, in that order. (Note: In this model, we consider the bias to be neutral from a rules-based trend-following standpoint when SPY is between its 50-day and 200-day simple moving averages.)
Other highly-ranked ETFs in SectorCast from the Technology, Industrial, and Financial sectors include Market Vectors Semiconductor ETF (SMH), US Global Jets ETF (JETS), and PowerShares KBW High Dividend Yield Financial Portfolio (KBWD).
If you prefer to stick with a neutral bias, the Sector Rotation model suggests holding Technology, Consumer Goods (Staples/Noncyclical), and Healthcare, in that order. On the other hand, if you prefer a defensive stance on the market, the model suggests holding Utilities, Consumer Goods (Staples/Noncyclical), and Technology, in that order.
IMPORTANT NOTE: I post this information periodically as a free look inside some of our institutional research and as a source of some trading ideas for your own further investigation. It is not intended to be traded directly as a rules-based strategy in a real money portfolio. I am simply showing what a sector rotation model might suggest if a given portfolio was due for a rebalance, and I may or may not update the information each week. There are many ways for a client to trade such a strategy, including monthly or quarterly rebalancing, perhaps with interim adjustments to the bullish/neutral/defensive bias when warranted -- but not necessarily on the days that I happen to post this weekly article. The enhanced strategy seeks higher returns by employing individual stocks (or stock options) that are also highly ranked, but this introduces greater risks and volatility. I do not track performance of the ideas mentioned here as a managed portfolio.
Disclosure: Author has no positions in stocks or ETFs mentioned.
Disclaimer: This newsletter is published solely for informational purposes and is not to be construed as advice or a recommendation to specific individuals. Individuals should take into account their personal financial circumstances in acting on any rankings or stock selections provided by Sabrient. Sabrient makes no representations that the techniques used in its rankings or selections will result in or guarantee profits in trading. Trading involves risk, including possible loss of principal and other losses, and past performance is no indication of future results.