Sector Detector: Bullish technical picture appears to trump cautious fundamentals
Stocks closed last week on a strong note, with the S&P 500 notching a new high, despite lackluster economic data and growth. I have been suggesting in previous articles that stocks appeared to be coiling for a significant move but that the ingredients were not yet in place for either a major breakout or a corrective selloff. However, bulls appear to be losing patience awaiting their next definitive catalyst, and the higher-likelihood upside move may now be underway. Yet despite the bullish technical picture, this week’s fundamentals-based Outlook rankings look even more defensive.
In this weekly update, I give my view of the current market environment, offer a technical analysis of the S&P 500 chart, review our weekly fundamentals-based SectorCast rankings of the ten U.S. business sectors, and then offer up some actionable trading ideas, including a sector rotation strategy using ETFs and an enhanced version using top-ranked stocks from the top-ranked sectors.
Market overview:
All the major indexes are back comfortably above their psychological thresholds, including Dow at 18,000, S&P 500 at 2100, NASDAQ at 5,000, and Russell 2000 at 1200. And yet most of the U.S. economic reports lately have been surprisingly weak. Consumer sentiment fell to 88.6, industrial production fell for the fifth straight month (mainly due to the energy, mining and utilities segments), capacity utilization declined to 78.2%, consumer comfort index fell yet again, wholesale prices (PPI) tumbled, and April retail sales disappointed.
On the other hand, it must be said that “core” retail sales (x-autos, building materials, and gasoline) actually rose and March sales were revised upward to +1.1%. Also, the Federal budget deficit fell, overall debt levels continue to improve, the US dollar has receded from its recent highs, employment and wages are improving, public companies continue to reduce operating costs and leverage while boosting free cash flow; and Q1 corporate earnings reports have largely beat reduced expectations. Also worth noting, in April the U.S. Treasury Department reported an all-time monthly record of $288 billion in individual income tax payments (indicating that people are making more money and were under-withholding).
At the same time, the forward multiple on the S&P 500 earnings is now around 17x, which of course is on the high side (just ask Federal Reserve chair Janet Yellen). But U.S. investors have historically tended to shrug off such warnings from the Fed, and stocks have kept rising, led by the large caps. After getting off to a strong start in Q1, small and mid caps have significantly trailed the performance of large caps so far in Q2.
Dividend payments and buybacks are at all-time records, and yet non-financial firms still held $1.7 trillion in cash as of 2014 year-end, with Technology firms holding $690 billion of it, led by Apple (AAPL) with $178 billion, Microsoft (MSFT) $90 billion, and Google (GOOGL) $64 billion.
In Asia, Japan’s current account surplus hit a 7-year high. China is speeding up its implementation of policy changes in bank financing and introducing a debt-for-bond swap program intended to ease the burden on municipalities buried deeply in debt from aggressive construction and infrastructure development.
Fed funds futures are indicating only one quarter-point rise between now and December, and I’m not convinced it will even happen by then. Also, the 10-year Treasury yield closed Friday at 2.14% after finding resistance at its down-sloping 200-day simple moving average. Despite the recent run-up in yields, the dynamics remain in place for global liquidity to continue to flow into the safe and relatively attractive yields of U.S. Treasuries, which would ostensibly keep a cap on rising long-term yields. However, another important factor has been the use of leverage to boost yield, so any unwinding of leverage would put pressure on bond prices.
The CBOE Market Volatility Index (VIX), a.k.a. fear gauge, closed Friday at 12.38. It has been churning in this zone of complacency below the 15 fear threshold.
SPY chart review:
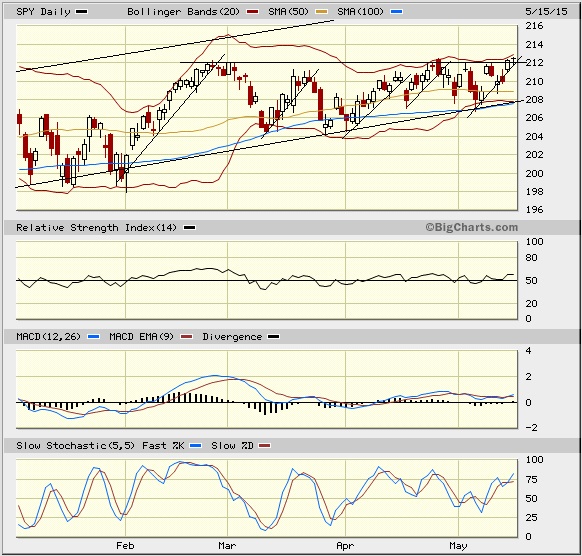
The SPDR S&P 500 Trust (SPY) closed Friday at 212.44. It’s been almost three years since the market pulled back at least 10%. The long-standing uptrend line and the 100-day simple moving average have been providing reliable support, and in fact the uptrend line has been steadily approaching the line of resistance at the February high in what might be the formation of a bullish ascending triangle pattern. Price has crossed the 210 level numerous times since mid-February during this lengthy consolidation period, while taking a series of runs at that line of resistance at 212 in what appears to be a series of flagpoles. The fact that there has been such strong support from the uptrend line and the 100-day simple moving average, coupled with a rising 200-day moving average, is bullish, and it makes it more likely that one of these breakout attempts through the 212 level will actually stick. Oscillators RSI, MACD, and Slow Stochastic are all either in neutral territory or pointing up bullishly. The Bollinger Bands have been pinched together tightly lately, making a larger move (whether up or down) more likely. At the moment, it appears that the upside breakout is more likely. Support levels include the 50-day simple moving average (around 209), the uptrend line and 100-day SMA (approaching 208), and the critical 200-day SMA (approaching 204), followed by round-number support at the 200 price level. If a breakout through resistance holds, there are blue skies overhead -- all the way up to the top line of the rising channel.
Latest sector rankings:
Relative sector rankings are based on our proprietary SectorCast model, which builds a composite profile of each equity ETF based on bottom-up aggregate scoring of the constituent stocks. The Outlook Score employs a forward-looking, fundamentals-based multifactor algorithm considering forward valuation, historical and projected earnings growth, the dynamics of Wall Street analysts’ consensus earnings estimates and recent revisions (up or down), quality and sustainability of reported earnings (forensic accounting), and various return ratios. It helps us predict relative performance over the next 1-3 months.
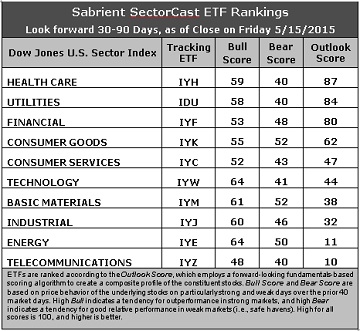
In addition, SectorCast computes a Bull Score and Bear Score for each ETF based on recent price behavior of the constituent stocks on particularly strong and weak market days. High Bull score indicates that stocks within the ETF recently have tended toward relative outperformance when the market is strong, while a high Bear score indicates that stocks within the ETF have tended to hold up relatively well (i.e., safe havens) when the market is weak.
Outlook score is forward-looking while Bull and Bear are backward-looking. As a group, these three scores can be helpful for positioning a portfolio for a given set of anticipated market conditions. Of course, each ETF holds a unique portfolio of stocks and position weights, so the sectors represented will score differently depending upon which set of ETFs is used. We use the iShares that represent the ten major U.S. business sectors: Financial (IYF), Technology (IYW), Industrial (IYJ), Healthcare (IYH), Consumer Goods (IYK), Consumer Services (IYC), Energy (IYE), Basic Materials (IYM), Telecommunications (IYZ), and Utilities (IDU). Whereas the Select Sector SPDRs only contain stocks from the S&P 500, I prefer the iShares for their larger universe and broader diversity. Fidelity also offers a group of sector ETFs with an even larger number of constituents in each.
Here are some of my observations on this week’s scores:
1. Healthcare remains in first place with a solid Outlook score of 87. Healthcare displays the best sell-side analyst sentiment (net positive revisions to earnings estimates) and good scores in other factors in the model, including return ratios and forward long-term growth rate, although forward P/E remains pricey. Utilities has moved up to second place with a score of 84, primarily due to its low forward P/E and solid Wall Street sentiment. Financials falls to third this week but still boasts a solid score of 80, displaying the lowest forward P/E.
2. Energy has moved out of the bottom spot with an Outlook score of 11, as the parade of downward earnings revisions from Wall Street has finally bottomed (and actually turned positive).Still, Energy ranks among the worst with a flat forward long-term growth rate, high forward P/E, and modest return ratios. Telecom is now in the cellar with a score of 10, given its low return ratios and high forward P/E. Notably, Industrial and Technology have been punished the worst with downward earnings revisions.
3. Looking at the Bull scores, Technology and Energy display the top score of 64, followed by Materials and Industrial. Telecom shows the lowest Bull score of 48. The top-bottom spread has expanded somewhat to 16 points, reflecting lower sector correlations. It is generally desirable in a healthy market to see low correlations reflected in a top-bottom spread of at least 20 points, which indicates that investors have clear preferences in the stocks they want to hold.
4. Looking at the Bear scores, Materials and Consumer Goods (Staples/Noncyclical) display the highest (i.e., best) score of 52, followed by Energy, which means that stocks within these sectors have been the preferred safe havens (relatively speaking) on weak market days. Telecom, Healthcare, and Utilities score the lowest at 40, followed by Technology. The top-bottom spread has expanded to 12 points, which still reflects somewhat elevated sector correlations on particularly weak market days (i.e., broad risk-off selling). Ideally, certain sectors will hold up relatively well while others are selling off, so it is generally desirable in a healthy market to see low correlations reflected in a top-bottom spread of at least 20 points.
5. Healthcare displays the best all-around combination of Outlook/Bull/Bear scores, while Telecom is by far the worst. Looking at just the Bull/Bear combination, Energy and Basic Materials are the best, indicating superior relative performance (on average) in extreme market conditions (whether bullish or bearish), while Telecom scores by far the worst.
6. Overall, this week’s fundamentals-based Outlook rankings look even more defensive, with Healthcare, Utilities, and Consumer Goods (Staples/Noncyclical) in the top four and falling scores for Technology, Industrial, and Materials. Keep in mind, the Outlook Rank does not include timing or momentum factors, but rather is a reflection of the fundamental expectations of individual stocks aggregated by sector.
Stock and ETF Ideas:
Our Sector Rotation model, which appropriately weights Outlook, Bull, and Bear scores in accordance with the overall market’s prevailing trend (bullish, neutral, or defensive), retains its bullish bias and suggests holding Healthcare, Technology, and Utilities, in that order. (Note: In this model, we consider the bias to be bullish from a rules-based trend-following standpoint when SPY is above both its 50-day and 200-day simple moving averages.)
Utilities might seem like an unlikely choice for a bullish bias, but the combination of a solid Outlook Rank and a surprisingly high Bull Score make it the top choice from a rules-based perspective – at least for the moment.
Other highly-ranked ETFs in SectorCast from the Healthcare,Technology, and Utilities sectors include Market Vectors Pharmaceutical ETF (PPH), PowerShares Dynamic Networking Portfolio (PXQ), and Guggenheim Invest S&P 500 Equal Weight Utilities ETF (RYU).
For an enhanced sector portfolio that enlists some top-ranked stocks (instead of ETFs) from within the top-ranked sectors, some long ideas from Healthcare, Technology, and Utilities sectors include Mallinckrodt PLC (MNK), McKesson Corp (MCK), Palo Alto Networks (PANW), VASCO Data Security International (VDSI), Pepco Holdings (POM), and Entergy Corp (ETR). All are highly ranked in the Sabrient Ratings Algorithm.
If you prefer to maintain a neutral bias, the Sector Rotation model still suggests holding Healthcare, Technology, and Utilities, in that order. But if you prefer a defensive stance on the market, the model suggests holding Consumer Goods (Staples/Noncyclical), Financial, and Basic Materials, in that order.
IMPORTANT NOTE: I post this information each week as a free look inside some of our institutional research and as a source of some trading ideas for your own further investigation. It is not intended to be traded directly as a rules-based strategy in a real money portfolio. I am simply showing what a sector rotation model might suggest if a given portfolio was due for a rebalance, and I may or may not update the information each week. There are many ways for a client to trade such a strategy, including monthly or quarterly rebalancing, perhaps with interim adjustments to the bullish/neutral/defensive bias when warranted -- but not necessarily on the days that I happen to post this weekly article. The enhanced strategy seeks higher returns by employing individual stocks (or stock options) that are also highly ranked, but this introduces greater risks and volatility. I do not track performance of the ETF and stock ideas mentioned here as a managed portfolio.
Disclosure: Author has no positions in stocks or ETFs mentioned.
Disclaimer: This newsletter is published solely for informational purposes and is not to be construed as advice or a recommendation to specific individuals. Individuals should take into account their personal financial circumstances in acting on any rankings or stock selections provided by Sabrient. Sabrient makes no representations that the techniques used in its rankings or selections will result in or guarantee profits in trading. Trading involves risk, including possible loss of principal and other losses, and past performance is no indication of future results.