Sector Detector: Earnings season launches under cloud of low expectations
 As earnings season gets underway, it has become clear that there is a disconnect between the bull market in stocks and the ability of the companies behind those stocks to generate any revenue growth in a weak global economy. Although U.S. companies have shown eleven consecutive quarters of year-over-year earnings growth, Wall Street analysts have continued to slash forward earnings estimates, and indeed it is reflected in Sabrient’s SectorCast model.
There is no denying that companies have been squeezing every ounce of earnings from stagnant revenues, and now they find themselves just about as lean and mean as they can get. Financials are seeing the most growth, as banks capitalize on yield spreads and cheap trading capital. Consumer Services companies also are projected to show favorable year-over-year growth as consumer confidence has improved and consumer credit grows. On the down side, Basic Materials and Energy sectors are projected to have the most earnings contraction.
On Wednesday, Industrial sector stalwarts Chevron (CVX), Alcoa (AA), and Cummins (CMI) all made disappointing statements about future earnings due to a global slowdown in demand. On the plus side, Consumer Services leaders Yum! Brands (YUM), Walmart (WMT), and Costco (COST) all came through with strong earnings reports.
Exactly five years ago, in October 2007, the S&P 500 hit all-time high of 1576. Of course, that was before the Great Recession and financial collapse of 2008. So far, the most obvious result from all the Federal stimulus over the past few years has been an inflated stock market. But that’s not going to be good enough forever.
The question is how much longer will U.S. and global institutional investors (with little else in the way of attractive investment options) continue to push U.S. stocks higher in anticipation of future growth? This would have to rely on the hope that stimulus will actually start to help businesses grow. To do so, the Fed can’t do it alone through monetary policy. Stimulus will have to come from the fiscal side, as well, with strong leadership from the President, and a Congress that puts jobs and small businesses ahead of political brinksmanship. If they can manage to do it, stocks have a great chance of challenging those previous highs from 2007.
As equity correlations have gone down, we should see the return of the art of stock-picking. Gradient Analytics’ forensic accounting expertise is an example of how one can discern the future winners from the losers. Recent examples include negatively-rated Titan Machinery (TITN), CLARCOR (CLC), and Questcor Pharmaceuticals (QCOR), each of which have fallen hard, and positively-rated Coventry Health Care (CVH), KeyCorp (KEY), and Six Flags Entertainment (SIX). Notably, based on an anonymous survey of CFOs last year, an independent study revealed that 20% of companies are managing earnings and using aggressive accounting methods to legally improve their earnings reports. Gradient specializes in flushing out this sort of thing.
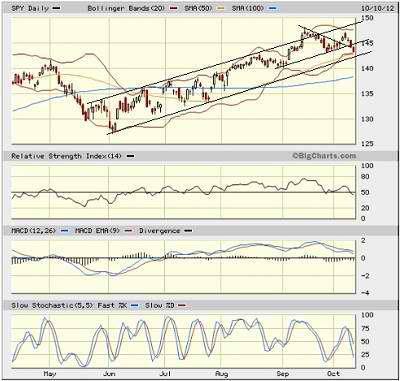
The S&P 500 SPDR Trust (SPY) closed Wednesday at 143.28. It remains within the same bullish rising channel since the rally started at the beginning of June. Price seemed to have been forming a neutral symmetrical triangle while the Bollinger Bands rapidly converge, which was like a coiled spring getting ready to break in one direction or the other. It initially broke to the upside last Thursday, but then reversed this week going into earnings season, and Wednesday it broke down below the lower line of the triangle.

There is a lot of strong support just below current levels, including the previous triple-top resistance-turned-support and the rising 50-day SMA around 142, the bottom line of the rising channel just below, and then prior strong support at 140. Then there is the 100-day SMA near 138 and finally the rising 200-day SMA. Oscillators like RSI, MACD, and Slow Stochastic have all reversed this week and are pointing toward further weakness, which will likely find near-term support and turn into a buying opportunity.
The CBOE Market Volatility Index (VIX), a.k.a. “fear gauge,” closed Wednesday at 16.29. This is still quite low and generally bullish for stocks.
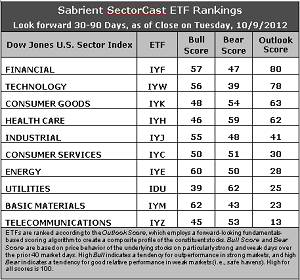
Latest rankings: The table ranks each of the ten U.S. industrial sector iShares (ETFs) by Sabrient’s proprietary Outlook Score, which employs a forward-looking, fundamentals-based, quantitative algorithm to create a bottom-up composite profile of the constituent stocks within the ETF. In addition, the table also shows Sabrient’s proprietary Bull Score and Bear Score for each ETF.
High Bull score indicates that stocks within the ETF have tended recently toward relative outperformance during particularly strong market periods, while a high Bear score indicates that stocks within the ETF have tended to hold up relatively well during particularly weak market periods. Bull and Bear are backward-looking indicators of recent sentiment trend.
As a group, these three scores can be quite helpful for positioning a portfolio for a given set of anticipated market conditions.

Observations:
1. Financial (IYF) has risen to the top spot with an Outlook score of 80, followed closely by Technology (IYW) at 78. Stocks within IYF continue to enjoy renewed support from Wall Street’s analysts this week as earnings estimates for banks were raised again while estimates for Tech stocks were lowered. IYW still displays an impressive combination of low forward P/Es, strong projected long-term growth, and solid return ratios. Consumer Goods (IYK) is now in the third spot with an Outlook score of 63, just edging out Healthcare (IYH).
2. Telecom (IYZ) stays at the bottom of the Outlook rankings with an Outlook score of 13. Stocks within the sector are burdened by the highest forward P/Es and the worst return ratios, plus net downgrades from Wall Street. Basic Materials (IYM) is the second worst with a 23.
3. Overall, I would categorize these quant rankings as neutral.
4. Looking at the Bull scores, Materials (IYM) is the leader on strong market days, scoring 62, followed closely by Energy (IYE). Utilities (IDU) is still by far the weakest on strong days, scoring 39. In other words, Materials stocks have tended to perform the best when the market is rallying, while Utilities stocks have lagged.
5. Looking at the Bear scores, Utilities (IDU) is the investor safe haven on weak market days, scoring 62. Surprisingly, Technology (IYW) has been abandoned the most by investors during recent market weakness, as reflected by its low Bear score of 39, followed closely by Materials (IYM). In other words, Tech stocks have tended to sell off the most when the market is pulling back, while Utilities stocks have held up the best.
6. Overall, Financial (IYF) shows the best all-weather combination of Outlook/Bull/Bear scores. Adding up the three scores gives a total of 184. Telecom (IYZ) is the worst at 111. As for Bull/Bear combination, Energy (IYE) remains the best at 110, while Technology (IYW) is the worst with a dismal 95, likely due to recent extreme weakness in Apple (AAPL).
These scores represent the view that the Financial and Technology sectors may be relatively undervalued overall, while Telecom and Materials sectors may be relatively overvalued based on our 1-3 month forward look.
Top-ranked stocks within IYF and IYW include MasterCard (MA), Alleghany (Y), Rackspace Hosting (RAX), and Google (GOOG).
Disclosure: Author has no positions in stocks or ETFs mentioned.
About SectorCast: Rankings are based on Sabrient’s SectorCast model, which builds a composite profile of each equity ETF based on bottom-up aggregate scoring of the constituent stocks. The Outlook Score employs a fundamentals-based multi-factor approach considering forward valuation, earnings growth prospects, Wall Street analysts’ consensus revisions, accounting practices, and various return ratios. It has tested to be highly predictive for identifying the best (most undervalued) and worst (most overvalued) sectors, with a 1-3 month forward look.
Bull Score and Bear Score are based on the price behavior of the underlying stocks on particularly strong and weak days during the prior 40 market days. They reflect investor sentiment toward the stocks (on a relative basis) as either aggressive plays or safe havens. So, a high Bull score indicates that stocks within the ETF have tended recently toward relative outperformance during particularly strong market periods, while a high Bear score indicates that stocks within the ETF have tended to hold up relatively well during particularly weak market periods.
Thus, ETFs with high Bull scores generally perform better when the market is hot, ETFs with high Bear scores generally perform better when the market is weak, and ETFs with high Outlook scores generally perform well over time in various market conditions.
Of course, each ETF has a unique set of constituent stocks, so the sectors represented will score differently depending upon which set of ETFs is used. For Sector Detector, I use ten iShares ETFs representing the major U.S. business sectors.
About Trading Strategies: There are various ways to trade these rankings. First, you might run a sector rotation strategy in which you buy long the top 2-4 ETFs from SectorCast-ETF, rebalancing either on a fixed schedule (e.g., monthly or quarterly) or when the rankings change significantly. Another alternative is to enhance a position in the SPDR Trust exchange-traded fund (SPY) depending upon your market bias. If you are bullish on the broad market, you can go long the SPY and enhance it with additional long positions in the top-ranked sector ETFs. Conversely, if you are bearish and short (or buy puts on) the SPY, you could also consider shorting the two lowest-ranked sector ETFs to enhance your short bias.
However, if you prefer not to bet on market direction, you could try a market-neutral, long/short trade—that is, go long (or buy call options on) the top-ranked ETFs and short (or buy put options on) the lowest-ranked ETFs. And here’s a more aggressive strategy to consider: You might trade some of the highest and lowest ranked stocks from within those top and bottom-ranked ETFs.
