Sector Detector: Volatility suddenly returns to spook a raging bull
by Scott Martindale
President, Sabrient Systems LLC
Many market commentators have been in a prolonged tizzy, warning of an inevitable selloff to come. And indeed we finally got one, with a huge spike in volatility. A climate of low inflation and structurally low interest rates has meant less discounting of future corporate earnings, which has allowed for higher enterprise values and stock prices. But when inflation fears suddenly popped up, investors feared an imminent repricing of equities at lower multiples. As I wrote at the start of the year, I expected some renewed volatility and compression in valuation multiples to occur during 2018, but I sure didn’t expect it to happen quite so soon. However, I also said that a correction would be healthy, and that it won’t necessarily be as deep of a selloff as so many investors have feared – and I stand by that prediction.
So, what is going on here? I think there were a few catalysts. First, the dollar has been plummeting on inflation worries, chasing away global fixed income investors and spiking yields, which put elevated equity valuations into question. Second, a healthy technical correction from January’s parabolic uptrend in stock prices spiked volatility to such a degree that the inverse VIX ETF/ETNs imploded, revealing structural problems with some of these products that not only spooked institutional investors but also triggered some abrupt changes to tactical equity exposures in their algorithmic trading models. And then we heard some FOMC members making statements implying that perhaps there is no longer a “Fed Put” supporting the market. It’s no wonder the long-expected correction finally (and quite suddenly) came about.
Given that the price chart had gone parabolic, it shouldn’t be too much of a surprise that volatility raised its ugly head, with the CBOE Market Volatility Index (VIX) briefly spiking above 50, much like an overstretched rubber band snaps back, and with sector correlations rising sharply. Nevertheless, I still expect solidly positive performance in the broad market indices by year end, although significantly lower than last year’s +22% performance on the S&P 500, and perhaps only in the high single digits. I also believe that heightened volatility and some compression in the broad market valuation multiples will lead to greater market breadth and lower sector correlations as investors pick their spots outside of the mega-caps (or passive index investing) and seek out higher returns in stocks that display strong growth prospects at a reasonable price (i.e., GARP) – with realistic potential for gains in the 15-25% range (or even higher).
In this periodic update, I provide a market commentary, offer my technical analysis of the S&P 500, review Sabrient’s latest fundamentals-based SectorCast rankings of the ten US business sectors, and serve up some actionable ETF trading ideas. In summary, our sector rankings still look bullish, while the sector rotation model moved to a neutral bias in response to the market turbulence. Read on....
Market Commentary:
I anticipated elevated volatility this year, with stocks finally enduring the significant correction that was so elusive last year – but it came faster and fiercer than I expected. However, episodes like this should be seen as a healthy cleansing. Ultimately, I still expect to see higher stock prices for the next few years, as a true “boom cycle” kicks in – rather than the slow, plodding economic uptrend (supported only by monetary policy-induced asset inflation), punctuated by “stealth busts” (like the profit recession from 1Q2014 through 2Q2016 and the Capex recession that is only now showing signs of ending (thanks to the tax bill).
Going into the New Year, stock prices already had been bid up in anticipation of an economic boom ignited by fiscal stimulus – i.e., the biggest tax overhaul in over 30 years in concert with infrastructure spending and ongoing deregulation. So, I expected that investors may do some waiting-and-watching regarding business behavior under the new rules and the impact on earnings, and I expected some normalization in valuation multiples this year (i.e., lower forward P/Es). In other words, earnings ultimately drive stock prices, so given that stocks were bid up in anticipation of fiscal stimulus, price appreciation should be no greater than earnings growth – and likely slower to allow P/E multiples to recede somewhat. But instead, share prices continued to rise rapidly throughout January. Then February came along and brought the momentum bulls back to reality.
The CBOE Market Volatility Index (VIX), aka “fear gauge,” hit an intraday high of 50.30 (!) on February 6, after hitting a new closing high the day before at 37.32. When you consider that it closed 2017 at a modest 11.04, which was about average daily closing value for the entire year, that’s a 450% rise. Also, there hadn’t been a significant market correction since February 2016, and VIX had not approached the 20 “panic threshold” since right before the November 2016 election. So, this sudden surge in volatility was an unfamiliar intruder to many partygoers who had been taking extra servings from the punchbowl. And not surprisingly, it came along with an undesirable spike in sector correlations and risk-on/risk-off behavior.
For the past year, the dollar had been in a steady decline. Looking at the PowerShares DB US Dollar Bull ETF (UUP), which measures the dollar against a basket of foreign currencies (euro, yen, pound, Canadian dollar, Swedish krona, Swiss franc), 12-month performance ultimately fell -11% by the end of January. Throughout that time, stocks were strong, as the weaker dollar seemed to favor US multinational sales and exports in general. But after the US tax bill passed in December, the rate of the dollar’s descent accelerated, and the dollar fell -3.75% in January alone, bringing down longer-term bonds (and pushing up yields), as global investors who had been using overseas QE to eagerly buy up higher-yield US Treasuries could no longer watch their gains from the interest rate spread in the “carry trade” wiped away by their losses in the currency conversion. This was exacerbated by fears that the tax bill would: 1) create robust but inflationary growth, and 2) lead to a flood of new Treasury bond issuance to finance a ballooning budget deficit, even while the Fed was unwinding its holdings of Treasuries (a double whammy) – i.e., too much anticipated supply for falling demand.
But investors were officially spooked when the January hourly earnings report showed wages were up +2.9% in January. Then there was news of what the federal budget deal might actually comprise, with a big-spending agenda that portends huge deficits, lots of new government debt issuance, and inflationary pressures. Along with low unemployment (which is near the lows of 1960), all of this created a fear that inflation may end up closer to 3% (or even higher) this year instead of the Fed’s 2% target, which suggests the Fed may feel the need to raise rates more quickly than the three 25 bps hikes currently baked in. This ultimately caught up with the stock market, as well, particularly given that the assumption of persistently low risk-free yields is an underpinning of the elevated stock valuations. US CPI inflation for January just came in at 2.1% (versus 1.9% expectation), with core inflation at 1.8% (versus the 1.7% expectation). So, some observers are saying that inflation is indeed accelerating such that the Fed will need to act more aggressively. As for oil price, after reaching above $66 at the end of January as the dollar fell, crude oil has since pulled back (briefly below $60) as the dollar has showed signs of firming up and production has increased. Also, Monday’s survey of consumer expectations of inflation, as compiled by the Federal Reserve Bank of New York, suggests that inflation expectations have actually fallen slightly.
The latest Fed "dot plot" still projects three rate hikes this year, which would bring the target rate to a 2.00-2.25% range by year end. CME fed funds futures currently place the odds of a rate hike at the March meeting at 83%, and by the June meeting the odds of a second rate hike are 61%. Notably, by December, there is actually a surprising 25% probability of a fourth quarter-point rate hike (which would bring the target rate to 2.25-2.50% range). Meanwhile, the 10-year Treasury jumped to 2.91% (up 50 bps this year alone), with the 2-year hitting 2.17%. Rates are definitely spiking on inflation fears, but it seems premature to price in rampant inflation so early. The closely-watched 2-10 spread, which had been gradually flattening all last year, has expanded to 74 bps, but still remains well under the 100 bps “normalcy threshold,” as well as the 101 bps on Election Day, and 136 bps immediately following the November 2016 election. Although the Fed has reiterated its intention to continue raising short-term rates and unwinding its balance sheet of longer-dated bonds, it also understands that our highly-leveraged economy can be harmed if rates rise too quickly, so it is unlikely the Fed governors will want to upset the applecart.
I think that once the dollar finds support (as it seems to be trying to do now), it should entice capital back into both US Treasuries (flattening the yield curve) and US equities. Although I’m no economist, I have been saying for quite some time that global dynamics should keep Treasury yields low, as long as the Fed remains slow and cautious in their path toward normalization. But that was before the big-spending budget deal was passed. Still, ultra-low rates like Germany’s 10-year at 0.76% and Japan’s below 0.07% have global investors hungry for higher risk-free yields, so long as they don’t give it back on currency exchange. Moreover, aging demographics in other developed countries and passive capital inflows to fixed income funds (such as from strategic asset allocations) should all perpetuate a demand for fixed income.
For the past couple of years, 2.6% is a yield that has attracted a strong bid, but that didn’t happen this time as global fixed income investors sat on their hands – presumably until the dollar firms up. Adding fuel to the fire, Goldman Sachs’ fixed income division came out this week with a prediction that 10-year Treasuries will hit 3.5% within the next two quarters as the Fed continues to hike rates and the bond market sells off (along with equities, most likely). Nevertheless, given the high global debt levels and a rate-sensitive mortgage market (that is so important to our economy), a spike in developed-market interest rates would be detrimental, so the Fed and other central banks surely will take great pains not to let rates rise so quickly. Even with recent signs of inflationary pressures and rising supply of Treasury bonds and the 10-year yield rapidly approaching 3.0%, I still am personally doubtful of a continued selloff in the dollar and Treasuries such that the 10-year yield sustains a breakout above 3.0% in 2018.
As for the technical picture and inverse-volatility products, share prices went parabolic in January such that some chartists were saying it had to come back down in a big way, which it ultimately did – so not a big surprise, right? At the same time, rather than falling (as is typical when stocks are rising), VIX was creeping up – so even more of an indication that all was not well, right? Then the calendar turned to February, and the bottom fell out quickly, so of course volatility spiked big-league, and all of those traders who had been getting steady profits by shorting volatility during all of 2017 (in the so-called “new normal” of low-vol) got hurt big-league, particularly as program selling from trend-following strategies kicked in, bailing out of risk. The VelocityShares Daily Inverse VIX Short-Term ETN (XIV, i.e., VIX backwards) imploded in a few days from $130 to under $6 – and on a single day, it fell from $99 to nearly $7, which is -93%! – most of which happened in a span of 15 minutes!). As a result, Credit Suisse (which owns VelocityShares) announced that it would close the XIV on February 21. Structural issues like this kept pressure on the equity markets, as investors lost a little faith. Some have suggested that the VIX is no longer the market metric it was intended to be, since so many participants watch, trade, and manipulate it, i.e., the proverbial “tail wagging the dog,” leading to self-fulfilling prophesies on high or low volatility (note that FINRA is looking into allegations of criminal manipulation for profit).
The other thing that exacerbated events was the apparent removal of the proverbial “Fed Put” on the equity market, in which the Federal Reserve considers stock market behavior when adjusting monetary policy. Outgoing Chair Janet Yellen said, “The financial system is much better capitalized…I think our overall judgment is that, if there were to be a decline in asset valuations, it would not damage unduly the core of our financial system.” Institutional investors took this statement to mean that the Fed no longer felt a need to prop up the stock market. Instead, most Fed leaders consider the selloff to be healthy and overdue. NY Fed president William Dudley doubled down by saying, “An equity rout like the one that occurred in recent days has virtually no consequence for the economic outlook.” Some observers have even opined that the Fed would prefer to see the new fiscal stimulus (tax cut, deficit spending, infrastructure) hit the economy at a later time, when the market is flagging rather than raging, so it will be more hawkish as a result. But then during his swearing-in ceremony on Tuesday, new Fed Chair Jerome Powell said that he “will remain alert” to any risks to financial stability, which may have indicated that the “Fed Put” is still in the playbook.
During this correction, sector correlations spiked higher to undesirable levels in a risk-on/risk-off fashion. DataTrek noted that the average price correlation for the 11 sectors of the S&P 500 over the past month rose to nearly 84%, which is sharply higher than the low readings of the prior 3 months of around 40%. Of course, low sector correlations characterize healthy market conditions in which investors are picking their spots for investment. As the fear subsides and a bottom is found in this selloff (perhaps we have already seen it), I expect the table to be set for a return to fundamentals-based strategies in which sound research and skilled security selection pays off, as opposed to the exuberant optimism that drove the parabolic momentum run and P/E expansion of January. But we likely will not see the ultra-low correlations of 2017, which were enabled by the climate of ultra-low volatility. And this new volatility would be expected to cause many algorithmic trading models to reduce equity exposure. In addition, as DataTrek reminds us, higher correlations and volatility may lead risk parity portfolios for the heavyweight investors to employ less leverage (and thus lower equity exposure).
Nonetheless, the economic outlook is still quite rosy. Investors can still be encouraged by synchronized global economic expansion, impressive US economic reports, strong (and improving) corporate cash flow and earnings, high corporate cash balances, unemployment near 1960 lows, low inflation, a still-accommodative Fed, over $2 trillion in excess bank reserves, low interest rates, an upsloping yield curve, persistent investor caution, no threat of recession anytime soon, continual progress in loosening the regulatory noose, and the biggest tax overhaul in a generation – incentivizing business expansion; domestic relocation and reversed tax inversions; new capex, hiring, and production; higher dividends, more share buybacks, and M&A (targeting small and micro caps). Of note, the NFIB Small Business Optimism Index just came in quite strong at 106.9, with the component of small business owners’ outlook for expansion hitting the highest level in the survey’s history.
The BEA’s advance estimate of real GDP in 4Q17 currently sits at 2.6%, and for 1Q18, the Atlanta Fed’s GDPNow model just came in with an updated forecast of 3.2% (still good, although down from forecasts of 5.4% on Feb 1 and 4.0% last week), while the New York Fed’s Nowcast model projects 3.3%. Furthermore, corporate earnings are growing double digits and the fastest since 2011, while profit margins are historical high. Q4 earnings season so far (with about 70% of S&P 500 companies having reported) shows that sales are up about 8% and EPS is up nearly 15% (the best in 5 years), with about 70% of firms beating on EPS and 80% beating on sales, and almost 60% beating on both, which could ultimately result in the most beats since 2000. And even more importantly, forward estimates are actually improving going forward (as opposed to the usual deal in which overly-optimistic analyst estimates are cut back as the quarter progresses). In addition, when you consider the supply/demand dynamics of US equities, share buyback programs and M&A have led to lower outstanding float and reduced supply, while cheap and abundant global capital (through economic growth and continued QE) sustains strong demand for US equities.
As I have said before, I don’t see the economic cycle or the bull market in stocks as being “long in the tooth,” as many commentators keep saying. Bull markets historically tend to end with economic recessions and inverted yield curves, neither of which are imminent. It seems to me that the long period of sluggish economic growth has allowed us to avoid the usual “boom” part of the boom & bust cycle, thus deferring the “bust” stage. In fact, I think it is possible that the corporate profit recession from 1Q2014 through 2Q2016 and the extended Capex recession that only now may be ending (given the new tax incentives), along with the long period of stagnant wages and falling labor participation, may have represented “stealth recessions” for an economy that was simply propped up by asset inflation created by the Fed’s monetary stimulus – thus putting us today in the recovery stage of a new business cycle. If so, then the US economy and stocks may have some years left in this uptrend – subject to the unpredictable risks presented by a highly-leveraged global economy, of course.
Given the recent pullback, the Next Twelve Months (NTM) forward P/E has fallen from 18.5x at the beginning of the year to about 17x today. Flip that upside down and you get an earnings yield of 5.9%, which is quite a risk premium (3.1%) versus the “risk-free” 10-year Treasury yield of about 2.8%. Note that throughout most of the ‘80s and ‘90s (until the late-90s internet bubble run-up), the S&P 500 forward earnings yield was about equal to the nominal 10-year Treasury yield – which at today’s rates suggests that the S&P 500 could command a forward P/E of 35x. However, ever since the Internet bubble burst, investors have demanded a significant risk premium for equities. So, even if the 10-year yield rises to 3.5% by year end, adding in a 2% risk premium still suggests that an earnings yield of 5.5% and a forward P/E valuation of 18.2x is reasonable. But let’s assume that the forward P/E ends up at 17.5x by year end, then the current prediction of aggregate earnings of $157 per share this year, combined with the consensus forward year-over-year increase in EPS for 2019 of 10%, would imply a 2018 year-end value for the S&P 500 of 3022 – which would be a +13% gain for the year. That’s not necessarily my prediction; it’s just an example of where we might reasonably end up the year. But again, that’s for the broad, cap-weighted S&P 500, and I expect that sound fundamentals-based stock selection could perform a good bit better than that.
In addition, we might see some welcome increases in dividends. The current payout ratio of 38.2% (Q4 2017) for the S&P 500 is relatively low compared to its recent history. So, as interest rates creep up, dividend yield will likely rise, as well, particularly given the lower corporate tax rates.
By the way, you can still get ahold of my detailed market outlook, including discussion of market valuations, interest rates, and risks to our bullish thesis, in the Baker’s Dozen report that we published on January 19. Visit http://bakersdozen.sabrient.com or send an email to support@sabrient.com (be sure to tell us whether you are an individual investor or a financial advisor) to find out how to access it.
Next week, our February Baker’s Dozen portfolio launches, and David Brown and his analyst team have produced another interesting list that you will want to see. For now, I just want to reiterate that the global economy and overall market conditions remain quite favorable for equities, and we consider this volatility-driven selloff to be a healthy cleansing of the excesses that were developing. In particular, a fundamentals-based GARP approach would seem to be the a good bet for this year, as opposed to strategies like momentum, or deep-value turnaround investing, or high-P/E speculative growth. Sabrient’s fundamentals-based models are designed to outperform in a healthy “rational” market.
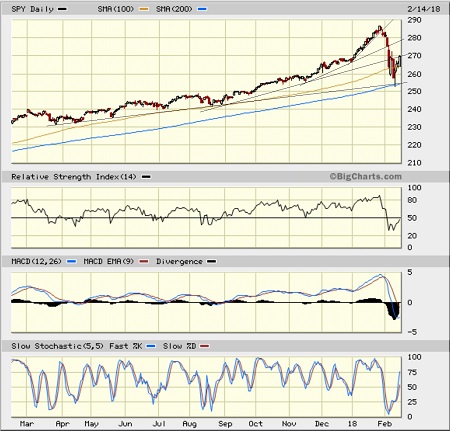
SPY Chart Review:
The SPDR S&P 500 ETF (SPY) closed Wednesday at 269.59, which was its fourth straight day of a positive close after the extreme market turmoil. It found support at the critical 200-day simple moving average (SMA) last Friday before finishing higher on the day with an impressive intraday recovery, leading into the 3 more days of positive performance. That was the first test of the 200-day SMA for SPY since the November 2016 election. I have drawn some “fan lines” on the chart, given how far the selloff went. You can see that the parabolic rise in January had the first (latest) fan line going vertical in an unsustainable way. The second fan line provided only momentary support before giving way the next day. The third fan line didn’t do much at all, but then the fourth fan line converged with the 200-day SMA, where the reversal occurred. However, a lot of technical damage was done, so once the deeply oversold conditions are worked off, we shall see where the market wants to go next. Oscillators RSI, MACD, and Slow Stochastic all have recovered quite a bit and seem to have further to go as they cycle back up toward neutral. After breaking through resistance from the 100-day SMA on Monday, and then retesting it each day this week, the third fan line seems to be creating a measure of overhead resistance at 270. Next resistance above that resides at the 50-day SMA near 272. Support levels come in at the 100-day SMA just below 265, and the 200-day SMA approaching 255. Looking at this technical picture, I am optimistic that the market won’t sell off below the 200-day SMA – although it may retest it.
Latest Sector Rankings:
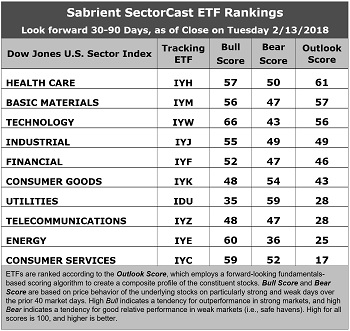
Relative sector rankings are based on our proprietary SectorCast model, which builds a composite profile of each of over 600 equity ETFs based on bottom-up aggregate scoring of the constituent stocks. The Outlook Score employs a forward-looking, fundamentals-based multifactor algorithm considering forward valuation, historical and projected earnings growth, the dynamics of Wall Street analysts’ consensus earnings estimates and recent revisions (up or down), quality and sustainability of reported earnings, and various return ratios. It helps us predict relative performance over the next 1-3 months.
In addition, SectorCast computes a Bull Score and Bear Score for each ETF based on recent price behavior of the constituent stocks on particularly strong and weak market days. A high Bull score indicates that stocks within the ETF recently have tended toward relative outperformance when the market is strong, while a high Bear score indicates that stocks within the ETF have tended to hold up relatively well (i.e., safe havens) when the market is weak.
Outlook score is forward-looking while Bull and Bear are backward-looking. As a group, these three scores can be helpful for positioning a portfolio for a given set of anticipated market conditions. Of course, each ETF holds a unique portfolio of stocks and position weights, so the sectors represented will score differently depending upon which set of ETFs is used. We use the iShares that represent the ten major U.S. business sectors: Financial (IYF), Technology (IYW), Industrial (IYJ), Healthcare (IYH), Consumer Goods (IYK), Consumer Services (IYC), Energy (IYE), Basic Materials (IYM), Telecommunications (IYZ), and Utilities (IDU). Whereas the Select Sector SPDRs only contain stocks from the S&P 500 large cap index, I prefer the iShares for their larger universe and broader diversity.
Here are some of my observations on this week’s scores:
1. Healthcare has taken over the top of the rankings with a modest Outlook score of 61, which is quite low for the top ranking. The reason for the low score seems to be that sell-side analysts have broadly revised EPS estimates upward for stocks across the board (except for Utilities) such that individual sectors simply don’t stand out on this important metric. Healthcare displays one of the lower forward P/Es (16.0x) and solid return ratios. Basic Materials takes the second spot with an Outlook score of 57, as it also relatively low forward P/E (16.4x), a forward PEG of 1.34 (ratio of forward P/E to forward EPS growth rate), and strong return ratios. The lowest (best) forward PEG goes to Energy (0.39), while the highest (worst) goes to Utilities (3.12). Rounding out the top five are Technology, Industrial, and Financial.
2. Consumer Services (Discretionary/Cyclical) falls to the bottom spot, with Energy also in the bottom two (despite its huge year-over-year projected EPS growth rate of 49%).
3. Looking at the Bull scores, Energy enjoys the top score of 60, as stocks within this sector have displayed relative strength on strong market days, while Utilities scores the lowest at 35. The top-bottom spread is 25 points, which appears to reflect low sector correlations on strong market days. It is desirable in a healthy market to see low correlations reflected in a top-bottom spread of at least 20 points, which indicates that investors have clear preferences in the market segments and stocks they want to hold (rather than broad risk-on behavior). However, it is notable that only Utilities scores so low, largely due to the fear of rising interest rates making dividend payers like Utilities less attractive. After Utilities, the two other defensive sectors of Consumer Goods (Staples/Noncyclical) and Telecom score 48, which doesn’t quite offer the same top-bottom spread indicative of healthy market behavior – as one would expect from the recent market turbulence and generally high sector correlations.
4. Looking at the Bear scores, we find Utilities at the top with a score of 59, which means that stocks within this sector have been the preferred safe havens lately on weak market days. Energy has the lowest score of 36, as investors have fled during market weakness. The top-bottom spread is 23 points, which reflects low sector correlations on weak market days. Ideally, certain sectors will hold up relatively well while others are selling off (rather than broad risk-off behavior), so it is desirable in a healthy market to see low correlations reflected in a top-bottom spread of at least 20 points.
5. Healthcare displays the best all-around combination of Outlook/Bull/Bear scores, while Energy is the worst (by a thin margin below Utilities and Telecom). Looking at just the Bull/Bear combination, Consumer Services (Discretionary/Cyclical) is the best, indicating superior relative performance (on average) in extreme market conditions (whether bullish or bearish), while Utilities scores the worst, as investors have generally avoided the sector.
6. This week’s fundamentals-based Outlook rankings still reflect a bullish bias, given that the top five sectors are economically-sensitive or all-weather. However, I remained concerned about a lack of conviction in that only the top three are scoring above 50 and none are scoring above 70. Keep in mind, the Outlook Rank does not include timing, momentum, or relative strength factors, but rather reflects the consensus fundamental expectations at a given point in time for individual stocks, aggregated by sector.
ETF Trading Ideas:
Our Sector Rotation model, which appropriately weights Outlook, Bull, and Bear scores in accordance with the overall market’s prevailing trend (bullish, neutral, or defensive), displays a neutral bias and suggests holding Healthcare (IYH), Basic Materials (IYM), and Technology (IYW), in that order. (Note: In this model, we consider the bias to be neutral from a rules-based trend-following standpoint when SPY is below its 50-day but above its 200-day simple moving averages.)
Besides iShares’ IYH, IYM, and IYW, other highly-ranked ETFs in our SectorCast model (which scores nearly 700 US-listed equity ETFs) from the Healthcare, Materials, and Technology sectors include VanEck Vectors Pharmaceutical (PPH), First Trust Materials AlphaDEX Fund (FXZ), and PowerShares Dynamic Semiconductors (PSI).
If you prefer a bullish bias, the Sector Rotation model suggests holding Technology, Healthcare, and Basic Materials, in that order. On the other hand, if you are more comfortable with a defensive stance on the market, the model suggests holding Utilities, Consumer Goods (Staples/Noncyclical), and Healthcare, in that order.
An assortment of other interesting ETFs that are scoring well in our latest rankings include iShares US Home Construction (ITB), Arrow QVM Equity Factor (QVM), First Trust NASDAQ ABA Community Bank Index Fund (QABA), US Market Rotation Strategy (HUSE), iShares Edge MSCI Multifactor Technology (TCHF), Cambria Value and Momentum (VAMO), PowerShares S&P 500 High Beta Portfolio (SPHB), VictoryShares US SmallCap High Dividend Vol-Wtd Index Fund (CSB), US Global Jets (JETS), WisdomTree Dynamic LongShort US Equity Fund (DYLS), PowerShares Dynamic Building & Construction Portfolio (PKB), and WisdomTree US SmallCap Quality Dividend Growth (DGRS).
IMPORTANT NOTE: I post this information periodically as a free look inside some of our institutional research and as a source of some trading ideas for your own further investigation. It is not intended to be traded directly as a rules-based strategy in a real money portfolio. I am simply showing what a sector rotation model might suggest if a given portfolio was due for a rebalance, and I do not update the information on a regular schedule or on technical triggers. There are many ways for a client to trade such a strategy, including monthly or quarterly rebalancing, perhaps with interim adjustments to the bullish/neutral/defensive bias when warranted, but not necessarily on the days that I happen to post this article. The enhanced strategy seeks higher returns by employing individual stocks (or stock options) that are also highly ranked, but this introduces greater risks and volatility. I do not track performance of the ideas mentioned here as a managed portfolio.
Disclosure: The author has no positions in stocks or ETFs mentioned.
Disclaimer: This newsletter is published solely for informational purposes and is not to be construed as advice or a recommendation to specific individuals. Individuals should take into account their personal financial circumstances in acting on any opinions, commentary, rankings, or stock selections provided by Sabrient Systems or its wholly-owned subsidiary Gradient Analytics. Sabrient makes no representations that the techniques used in its rankings or analysis will result in or guarantee profits in trading. Trading involves risk, including possible loss of principal and other losses, and past performance is no indication of future results.