Sector Detector: Investors seek catalyst for bullish breakout amongst earnings reports
 Stocks continue to trade in a sideways technical consolidation just below their highs. With the start of earnings season underway, investors appear to be looking for a catalyst for some renewed buying that can launch a bullish breakout. The big banks reported some pretty good numbers last week, and now all eyes are watching Technology, Industrial, and Consumer companies, not just for Q4 results but primarily for forward guidance. For 2014, the name of the game will be top-line growth, not just cost-cutting and productivity gains.
So far, corporate earnings reports have been nothing spectacular, but there have been no notable disasters, either. Among the ten U.S. business sectors, the performance leader so far in the New Year has been Healthcare, followed by Technology and Financial. I view this sector leadership as bullish. Also, given the record call option open interest on CBOE Market Volatility Index (VIX) futures, traders appear to be positioning for an overdue market correction. So, the contrarian view is that another test of support around 12 for the VIX could finally produce a breakdown, launching a round of short-covering that could add fuel to the bulls’ fire.
Most of the macro risks that paralyzed corporate investments in 2013 have greatly diminished. Congressional gridlock has eased, and we now have a markedly lower deficit and a strong likelihood of elevated tax revenues. The U.S. budget surplus hit $53 billion last month, and for the first three months of the current fiscal year, the deficit is only $174 billion, which is $120 billion less than last fiscal year’s first three months. Among other positive signs for improvements in the economy and corporate earnings, capital spending and job growth are both rising, and lending volumes are now well above the 2007 peak, before the financial meltdown. General Motors (GM) announced a resumption of its dividend payments, after a 5-year hiatus for its government bailout and restructuring, reflecting a 3.1% yield.
So long as the rates stay range bound, e.g., a 10-year Treasury bond yield between 2.5-3.5%, the experts seem to agree that equities will remain the primary beneficiary of capital flows. P/E multiples and earnings yield in U.S. stocks are not out of line in comparison. So far in 2014, the 10-year has fallen back down to 2.82%. So, although the future direction of longer-term yields is up, evidently it won’t be coming fast and furious, perhaps due to investor caution about equity valuations (however misplaced). To me, it all points to additional upside in equities in the coming months, with just enough of a “wall of worry” to prevent another episode of “irrational exuberance.” Instead, it should help the best growth companies with the most favorable valuations and solid earnings quality to attract capital (“flight to quality”) and serve as the market leaders.
On that note, our new Baker’s Dozen portfolio for 2014 launched on January 13 to much fanfare among investment advisors, given the annual portfolio’s strong performance the past five years, and particularly the past two years since Sabrient subsidiary Gradient Analytics (forensic accounting research) has contributed to the final review process, which has helped us to reduce risk of “meltdowns” due to earnings misses or restatements). In fact, the 2013 portfolio’s worst position was up +14.6%.
Baker’s Dozen is essentially a portfolio of 13 high-potential GARP stocks (growth at reasonable price), bolstered by a forensic accounting review to ensure that each company has displayed high quality and sustainability of earnings. In other words, the companies have not resorted to accounting tricks to make their numbers. The 2014 portfolio of 13 stocks has four holdovers from 2013, including Irish biopharma firm Jazz Pharmaceuticals (JAZZ), which was last year’s top performer but still shows an attractive valuation given the huge increase in sell-side consensus earnings estimates, partly due to its all-cash acquisition of Gentium (GENT), its largest competitor in Europe. (http://bakersdozen.sabrient.com)
SPY chart review:
The SPDR S&P 500 Trust (SPY) closed Friday at 183.63 after setting yet another all-time high on Wednesday at 184.94. It still has not given back much during this technical consolidation period, which has been in place since the start of the New Year. The market has not seen a 10% correction in 408 trading days, and oscillators like RSI, MACD and Slow Stochastic have been loath to spend much if any time below the neutral line. In fact, if you look at a multi-year chart of the SPY, RSI historically cycles down below the neutral line on a regular basis, but for the past several months it has been bouncing reliably from it. SPY remains inside its long-term bullish rising channel, and now also appears to be consolidating below resistance at 185 while, gathering strength for another breakout attempt. The rising 20-day and 50-day simple moving averages continue to offer strong support to every pullback. I still think SPY will achieve a bullish breakout during the month before undergoing any significant correction or test of support at the bottom of the rising channel.
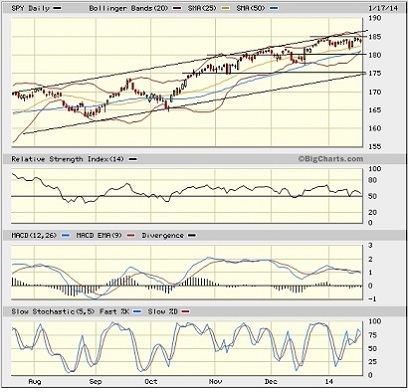
On Friday, the CBOE Market Volatility Index (VIX), a.k.a. “fear gauge,” closed at 12.44. Investors still are showing no fear, although there are a number of market commentators warning that we should expect higher volatility in 2014. Nick Colas of ConvergEx is predicting higher bond volatility as the Fed tapers its quant easing, which he expects will lead to higher equity volatility, as well.
Latest rankings:
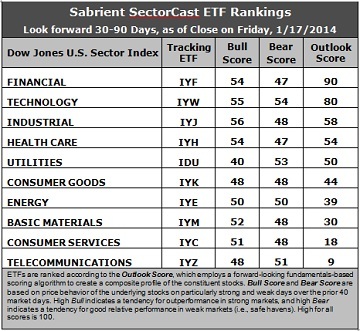
Relative rankings are based on Sabrient’s proprietary SectorCast model, which builds a composite profile of each equity ETF based on bottom-up aggregate scoring of the constituent stocks. The “Outlook Score” employs a forward-looking, fundamentals-based multifactor algorithm considering forward valuation, historical and projected earnings growth, the dynamics of Wall Street analysts’ consensus earnings estimates and recent revisions (up or down), quality and sustainability of reported earnings (forensic accounting score), and various return ratios. It helps us predict relative performance over the next 1-3 months.
In addition, SectorCast computes Sabrient's Bull Score and Bear Score for each ETF based on recent price behavior of the constituent stocks on particularly strong and weak market days. High Bull score indicates that stocks within the ETF have tended recently toward relative outperformance when the market is strong, while a high Bear score indicates that stocks within the ETF have tended to hold up relatively well (“safe havens”) when the market is weak.
Outlook Score is forward-looking while Bull and Bear are backward-looking. As a group, these three scores can be helpful for positioning a portfolio for a given set of anticipated market conditions. Of course, each ETF holds a unique portfolio of stocks and position weights, so the sectors represented will score differently depending upon which set of ETFs is used. For Sector Detector, I use the ten iShares that represent the ten major U.S. business sectors: Financial, Technology, Industrial, Healthcare, Consumer Goods, Consumer Services, Energy, Basic Materials, Telecom, and Utilities. Whereas the Select Sector SPDRs only contain stocks from the S&P 500, I prefer the iShares for their larger universe and broader diversity.
Observations:
1. Financial (IYF) retains the top spot with an Outlook score of 90, while Technology (IYW) scores 80 to stay in second place. The Financial sector displays one of the lowest forward P/Es and the strongest (and strengthening) sentiment among both Wall Street analysts (upgrades to earnings estimates) and company insiders (buying activity). Technology still displays a relatively low forward P/E, a solid forward long-term growth rate, the best return ratios, and strong sentiment among both sell-side analysts and company insiders. These two sectors have occupied the top two spots for quite a while, and they sit well above the rest of the field with a 22-point gap above third place Industrial (IYJ). These top three are still the only ones displaying positive net changes to consensus earnings estimates among the sell-side analysts. Healthcare (IYH) now sits in the fourth spot after Consumer Goods (IYK) absorbed some reductions to earnings estimates.
2. Telecom (IYZ) is in the cellar yet again with an Outlook score of 9. It scores among the lowest on almost every factor in the model, including the highest forward P/E, lowest return ratios, and a low projected long-term growth rate. Only the sentiment among Wall Street analysts has shown some improvement. Consumer Services (IYC) is in the bottom two again with an Outlook score of 18, as forward valuation is high while sell-side analysts have been reducing earnings estimates.
3. This week’s fundamentals-based rankings still reflect a mostly bullish bias, with economically-sensitive sectors Financial, Tech, and Industrial making up the top three and with Healthcare (and its cadre of high-potential drug makers and biotechs) in fourth.
4. Looking at the Bull scores, Industrial has been the leader on strong market days, scoring 56, followed by Technology at 55. Utilities (IDU) is the clear laggard with a score of 40. The top-bottom spread has widened considerably to 16 points, reflecting lower sector correlations on particularly strong market days, which is healthy for the market and for stock pickers.
5. Looking at the Bear scores, there really haven’t been any big down days, so the scores are less reliable. Technology has been holding up the best (“safe haven”) on recent weak market days, scoring 54, while Financial and Healthcare score the lowest at 47. The top-bottom spread is only 7 points, which reflects high sector correlations on weak market days, but as I said, there haven’t been many such days lately.
6. Overall, Financial shows the best all-weather combination of Outlook/Bull/Bear scores. Telecom is the by far the worst. Looking at just the Bull/Bear combination, Technology displays the highest score indicating excellent relative performance in extreme market conditions (whether bullish or bearish), while defensive sector Utilities scores the lowest, followed closely by Consumer Goods, indicating investor avoidance (relatively speaking) during extreme conditions.
These Outlook scores represent the view once again that Financial and Technology sectors are still relatively undervalued, while Telecom and Consumer Services may be relatively overvalued based on our 1-3 month forward look.
Stock and ETF Ideas:
Our Sector Rotation Model, which appropriately weights Outlook, Bull, and Bear scores in accordance with the overall market’s prevailing trend (bullish, neutral, or bearish), suggests holding Technology, Financial, and Industrial ETFs in the current bullish climate.
Some intriguing stocks from Financial and Technology sectors include BlackRock (BLK), First Citizens Bancshares (FCNCA), Syntel (SYNT), and Alliance Data Systems (ADS), all of which are ranked highly in the Sabrient Ratings Algorithm.
Other ETFs highly-ranked by Sabrient from the Financial and Technology sectors include the First Trust Financial AlphaDEX Fund (FXO) and the First Trust NASDAQ Technology Dividend Index Fund (TDIV).
Disclosure: Author has no positions in stocks or ETFs mentioned.
Disclaimer: This newsletter is published solely for informational purposes and is not to be construed as advice or a recommendation to specific individuals. Individuals should take into account their personal financial circumstances in acting on any rankings or stock selections provided by Sabrient. Sabrient makes no representations that the techniques used in its rankings or selections will result in or guarantee profits in trading. Trading involves risk, including possible loss of principal and other losses, and past performance is no indication of future results.