Sector Detector: Stocks remain inside their long-standing trading range, but an upside breakout grows more likely
The market has provided a nerve-wracking amusement park ride for those with the stomach to hang in there. Of course, the Brexit vote caused a nasty selloff due to the uncertainty of what comes next and the long-term ramifications, but the ensuing recovery was just as swift. At the end of it all, stocks are right back where they have been, mired in the same long-standing trading range but apparently (in my opinion) more inclined to find some sort of upside catalyst. And given elevated multiples, it seems that the only thing that will allow such a breakout will be improving forward revenue and earnings guidance during the imminent Q2 earnings season. The added benefit of this would be improving market breadth, lower sector correlations, and a continued flight to quality (i.e., fundamental strength and solid earnings quality), which we would expect to benefit fundamentals-based portfolio strategies (like Sabrient’s), as opposed to strategies based purely on safety, momentum, speculation, or risk-on/risk-off (i.e., cap-weighted beta exposure).
In this periodic update, I give my view of the current market environment, offer a technical analysis of the S&P 500 chart, review our weekly fundamentals-based SectorCast rankings of the ten U.S. business sectors, and then offer up some actionable ETF trading ideas.
Market overview:
After the scary post-Brexit yo-yo, as of July 6 the broad market indexes like S&P 500, NASDAQ, and Russell 2000 are back above their 50-day and 200-day simple moving averages (although the transportation index has not), and in fact the 50-day has provided solid support the past two days on the S&P 500. As for asset class performance for the first half of 2016 (year-to-date through June 30), the S&P 500 was up +2.7%, NASDAQ Composite -3.3%, 10-year Treasury bond +15.2%, and gold +24.7%.
Defensive sectors and commodities were the strongest market segments in 1H 2016. Year-to-date through June 30, the top two performing sectors were Telecom and Utilities, up +24.8% and +23.4%, respectively, while Financial was the worst, down -3.0%. Drilling down to specific market segments, gold was up 118%, while specialized consumer services and airlines were down -29.8% and -24.4%, respectively. For the month of June alone, the top two performing sectors of the S&P 500 again were defensive sectors Telecom and Utilities, up +9.3% and +7.8%, respectively, while Financial was down -3.2%. Gold was up +20.8% in June while airlines were down -11.6%.
Corroborating the outperformance of defensive sectors in a general flight to safety was the continued strength in Treasury bonds (and record-low yields). Treasury yields hit record lows at the open on Wednesday of 1.34% on the 10-year and 2.11% on the 30-year (versus 52-week highs of 2.46% and 3.24%). Moreover, the spread between the 10-year and 2-year is only about 80 bps, as the yield curve continues to flatten (thus hurting banks and the Financial sector). CME fed funds futures are now indicating only a 13% probability of a rate hike in December. In fact, indicators currently show zero probability of a hike before then, and remarkably, there is now a slight probability of a rate cut this year.
I have to say that it seems to me that such a momentous decision (with far-reaching global and generational implications) as the Brexit vote should not be decided on a simple majority (and emotionally-charged) vote of the people. That type of thing works fine for your local ballot proposition, such as a bond issue or mandating which hours of the day a gas-powered leaf blower can be operated, but it seems that Brexit should require a bit more in the way of overwhelming conviction in order to go through. Britain voting to exit the “United States of Europe” was not entirely unlike Texas voting to secede from the United States of America (and I think we here in the US can all agree that that would be a bad thing). I think it is entirely possible that there will be tough negotiations that produce significant EU concessions (mostly related to immigration restrictions) that leads to a second referendum on whether the UK leaves the EU. Time will tell, but the uncertainty will linger.
No doubt, uncertainty surrounding Brexit fallout, the US elections, and the Federal Reserve’s monetary policy continue to weigh on investor psyches. It is interesting how the doomsayers are spinning recent events. For instance, Congressman Ron Paul believes that Brexit is the final straw to usher in a total collapse of the global monetary system. Hmmm.
Some high-profile investment managers think a pan-European recession is likely, and could ultimately impact the U.S. Morgan Stanley just hiked their odds of a global recession within the next 12 months to 40%. The IMF slightly reduced its global growth estimates for 2016 and 2017. Furthermore, the rise in nationalism/populism around the world is giving rise to a popular demand to shutdown borders and trade agreements and unwind the pace of globalization, largely due to a belief that the broad middle and working classes are being ignored in favor of serving both the greedy rich and the desperately poor and displaced. Moreover, rising terrorism, Middle East war refugees, huge government debt-to-GDP ratios, and stagnant real growth are paralyzing investors and corporate leaders from making any long-term commitments. How’s that for a Wall of Worry? As a result, slow growth, elevated volatility, low interest rates, and low inflation should persist.
However, as Richard Handler, Chairman and CEO of Jefferies, emphasized in his insightful letter to investors and employees this month, fundamentals are not dead. He acknowledged that it has been quite a while since quality research and value-oriented investing have been rewarded, but he believes the hard work of bottom-up fundamental analysis and seeking strong forward valuations will once again pay off -- which is the same thing I have been saying for the past several months as the market became so news-driven, until more recently showing signs of a rotation back toward fundamental quality.
With low inflation and an accommodative Fed, coupled with Wall Street’s earnings expectations that Q3 2016 will be the first positive year-over-year comp in seven quarters, the climate actually seems promising for equities. Rising earnings will allow stock prices to appreciate without further multiple expansion. All of the banks passed the latest stress test, which assesses capability to withstand severe economic shocks. Oil prices seem to be holding up within a price range that has positive ramifications for both global and US growth. And historically speaking, big spikes in political uncertainty have generally played out as contrarian buy signals, according to FundStrat’s Tom Lee.
In addition, low interest rates make stocks all the more attractive, whether an investor is seeking income or growth -- at least until either bond yields increase or corporate earnings fall. Notably, on February 11th, the 30-year Treasury bond briefly fell below the S&P 500 dividend yield, and of course you know that the market quickly launched higher the next day. Currently, the S&P 500 offers an annual dividend yield of about 2.1%, compared to the 30-year yield that has fallen to about the same level. So, this might be another buy signal for stocks.
The CBOE Market Volatility Index (VIX), aka fear gauge, reached as high as 26.7 on the Monday after the Brexit vote. On Wednesday this week, it hit 17 during some morning volatility before ultimately closing at its low of 14.96 -- essentially right at the 15 threshold between fear and complacency.
Lastly, I wanted to mention that just when it seemed like all the high-profile scientific breakthroughs these days have to do with smart cars, mobile apps, and disease therapies, along comes NASA to show us that its best days are not in its past after all. After a five-year journey through our solar system (and arriving within one second of target ETA), a NASA spacecraft was successfully placed into orbit around Jupiter, where it will gather data for the next two years. Most of my readers know that Sabrient’s founder David Brown was a NASA scientist who worked on the lunar landing project (back in NASA’s heyday). He is quite proud of this latest achievement by his former employer.
SPY chart review:
The SPY closed Wednesday at 209.66 and seems to be consolidating after its Brexit-induced whipsaw. With Wednesday’s bullish engulfing candle, SPY is back above its 50-day, 100-day, and 200-day simple moving averages. However, it remains mired in its long-standing sideways channel, or trading range, which is narrowly focused between 205 (where the early April breakout occurred) and 210 (roughly corresponding with S&P 500 index at 2100 resistance), with occasional failed breakouts above and below this range. A wider interpretation of the channel ranges from 200 to 213 (near its all-time high). We are likely in store for more sideways action during the summer, and the bullish gap from 204 will be beckoning to be filled. But ultimately, the path of least resistance seems to me to be to the upside. Oscillators RSI and MACD look primed to head higher, although Slow Stochastic could stand to cycle lower.
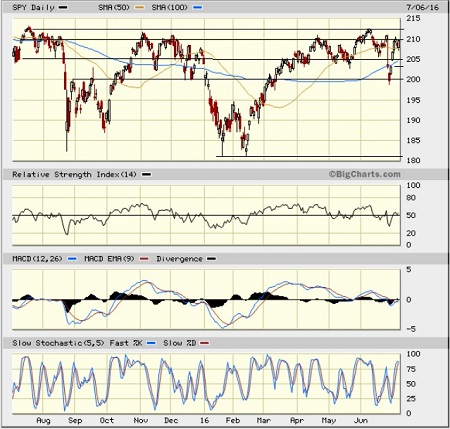
Other broad indexes like NASDAQ and Russell 2000 have similarly regained their 50-day SMAs, but I am a bit concerned about the lack of participation this time around in the transportation index.
Latest sector rankings:
Relative sector rankings are based on our proprietary SectorCast model, which builds a composite profile of each equity ETF based on bottom-up aggregate scoring of the constituent stocks. The Outlook Score employs a forward-looking, fundamentals-based multifactor algorithm considering forward valuation, historical and projected earnings growth, the dynamics of Wall Street analysts’ consensus earnings estimates and recent revisions (up or down), quality and sustainability of reported earnings (forensic accounting), and various return ratios. It helps us predict relative performance over the next 1-3 months.
In addition, SectorCast computes a Bull Score and Bear Score for each ETF based on recent price behavior of the constituent stocks on particularly strong and weak market days. High Bull score indicates that stocks within the ETF recently have tended toward relative outperformance when the market is strong, while a high Bear score indicates that stocks within the ETF have tended to hold up relatively well (i.e., safe havens) when the market is weak.
Outlook score is forward-looking while Bull and Bear are backward-looking. As a group, these three scores can be helpful for positioning a portfolio for a given set of anticipated market conditions. Of course, each ETF holds a unique portfolio of stocks and position weights, so the sectors represented will score differently depending upon which set of ETFs is used. We use the iShares that represent the ten major U.S. business sectors: Financial (IYF), Technology (IYW), Industrial (IYJ), Healthcare (IYH), Consumer Goods (IYK), Consumer Services (IYC), Energy (IYE), Basic Materials (IYM), Telecommunications (IYZ), and Utilities (IDU). Whereas the Select Sector SPDRs only contain stocks from the S&P 500, I prefer the iShares for their larger universe and broader diversity. Fidelity also offers a group of sector ETFs with an even larger number of constituents in each.
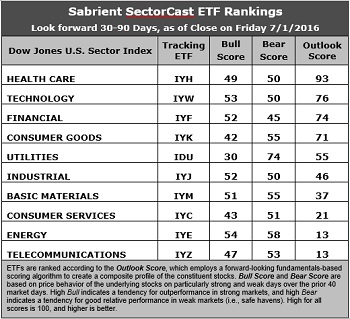
Here are some of my observations on this week’s scores:
1. Healthcare moved back to the top of the rankings with a robust Outlook score of 93, displaying generally good factor scores across the board, including a forward P/E of about 16x and the best Wall Street analyst sentiment (net positive revisions to earnings estimates). However, none of the sectors are reflecting very much in the way of positive sentiment at the moment. Technology falls to second place but also shows good factor scores across the board, including a strong forward long-term growth rate (13.8%), solid return ratios, and the lowest forward PEG of 1.16. Financial takes the third spot with an Outlook score of 74, and it still displays the lowest aggregate forward P/E (14.2x) but also a modest forward long-term growth rate of only 8.9% (indicating a forward PEG of 1.60). Consumer Goods (Staples/Noncyclical) comes in fourth and has the best return ratios, but it sports a relatively high forward PEG of 1.91. Rounding out the top of the rankings are Utilities, Industrial, Basic Materials, and Consumer Services (Discretionary/Cyclical).
2. Energy and Telecom are essentially tied for the lowest fundamental Outlook score of 13. Nevertheless, Energy displays the highest forward long-term growth rate of 14% and the best sell-side sentiment (net positive revisions to earnings estimates), but it is held back by a high forward P/E (30.5x) and anemic return ratios. Telecom displays a forward P/E of 24.6x and a forward long-term growth rate of 10%, indicating a high forward PEG of 2.44.
3. Looking at the Bull scores, Energy has the top score of 54, followed closely by Technology, as they display relative strength on strong market days, while Utilities is the lowest at 30. The top-bottom spread is 24 points, which reflects low sector correlations on strong market days, which can be good for stock picking. It is desirable in a healthy market to see low correlations reflected in a top-bottom spread of at least 20 points, which indicates that investors have clear preferences in the stocks they want to hold (rather than broad risk-on behavior).
4. Looking at the Bear scores, Utilities (as usual) displays the top score of 74, which means that stocks within this sector have been the preferred safe havens on weak market days. Financial scores the lowest at 45, as investors flee during market weakness. The top-bottom spread is 29 points, which reflects quite low sector correlations on weak market days, which can be good for stock picking. Ideally, certain sectors will hold up relatively well while others are selling off (rather than broad risk-off behavior), so it is desirable in a healthy market to see low correlations reflected in a top-bottom spread of at least 20 points.
5. Healthcare displays the best all-around combination of Outlook/Bull/Bear scores, while Telecom is the worst. However, looking at just the Bull/Bear combination, Energy is by far the best, followed by Basic Materials, indicating superior relative performance (on average) in extreme market conditions (whether bullish or bearish), while Consumer Services (Discretionary/Cyclical) is the worst.
6. This week’s fundamentals-based Outlook rankings look neutral to me, given that the top five include all-weather Healthcare, economically-sensitive Technology and Financial, and defensive sectors Utilities and Consumer Goods (Staples/Noncyclical). Keep in mind, the Outlook Rank does not include timing, momentum, or relative strength factors, but rather is a reflection of the fundamental expectations for individual stocks aggregated by sector.
ETF Trading Ideas:
Our Sector Rotation model, which appropriately weights Outlook, Bull, and Bear scores in accordance with the overall market’s prevailing trend (bullish, neutral, or defensive), still reflects a bullish bias (despite the short-lived whipsaw) and suggests holding Technology, Healthcare, and Financial, in that order. (Note: In this model, we consider the bias to be bullish from a rules-based trend-following standpoint when SPY is above both its 50-day and 200-day simple moving averages.)
Besides iShares’ IYW, IYH, and IYF, other highly-ranked ETFs in our SectorCast model from the Technology, Healthcare, and Financial sectors include iShares North American Tech-Multimedia Networking ETF (IGN), iShares US Pharmaceuticals ETF (IHE), and PowerShares KBW High Dividend Yield Financial Portfolio (KBWD).
Others scoring near the top of the rankings with a strong combination of Outlook, Bull, and Bear Scores include iShares US Home Construction ETF (ITB), First Trust NASDAQ Technology Dividend Index Fund (TDIV), Guggenheim Invest Solar ETF (TAN), and Guggenheim Invest Insider Sentiment ETF (NFO).
If you prefer a neutral bias, the Sector Rotation model suggests holding Healthcare, Technology, and Financial, in that order. On the other hand, if you prefer a defensive stance on the market, the model suggests holding Utilities, Consumer Goods (Staples/Noncyclical), and Healthcare, in that order.
IMPORTANT NOTE: I post this information periodically as a free look inside some of our institutional research and as a source of some trading ideas for your own further investigation. It is not intended to be traded directly as a rules-based strategy in a real money portfolio. I am simply showing what a sector rotation model might suggest if a given portfolio was due for a rebalance, and I may or may not update the information on a regular schedule. There are many ways for a client to trade such a strategy, including monthly or quarterly rebalancing, perhaps with interim adjustments to the bullish/neutral/defensive bias when warranted -- but not necessarily on the days that I happen to post this article. The enhanced strategy seeks higher returns by employing individual stocks (or stock options) that are also highly ranked, but this introduces greater risks and volatility. I do not track performance of the ideas mentioned here as a managed portfolio.
Disclosure: Scott Martindale is president of Sabrient Systems, LLC. The author has no positions in stocks or ETFs mentioned.
Disclaimer: This newsletter is published solely for informational purposes and is not to be construed as advice or a recommendation to specific individuals. Individuals should take into account their personal financial circumstances in acting on any rankings or stock selections provided by Sabrient. Sabrient makes no representations that the techniques used in its rankings or selections will result in or guarantee profits in trading. Trading involves risk, including possible loss of principal and other losses, and past performance is no indication of future results.