Sector Detector: Stocks coil as Q3 earnings take the stage and election campaigns heat up
By Scott Martindale
President, Sabrient Systems LLC
As Q3 came to a close, investors continued to show cautious optimism and the S&P 500 posted a gain for the fourth straight quarter. After a lengthy period of time in which markets were buffeted by the daily news about oil prices, jobs reports, Fed rate hike intentions, China growth, Brexit, US economic expansion/contraction, Zika virus, and ISIS inspired attacks, the focus has switched back to improving fundamentals.
In particular, as Q3 earnings reporting season gets started, there remains a broad expectation that the corporate “earnings recession” has bottomed and that companies will start showing better earnings growth (hopefully driven by revenue growth), particularly in the beaten-down market segments like Energy and Materials. I think the only thing holding back stocks right now is investor uncertainty about market reaction to two things: a potential Trump presidential victory and to the next Fed rate hike (expected on December 14). From a technical standpoint, the spring is coiling tightly for big move.
In this periodic update, I give my view of the current market environment, offer a technical analysis of the S&P 500 chart, review our weekly fundamentals-based SectorCast rankings of the ten U.S. business sectors, and then offer up some actionable ETF trading ideas. Overall, our sector rankings look relatively bullish, although the sector rotation model still suggests a neutral stance.
Market overview:
I was in New York City for the past week, including attending the ETF Boot Camp conference, for which Tom Lydon and his team at ETF Trends deserve major kudos. This is Tom’s annual gathering for those involved in creating, managing, and selling exchange-traded products, and it was an outstanding event with great content and networking opportunities … not to mention phenomenal food!
Of course, the presidential election debates have been dominating the airwaves, and the candidates haven’t disappointed with the fireworks, as they lived up to what most were expecting of each of them (including the VP candidates). Unfortunately, the populist sentiment that both sides have been courting (albeit from different angles) may threaten rather than stimulate economic growth and opportunity. Whether we are talking about protectionism that reduces global trade, or price and wage controls that are out of step with the true market values, the likely outcome for many of the proposals is a little relief for the struggling masses at the expense of a reduction in long-term economic growth.
In an effort to court Bernie’s restless millennials, Hillary recently pointed out “basement dwellers,” who ostensibly are college grads who have been forced to work as baristas, Uber drivers, and retail clerks rather than as social media managers, investment banking associates, management consultants, and corporate sales trainees. But I cringe when I see aspiring young professionals turn to “democratic socialism,” with its short-term comfort but long-term shackles, rather than to demand of our government greater freedoms and fewer constraints on business formation and capital investment. After all, in a nation and world with growing populations, the only way to expand opportunities for greater individual wealth is to grow the economy faster than the population is growing. On the other hand, forcing wealth redistribution and “fairness” by soaking the rich, expanding entitlements, and increasing business regulation is a path to economic stagnation.
As I often discuss in this article, what we all must focus on is the underlying cause of our sluggish growth and dearth of career opportunities rather than the symptoms. It is much like the doctor who only prescribes drugs to offset a patient’s poor health rather than demand the critical lifestyle changes in diet and exercise that would allow the patient to not only survive but strengthen and thrive. We have relied far too long on the Federal Reserve for accommodative monetary policies that have only helped alleviate some of the symptoms of the struggling economy without including anything in the way of aggressive fiscal stimulus (e.g., reduced individual and corporate tax rates) and regulatory reform (i.e., removing business-unfriendly obstacles). The result has been a slow-growth economy, asset inflation (which has only benefited those who actually own assets), and a widening wealth gap that continues to leave behind more and more of the population. But, as usual, I digress.
Looking at Q3 performance, emerging market equities were up +7% during the calendar quarter, with Asia countries (e.g., China, Japan, Hong Kong, South Korea, Taiwan) up more than +10%. Here in the US, S&P 500 was up +3.3%, with Technology leading the way at a robust +13%, and other economically sensitive sectors like Industrial, Financial, Energy, Materials, and Consumer Discretionary up in the +2.5-4.5% range. Laggards during Q3 were dividend-paying safe havens like Utilities (down -6.6%), Telecom, Consumer Staples, and REITs.
Notably, during Q3, US-listed ETFs gathered $92 billion during Q3 to push total assets to about $2.4 trillion, according to MarketWatch. Of these, 76% are equity ETFs. Moreover, 12% are categorized as “smart beta,” and 1% are considered actively managed. MarketWatch commented that the growth trend in ETFs is on track to surpass $200 billion for the full year, which would be the third straight year for this level of solid capital inflows.
Oil has held the critical $40 support level since its February breakout, and it finished Q3 up 33% since its January 11 closing low, as OPEC has agreed to limit production and US stockpiles fall. There is also a realization that China seems to be avoiding the hard landing that many feared as it somewhat surprisingly has shown stellar profit growth. Also notable is that UK consumer confidence is back to where it was before the Brexit vote.
Year-to-date through Q3, Gold is up +24% (although it was flat during Q3), emerging markets +16%, S&P 500 large caps +6%, and Russell 2000 small caps +10.3% -- with R2000 Value +14% and R2000 Growth +7.8% as value investing perks up. As for individual sectors this year, Energy is +15%, Utilities +14%, Telecom +12%, Technology +12% Materials +12%, and Industrial +11%.
Interest rates spiked over the past week back to mid-September levels. The 10-year Treasury yield closed Wednesday at 1.72% and the 30-year at 2.44%, while on the short end the 2-year is 0.83% and the 5-year is 1.26%. The spread between the 10-year and 2-year is 89 bps, and the spread between the 30-year and 5-year is 118 bps, as the yield curve remains relatively flat despite a slight rise in rates across the board. Also, CME fed funds futures place the odds of a rate hike in November at only 15%, but then it jumps to 60% for the December FOMC meeting. In any case, I still don’t see any drivers for longer-dated yields to go up in a significant way.
The CBOE Market Volatility Index (VIX), aka fear gauge, closed Wednesday at 12.99, which is back below the 15 threshold between fear and complacency, after spiking above that level during the mid-September volatility.
Given the extremely low yield environment, the elevated P/E of the S&P 500 is not surprising, or even out of whack. After all, the dividend yield alone of the S&P 500 is greater than the 10-year Treasury, and the earnings yield makes stocks even more attractive relative to bonds. However, most observers think that yields have bottomed and the likely direction is higher, and because of the historical inverse relationship between P/E ratios and Treasury bond yields, a rising rate environment would be expected to put a lid on further multiple expansion. This might portend a resurgence in value stocks, which have been lagging growth stocks during the long liquidity-driven market advance. Value historically tends to perform well in a rising rate environment. With their lower P/Es, value stocks finally may be poised to outperform after the news-driven, risk-on/risk-off market behavior that tends to favor the higher market caps and by extension large-cap growth stocks.
Keep in mind, we at Sabrient believe that the most important indicator is not so much trailing or forward P/E but rather forward PEG ratio, i.e., the ratio of forward P/E (current stock price divided by the Wall Street analyst consensus estimate of earnings per share for the next 12 months) to the expected Growth rate (analyst consensus estimate of year-over-year EPS percentage growth for the next 12 months). Despite the elevated multiples of the cap-weighted indexes, we have identified a number of solid companies, particularly in the “smid-cap” space, with excellent growth prospects trading at much lower forward PEG ratios than the broader market indices.
I continue to believe that the US stocks will move even higher this year and into at least the early part of 2017, with double-digit return for the S&P 500 by year-end, and even better return for small caps. Also supportive is the vast amounts of cash on the sidelines and the elevated short interest among institutional investors, which could lead to a significant short squeeze.
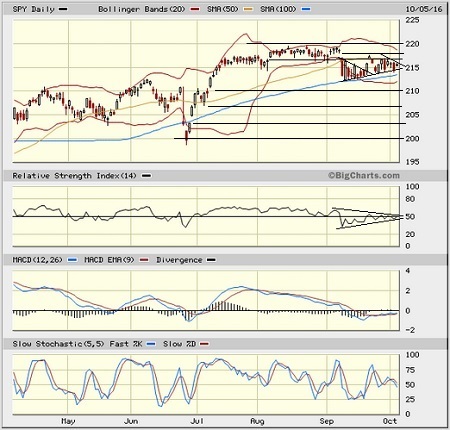
SPY chart review:
The SPY closed Wednesday at 215.63, and remains stuck in a tight trading range bounded by its 50-day and 100-day simple moving averages. However, it appears to be in the midst of forming a bullish ascending wedge pattern with an overhead lid at 217 – just coiling and awaiting an upside catalyst. After breaking out of a symmetrical triangle pattern leading into the Fed’s rate decision, which I wrote about on September 21, it couldn’t break resistance at previous support-turned-resistance at 217 (which coincides with the 50-day SMA), and thus started to form the ascending wedge. Above that, the bearish gap down from 218 on September 8 will serve as a magnet to be filled, but I’m not sure that SPY is quite ready (given the news cycle) to challenge 220. Solid support can be found at 100-day SMA (near 214) and prior resistance-turned support at 210, followed by 208, the 200-day SMA (near 206), and then a prior bullish gap from 204. Oscillators RSI, MACD and Slow Stochastic are all coiling in tight neutral positions and giving no directional indication. Overall, however, I continue to like the technical picture. Note that small caps in particular look promising, as they are in a rising rather than sideways channel.
Latest sector rankings:
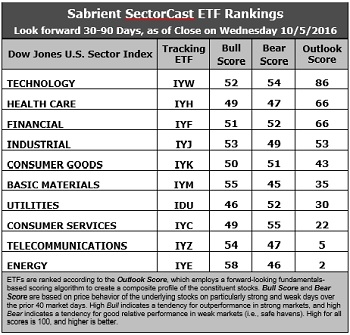
Relative sector rankings are based on our proprietary SectorCast model, which builds a composite profile of each equity ETF based on bottom-up aggregate scoring of the constituent stocks. The Outlook Score employs a forward-looking, fundamentals-based multifactor algorithm considering forward valuation, historical and projected earnings growth, the dynamics of Wall Street analysts’ consensus earnings estimates and recent revisions (up or down), quality and sustainability of reported earnings (forensic accounting), and various return ratios. It helps us predict relative performance over the next 1-3 months.
In addition, SectorCast computes a Bull Score and Bear Score for each ETF based on recent price behavior of the constituent stocks on particularly strong and weak market days. High Bull score indicates that stocks within the ETF recently have tended toward relative outperformance when the market is strong, while a high Bear score indicates that stocks within the ETF have tended to hold up relatively well (i.e., safe havens) when the market is weak.
Outlook score is forward-looking while Bull and Bear are backward-looking. As a group, these three scores can be helpful for positioning a portfolio for a given set of anticipated market conditions. Of course, each ETF holds a unique portfolio of stocks and position weights, so the sectors represented will score differently depending upon which set of ETFs is used. We use the iShares that represent the ten major U.S. business sectors: Financial (IYF), Technology (IYW), Industrial (IYJ), Healthcare (IYH), Consumer Goods (IYK), Consumer Services (IYC), Energy (IYE), Basic Materials (IYM), Telecommunications (IYZ), and Utilities (IDU). Whereas the Select Sector SPDRs only contain stocks from the S&P 500, I prefer the iShares for their larger universe and broader diversity.
Here are some of my observations on this week’s scores:
1. No major changes over the past couple of weeks. Technology retains the top spot with an Outlook score of 86. Stocks within the sector generally display among the best Wall Street sell-side analyst sentiment (net positive revisions to earnings estimates) and insider sentiment, solid return ratios, a reasonable forward P/E of about 17x, a strong forward long-term EPS growth rate (13.9%), and the lowest forward PEG of 1.2 (ratio of forward P/E to forward EPS growth rate). Healthcare comes in second with an Outlook score of 66 and displays an attractive forward P/E of about 15.6x, an expected EPS growth rate of 10.9%, and the second lowest forward PEG of 1.4, although stocks within the sector are seeing net negative earnings revisions. Rounding out the top six are Financial, Industrial, Consumer Goods (Staples/Noncyclical), and Basic Materials. Financial is actually tied with Healthcare for the second spot at 66, and it still displays the lowest forward P/E of 15.2x, although its expected growth rate isn’t quite as attractive at 8.5%, resulting in a forward PEG of 1.8.
2. Energy and Telecom remain in the bottom two. Nevertheless, Energy displays the second highest forward long-term growth rate of 13.1% (albeit because of a low bar for prior-year comps), but it is held back by a high forward P/E (33.3x), a forward PEG of 2.5, and weak return ratios. Telecom also displays a relatively high forward P/E (24.7x) and forward PEG (2.6).
3. Looking at the Bull scores, Energy has the top score of 58 as it displays relative strength on strong market days, while Utilities is the lowest at 46. The top-bottom spread has shrunk to 14 points, which for the moment reflects elevated sector correlations on strong market days, which is not as favorable for stock picking. It is desirable in a healthy market to see low correlations reflected in a top-bottom spread of at least 20 points, which indicates that investors have clear preferences in the stocks they want to hold (rather than broad risk-on behavior).
4. Looking at the Bear scores, Utilities and Telecom have been lagging lately as defensive “safe havens.” Consumer Services (Discretionary/Cyclical) surprisingly displays the top score of 55, followed closely by Technology, which means that stocks within the sectors have been the preferred safe havens lately on weak market days. Energy scores the lowest at 46, as investors flee during market weakness. The top-bottom spread is down to only 9 points, which reflects high sector correlations on weak market days, which isn’t great for stock picking. Ideally, certain sectors will hold up relatively well while others are selling off (rather than broad risk-off behavior), so it is desirable in a healthy market to see low correlations reflected in a top-bottom spread of at least 20 points.
5. Technology displays the best all-around combination of Outlook/Bull/Bear scores, while Telecom and Energy tie for the worst. However, looking at just the Bull/Bear combination, Technology has been the best, indicating superior relative performance (on average) in extreme market conditions (whether bullish or bearish), while Healthcare is the worst. So, while Healthcare scores well from a fundamental standpoint, investors have been less than enthusiastic. Technology on the other hand is doing well both in our rankings and with investor sentiment.
6. This week’s fundamentals-based Outlook rankings still look bullish to me given that the top six sectors include five that are economically sensitive and tend to thrive in a bullish market climate. Keep in mind, the Outlook Rank does not include timing, momentum, or relative strength factors, but rather is a reflection of the fundamental expectations for individual stocks aggregated by sector.
ETF Trading Ideas:
Our Sector Rotation model, which appropriately weights Outlook, Bull, and Bear scores in accordance with the overall market’s prevailing trend (bullish, neutral, or defensive), still displays a neutral bias and suggests holding Technology (IYW), Healthcare (IYH), and Financial (IYF), in that order. (Note: In this model, we consider the bias to be neutral from a rules-based trend-following standpoint when SPY is between its 50-day and 200-day simple moving averages on the rebalance day.)
Besides iShares’ IYW, IYH, and IYF, other highly-ranked ETFs in our SectorCast model from the Technology, Healthcare, and Financial sectors include iShares PHLX Semiconductor ETF (SOXX), VanEck Vectors Biotech ETF (BBH), and SPDR S&P Capital Markets ETF (KCE).
An assortment of other ETFs that are scoring well in our rankings include iShares Mortgage Real Estate Capped ETF (REM), VanEck Vectors BDC Income ETF (BIZD), First Trust NASDAQ Rising Dividend Achievers ETF (RDVY), Guggenheim Invest S&P 500 Equal Weight Technology ETF (RYT), US Market Rotation Strategy ETF (HUSE), and the First Trust LongShort Equity ETF (FTLS), which employs Sabrient’s proprietary Earnings Quality Rank as a key input factor. All score above 90 in Sabrient’s Outlook score.
However, if you prefer a bullish bias, the Sector Rotation model suggests holding Technology, Energy, and Basic Materials, in that order. On the other hand, if you are more comfortable with a defensive stance on the market, the model suggests holding Technology, Financial, and Consumer Services (Discretionary/Cyclical), in that order.
IMPORTANT NOTE: I post this information periodically as a free look inside some of our institutional research and as a source of some trading ideas for your own further investigation. It is not intended to be traded directly as a rules-based strategy in a real money portfolio. I am simply showing what a sector rotation model might suggest if a given portfolio was due for a rebalance, and I may or may not update the information on a regular schedule. There are many ways for a client to trade such a strategy, including monthly or quarterly rebalancing, perhaps with interim adjustments to the bullish/neutral/defensive bias when warranted -- but not necessarily on the days that I happen to post this article. The enhanced strategy seeks higher returns by employing individual stocks (or stock options) that are also highly ranked, but this introduces greater risks and volatility. I do not track performance of the ideas mentioned here as a managed portfolio.
Disclosure: The author has no positions in stocks or ETFs mentioned.
Disclaimer: This newsletter is published solely for informational purposes and is not to be construed as advice or a recommendation to specific individuals. Individuals should take into account their personal financial circumstances in acting on any rankings or stock selections provided by Sabrient. Sabrient makes no representations that the techniques used in its rankings or selections will result in or guarantee profits in trading. Trading involves risk, including possible loss of principal and other losses, and past performance is no indication of future results.