Sector Detector: Stocks back in rally mode even without Tech leadership
 Five years ago this month, the S&P 500 hit all-time high of 1576. It closed Wednesday at 1461. Can the market make a run at that all-time high? Well, the biggest threat at the moment to bullish sentiment is the Fiscal Cliff, but both presidential candidates have a plan for dealing with it, and Congress is unlikely to want to take the fall for defying the new President and sending the country back into recession.
Harvard professor and former Treasury Secretary Larry Summers wielded a cattle prod by saying, “…it would be an act of huge irresponsibility that would make a return to recession very likely." But he added that “…sometimes when the need is sufficiently great, the transition [in Washington] from inconceivable to inevitable can actually be fairly quick.” For its part, the IMF is quite worried about the Fiscal Cliff, not to mention the EU’s lackluster handling of the eurozone debt crisis.
Earnings season is in full swing. Multinational Industrials like Chevron (CVX) and Alcoa (AA) reduced guidance, while big banks like Citigroup (C), JPMorgan Chase (JPM), and Bank of America (BAC) beat expectations along with Consumer Services leaders like Yum! Brands (YUM) and Walmart (WMT). However, the one sector that hasn't participated in the recent rally is Technology, and this is confirmed in the Sabrient Bear scores.
Tech bellwethers like IBM (IBM) and Intel (INTC) gave reports that indicated a weakening of global demand. In fact, the iShares Technology Sector Fund (IYW) is the only iShares sector ETF below its 50-day simple moving average, as is the PowerShares QQQ Trust (QQQ)—dragged down by recent weakness in Apple (AAPL). Tech is usually a leader in bull markets, so investors are justifiably concerned.
As I write this on Wednesday night on the West Coast, Asian stocks are trading at a seven-month high on indications that China’s economy is stabilizing, as their GDP grew 7.4% year-over-year (although this makes the seventh straight quarter of slower growth). Also, they are encouraged by upside surprises on EU Industrial Production, rising U.S. consumer sentiment, solid U.S. housing data, and falling Spanish bond yields.
Just a quick comment on Presidential Debate #2. Of course, it’s always harder on an incumbent to defend his record during trying times while the challenger is free to stay on the attack. However, it doesn’t really matter who “won” the debate—what matters is whether a candidate can fashion a message that resonates with a given voter. And there were two messages from Romney that really resonated with me. One is the notion that we don’t have to “settle” for the circumstances we are in as inevitable. The other is that it doesn’t matter how caring and likeable a leader might be if he doesn’t have an effective plan to make things better and the proven ability to successfully execute it.
The S&P 500 SPDR Trust (SPY) closed Wednesday at 146.20. Looking at the chart, it got strong support last week from its 50-day simple moving average and the bottom of the same bullish rising channel that has been in place since the rally started at the beginning of June. Price has made some attempts to break out or break down (including one false breakout in mid-September), but it just keep falling back within the rising channel. Now there appears to be a sideways trading channel (or perhaps a bull flag) forming between closing lows near 143 and closing highs near 147.
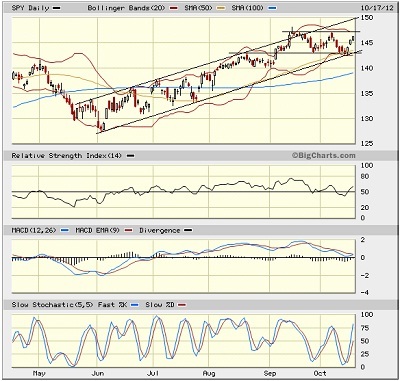
Last week, I noted that oscillators like RSI, MACD, and Slow Stochastic were all pointing toward further weakness, but that it would likely find near-term support and be a buying opportunity. This week, all of those oscillators have turned back up to confirm the rally. And there are several moving averages and strong levels of support just below, so we might see a continued rally into the presidential election—at least back to the top of the rising channel where it can contemplate a post-election breakout.
Beyond that, as long as the Fiscal Cliff is avoided and our elected leaders can introduce some effective fiscal policies so the economy isn’t dependent solely upon non-elected Fed Chairman Bernanke’s monetary policies, there’s really no better place for a global investor to put his precious capital than the U.S. stock market.
The CBOE Market Volatility Index (VIX), a.k.a. “fear gauge,” closed Wednesday at 15.07. It actually dropped below strong support at 14 on October 5, and has stayed below 17 even through last week’s market weakness and test of support. This is still quite low and generally bullish for stocks.
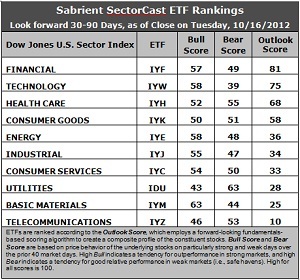
Latest rankings: The table ranks each of the ten U.S. industrial sector iShares (ETFs) by Sabrient’s proprietary Outlook Score, which employs a forward-looking, fundamentals-based, quantitative algorithm to create a bottom-up composite profile of the constituent stocks within the ETF. In addition, the table also shows Sabrient’s proprietary Bull Score and Bear Score for each ETF.
High Bull score indicates that stocks within the ETF have tended recently toward relative outperformance during particularly strong market periods, while a high Bear score indicates that stocks within the ETF have tended to hold up relatively well during particularly weak market periods. Bull and Bear are backward-looking indicators of recent sentiment trend.
As a group, these three scores can be quite helpful for positioning a portfolio for a given set of anticipated market conditions.
Observations:
1. Overall, I would say that the Outlook rankings remain mostly neutral. Financial (IYF) retains the top spot with an Outlook score of 81, followed by Technology (IYW) at 75. Stocks within IYF continue to enjoy by far the most support from Wall Street’s analysts as earnings estimates have been rising while other sectors have been flat or down. Tech stocks continue to be hammered, although IYW still displays an impressive combination of low forward P/Es, strong projected long-term growth, and solid return ratios.
2. Healthcare (IYH) is now back in the third spot with an Outlook score of 68, ahead of defensive sector Consumer Goods (IYK). Notably, Energy (IYE) has seen a bit of stabilization among Wall Street’s earnings expectations at current levels, which has allowed IYE to climb into the fifth spot.
3. Telecom (IYZ) stays at the bottom of the Outlook rankings with an Outlook score of 10. Stocks within the sector are burdened by the highest forward P/Es and the worst return ratios, plus net downgrades from Wall Street. Basic Materials (IYM) is the second worst with a 25, primarily because Wall Street continues to reduce earnings expectations and longer-term growth rate forecasts.
4. Looking at the Bull scores, Materials (IYM) is the clear leader on strong market days, scoring 63. Utilities (IDU) is still the weakest on strong market days, scoring 43. In other words, Materials stocks have tended to perform the best when the market is rallying, while Utilities stocks have lagged.
5. Looking at the Bear scores, Utilities (IDU) is the investor safe haven on weak market days, scoring 63. Technology (IYW) remains tied to the whipping post during recent market weakness, as reflected by its low Bear score of 39. In other words, Tech stocks have tended to sell off the most when the market is pulling back, while Utilities stocks have held up the best.
6. Overall, Financial (IYF) shows the best all-weather combination of Outlook/Bull/Bear scores. Adding up the three scores gives a total of 187. Telecom (IYZ) is the worst at 109. As for Bull/Bear combination, Materials (IYM) and Healthcare (IYH) are showing the best score at 107, while Technology (IYW) is the worst with a dismal 97, despite its relatively strong fundamentals-based forward-looking Outlook score.
These scores represent the view that the Financial and Technology sectors may be relatively undervalued overall, while Telecom and Materials sectors may be relatively overvalued based on our 1-3 month forward look.
Top-ranked stocks within IYF and IYW include MasterCard (MA), The Travelers Companies (TRV), Qualcomm (QCOM), and Google (GOOG).
Disclosure: Author has no positions in stocks or ETFs mentioned.
About SectorCast: Rankings are based on Sabrient’s SectorCast model, which builds a composite profile of each equity ETF based on bottom-up aggregate scoring of the constituent stocks. The Outlook Score employs a fundamentals-based multi-factor approach considering forward valuation, earnings growth prospects, Wall Street analysts’ consensus revisions, accounting practices, and various return ratios. It has tested to be highly predictive for identifying the best (most undervalued) and worst (most overvalued) sectors, with a 1-3 month forward look.
Bull Score and Bear Score are based on the price behavior of the underlying stocks on particularly strong and weak days during the prior 40 market days. They reflect investor sentiment toward the stocks (on a relative basis) as either aggressive plays or safe havens. So, a high Bull score indicates that stocks within the ETF have tended recently toward relative outperformance during particularly strong market periods, while a high Bear score indicates that stocks within the ETF have tended to hold up relatively well during particularly weak market periods.
Thus, ETFs with high Bull scores generally perform better when the market is hot, ETFs with high Bear scores generally perform better when the market is weak, and ETFs with high Outlook scores generally perform well over time in various market conditions.
Of course, each ETF has a unique set of constituent stocks, so the sectors represented will score differently depending upon which set of ETFs is used. For Sector Detector, I use ten iShares ETFs representing the major U.S. business sectors.
About Trading Strategies: There are various ways to trade these rankings. First, you might run a sector rotation strategy in which you buy long the top 2-4 ETFs from SectorCast-ETF, rebalancing either on a fixed schedule (e.g., monthly or quarterly) or when the rankings change significantly. Another alternative is to enhance a position in the SPDR Trust exchange-traded fund (SPY) depending upon your market bias. If you are bullish on the broad market, you can go long the SPY and enhance it with additional long positions in the top-ranked sector ETFs. Conversely, if you are bearish and short (or buy puts on) the SPY, you could also consider shorting the two lowest-ranked sector ETFs to enhance your short bias.
However, if you prefer not to bet on market direction, you could try a market-neutral, long/short trade—that is, go long (or buy call options on) the top-ranked ETFs and short (or buy put options on) the lowest-ranked ETFs. And here’s a more aggressive strategy to consider: You might trade some of the highest and lowest ranked stocks from within those top and bottom-ranked ETFs.