Sector Detector: New “Grecian Formula” is making us all gray

Despite the fact that U.S. equities are well-positioned and well-supported to go up, once again it is the headlines out of Europe—especially Greece—that are scaring off investors. Some are saying that it is now likely (and even desirable) that Greece will default on all its sovereign debt, withdraw from the euro, and severely devalue its domestic currency (Drachma?). This will allow them to operate a balanced budget while pumping cash into growth initiatives, rather than suffer the ravages of Germany-mandated austerity.
Some say, so what? Greece makes up only about 2% of the Eurozone’s overall economy. Nevertheless, you might say that this new “Grecian Formula” is creating the opposite effect to the men’s hair product, i.e.., rather than losing the gray we are all getting grayer from the stress of it all—especially the banks holding all that Greek debt. The new Greek elections are set for June 17, which will tell us much about how this all resolves.
On Wednesday, Germany sold about $5.8 billion worth of 2-year zero coupon bonds with an effective yield of virtually zero. In other words, investors are buying them simply to preserve capital, i.e., a return of their principal rather than trying to seek any kind of return on their principal (and risk losing it).
While Spain and Italy have to pay increasingly higher yields on their bonds, Germany’s stability allows them to receive free money from the investment community. And Greece, you might ask? Its 1-year bond is yielding over 1,100%.
As the euro continues to fall against the U.S. dollar, U.S. equities suffer, even though recent U.S. economic data continues to improve. Even housing is getting in on the upswing. And of course, although the latest stimulus program, Operation Twist, is set to end in June, the Fed has promised to stand ready to provide all liquidity required to keep the U.S. economy functioning. Nothing beats free money. But still, investor worry about global economic dominoes falling prevails.
Let me make a brief comment on the latest Wall Street boondoggle—also known as Facebook (FB). Of course, we all know that it is a terrific destination with a huge and rapidly growing following of loyal users. Surely there will be a way to continue growing revenues without chasing away their legions of fans. But the fact is that nobody using Facebook is there to buy anything. They are there to socialize. Slipping in ads and trying to generate revenues for businesses is a balancing act that can backfire if done wrong or too aggressively.
Contrast their business model with the profit juggernaut of the 21st Century—also known as Apple (AAPL). Apple also has a huge following of loyal fans, but unlike Facebook, Apple’s clients are dying to buy their products. The appetite is insatiable to buy the next big thing they release. People line up to be the first to own the latest model, even when their previous model is still perfectly good. What a phenomenal business. In other words, selling stuff attracts people to Apple but repels people from Facebook.
This makes revenue growth at Facebook tricky and its ridiculously high valuation problematic. I know in which company I’d rather own shares. Now Wall Street once again looks like they have screwed the little guy. After all, Morgan Stanley earned $100 million for adding very little value to the process, and they reportedly had access to inside information about future revenue growth. Now Congress feels they must get involved. Wonderful.
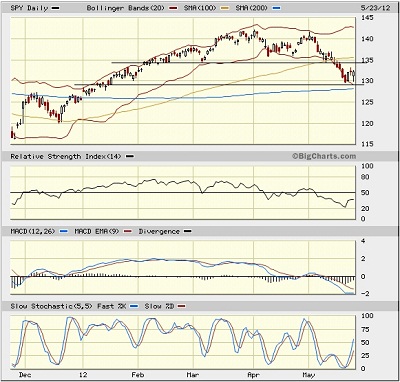
SPY closed Wednesday at 132.27 after making an impressive late-day recovery from what seemed like a resumption of last week’s weakness. The day finished with a handsome—and potentially bullish—hammer formation on the daily candle. Volume was quite strong during last Thursday and Friday’s market weakness. But round-number support at 130, and the prospect of strong support at the 200-day simple moving average, led to an oversold bounce on Monday. Now the market is waiting to see if bulls can hold their ground at this level. RSI, MACD, and Slow Stochastic are turning up from deep oversold territory.

Given the weak technical conditions, any sign of promising news from across the pond could result in a very strong relief rally. But the likelihood of such news is rapidly eroding.
The TED spread (indicator of credit risk in the general economy, measuring the difference between the 3-month T-bill and 3-month LIBOR interest rates) closed Wednesday once again at 39 bps. After complacently sitting in the teens last year, it rose to near 60 at the height of the Eurozone crisis in December, but has since flatlined in this mid-level zone near 40 since mid-February.
The VIX (CBOE Market Volatility Index—a.k.a. “fear gauge”) closed Wednesday at 22.33. Last fall in the heat of the Eurozone crisis, fear was elevated and 30 was acting as strong support. As fears subsided, VIX finally broke down and it quickly made its way to test support at 20 for about 4 weeks before breaking down further. Despite the fear and uncertainty around a Greek default and exit from the euro, VIX is still relatively low. In other words, fear could go a lot higher, and drag down stocks a lot further. Do I think it will? No.
As a reminder, The MacroReport is Sabrient’s newest product for the investment professional. This is a monthly co-publication of Sabrient Systems and MacroRisk Analytics, providing an in-depth analysis of the macroeconomic trends in focus territories around the world and their impact on the U.S. economy, along with actionable ideas (U.S. stocks and ETFs) intended to capitalize on a given outcome. Complimentary access is available on Sabrient’s web site through MacroReport InterActive. The inaugural March issue focused on Greece. The current issue focuses on China. The next issue, slated to be released this week, will look at oil prices and the global issues that impact it.
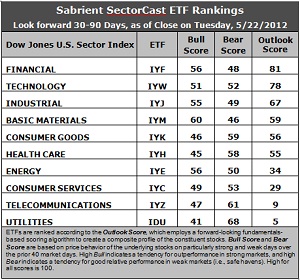
Latest rankings: The table ranks each of the ten U.S. industrial sector iShares (ETFs) by Sabrient’s proprietary Outlook Score, which employs a forward-looking, fundamentals-based, quantitative algorithm to create a bottom-up composite profile of the constituent stocks within the ETF. In addition, the table also shows Sabrient’s proprietary Bull Score and Bear Score for each ETF.
High Bull score indicates that stocks within the ETF have tended recently toward relative outperformance during particularly strong market periods, while a high Bear score indicates that stocks within the ETF have tended to hold up relatively well during particularly weak market periods. Bull and Bear are backward-looking indicators of recent sentiment trend.
As a group, these three scores can be quite helpful for positioning a portfolio for a given set of anticipated market conditions.

Observations:
1. Financial (IYF) stays at the top of the Outlook rankings with an 81, and Technology (IYW) continues in second place with a 78. Industrial (IYJ) is in third, followed by a resurgent Basic Materials (IYM). This is a bullish top four. IYF still has one of the lowest (best) forward P/Es, and it continues to gain support among analysts as the banks re-emerge, despite their vulnerability to Europe’s turmoil. IYW remains strong in its return ratios as margins are high for tech products.
2. Wall Street analysts continue to pound on Energy (IYE) and Utilities (IDU) with earnings downgrades, but Materials (IYM) has gained some support from the analysts. It appears that they are saying enough is enough, time to get back on the bandwagon.
3. Utilities (IDU) has fallen to the bottom of the rankings with a dismal Outlook score of 5. It is saddled with the least analyst support, the lowest long-term growth rate, and one of the worst (highest) forward P/Es. It is again joined in the bottom two by Telecom (IYZ) with an Outlook score of 9.
4. Looking at the Bull scores, Basic Materials (IYM) has been quite strong on strong market days, so its score is now a robust 60, followed by Financial (IYF) and Energy (IYE). Utilities (IDU) is by far the weakest on strong days, scoring 41.
5. Looking at the Bear scores, Utilities (IDU) remains the investor favorite “safe haven” on weak market days, scoring a strong 68, followed by Telecom (IYZ). Materials (IYM) has the lowest Bear score of 46, while Energy (IYE) has strengthened significantly. Stocks within IYM have tended to sell off the most when the market is pulling back.
6. Overall, IYF still shows the best all-weather combination of Outlook/Bull/Bear scores. Adding up the three scores gives a total of 185. IYW is next at 181. IDU is the worst at 114. IDU and IYZ now reflect the best combination of Bull/Bear at 109 and 108, respectively, which is both defensive and bearish for the overall market. Consumer Services (IYC) displays the worst combination with a 102, as investors have avoided the sector under all market conditions.
These scores represent the view that the Financial and Technology sectors may be relatively undervalued overall, while Telecom and Utilities sectors may be relatively overvalued based on our 1-3 month forward look.
Top-ranked stocks within Financial and Technology sectors include Simon Property Group (SPG), World Acceptance Corp (WRLD), CalAmp Corp (CAMP), and Demand Media (DMD).
Disclosure: Author has no positions in stocks or ETFs mentioned.
About SectorCast: Rankings are based on Sabrient’s SectorCast model, which builds a composite profile of each equity ETF based on bottom-up scoring of the constituent stocks. The Outlook Score employs a fundamentals-based multi-factor approach considering forward valuation, earnings growth prospects, Wall Street analysts’ consensus revisions, accounting practices, and various return ratios. It has tested to be highly predictive for identifying the best (most undervalued) and worst (most overvalued) sectors, with a one-month forward look.
Bull Score and Bear Score are based on the price behavior of the underlying stocks on particularly strong and weak days during the prior 40 market days. They reflect investor sentiment toward the stocks (on a relative basis) as either aggressive plays or safe havens. So, a high Bull score indicates that stocks within the ETF have tended recently toward relative outperformance during particularly strong market periods, while a high Bear score indicates that stocks within the ETF have tended to hold up relatively well during particularly weak market periods.
Thus, ETFs with high Bull scores generally perform better when the market is hot, ETFs with high Bear scores generally perform better when the market is weak, and ETFs with high Outlook scores generally perform well over time in various market conditions.
Of course, each ETF has a unique set of constituent stocks, so the sectors represented will score differently depending upon which set of ETFs is used. For Sector Detector, I use ten iShares ETFs representing the major U.S. business sectors.
About Trading Strategies: There are various ways to trade these rankings. First, you might run a sector rotation strategy in which you buy long the top 2-4 ETFs from SectorCast-ETF, rebalancing either on a fixed schedule (e.g., monthly or quarterly) or when the rankings change significantly. Another alternative is to enhance a position in the SPDR Trust exchange-traded fund (SPY) depending upon your market bias. If you are bullish on the broad market, you can go long the SPY and enhance it with additional long positions in the top-ranked sector ETFs. Conversely, if you are bearish and short (or buy puts on) the SPY, you could also consider shorting the two lowest-ranked sector ETFs to enhance your short bias.
However, if you prefer not to bet on market direction, you could try a market-neutral, long/short trade—that is, go long (or buy call options on) the top-ranked ETFs and short (or buy put options on) the lowest-ranked ETFs. And here’s a more aggressive strategy to consider: You might trade some of the highest and lowest ranked stocks from within those top and bottom-ranked ETFs, such as the ones I identify above.
