Sector Detector: Investors place their bets on improving forward guidance
Q2 is well underway for the economy, while Q1 corporate earnings reporting season kicks into high gear this week. Although investors have pretty much written off the quarter as a stinker, they are eagerly anticipating forward guidance for the back half of the year. With the major indexes and underlying valuations sitting at lofty heights, investors are evidently pricing in improving fundamentals ahead, particularly here at home in the U.S.
In this periodic update, I give my view of the current market environment, offer a technical analysis of the S&P 500 chart, review our weekly fundamentals-based SectorCast rankings of the ten U.S. business sectors, and then offer up some actionable ETF trading ideas.
Market overview:
We have seen a strong rally starting with the edge-of-the-cliff reversal that commenced on February 12, but equity investors will need more than hopeful optimism to keep the party going. Luckily, they have a still-dovish Fed on their side and low Treasury yields as an uninspiring alternative, which is likely to entice capital into risk assets, including U.S. equities. And after being led at first by what many call a risk-on short-covering junk rally, investors now appear to be getting more discerning as correlations fall and breadth gradually improves, and higher quality names are finally garnering some attention.
Notably, ETGI reported that US-listed assets invested in ETFs/ETPs reached a new record of US$2.17 trillion at the end of Q1, surpassing the prior record of US$2.15 trillion set at the end of May 2015. This includes 1,863 ETFs/ETPs from 94 providers.
However, Friday’s economic reports weren’t good. Consumer Sentiment recorded its fourth straight month of decline, falling to a dismal 89.7, and Industrial Production came in at -0.6%. The only good thing about these readings from an investor standpoint is that they help keep Fed rate hikes at bay (in another case of bad news is good news).
Also, stocks continue to be tied to the daily gyrations of oil prices. But I think this is only the case while oil price hovers around $40, which is something of a threshold for the fortunes of energy companies and the high-yield market for energy loans. DoubleLine Capital’s Jeffrey Gundlach has been adamant that crude oil needs to trade back up above $45/bbl to stave off a wave of junk bond defaults and all the associated global fallout, especially in the Energy and Financial sectors and in emerging markets.
Unfortunately for stocks over the near term, a weekend meeting in Qatar of major producers collapsed without an agreement to freeze production at January levels. Saudi Arabia demanded that the agreement include its rival Iran, which did not attend the meeting. So now the fear is of a renewed price war for market share. As I’ve said many times in the past, oil is a Goldilocks asset that can’t be either too hot or too cold. Although lower prices help the consumer’s pocketbook and a large segment of a fuel-dependent economy, they also hurt energy companies and high-yield debt markets and destabilize emerging market producers, threatening jobs and capital investment programs, and emerging market government spending. The comfort zone is probably in the range of $50-80/bbl.
Sorry but I can’t help but make a token comment about the Presidential election campaigning. Virtually since the beginning of the Republican campaign, the discourse has been characterized by mudslinging and vitriol among the top candidates, while the Dems have shown much more decorum. Bernie showed a lot of integrity by not taking the bait of questioners and keeping to the issues. But now that has all changed, and the Dems are in full-on food-fight mode. Why? Because it works. Voters react and change their votes. In order to win, you quickly realize that you can’t just calmly share your ideas and experiences -- you also must tear down the support of your opponent. But don’t blame the politicians. It’s on us. A good mudslinger is always popular.
The key theme that has given so much traction to the top contenders has been their populist messages about how the economic system is rigged against the common man. Each has his own twist on the notion that trade deals, government bailouts, the tax system, Fed monetary policy, and so forth all bestow great advantages upon the wealthy and help them to further exploit the working and middle classes. There is little doubt that whether through deliberate design or unintended consequences it is largely true, and often what appears from a macro perspective to be improving economic growth actually lacks the broader and inclusive impact that is necessary for a sustained recovery. As an example, witness the performance of the major stock indexes last year compared to the fate of the average stock. Breadth was terrible and market performance was attributable almost entirely to a handful of mega-cap stocks.
So what can be done? Although the Federal Reserve’s adjustments to its previous intentions of tightening and normalization has supported the stock market, real success must show up not just in prices of risk assets but also in robust economic growth, business start-ups, broadening home ownership, and wage inflation. But what we really need is leadership -- to work with (rather than simply rail against) Corporate America, to unleash the true strengths of capitalism (encouraging innovation while broadening access to capital, opportunity, and prosperity), and to craft structural reforms and fiscal policies that can bolster and give focus and direction to the helpful and well-intentioned but ultimately insufficient monetary policies of low interest rates and abundant liquidity. In other words, central banks are not equipped to offer the complete solution.
Among the main U.S. business sectors, performance of Financials in particular has been disappointing, as have Healthcare stocks. These two sectors have been hindered at least partially by the uncertainty created by Presidential election campaign rhetoric targeting too-big-to-fail banks and drug pricing practices. Financials are also impacted by fear of the uncertain impacts of failures in the high-yield debt market (especially energy loans).
While the S&P 500 now provides a 2.10% dividend yield, the 10-year Treasury yield closed Friday at 1.75%. The CBOE Market Volatility Index (VIX), aka fear gauge, closed Friday at 13.62 and is back below the 15 threshold (and solidly in the zone of complacency) despite a couple of daily closes above 16 during the first half of April.
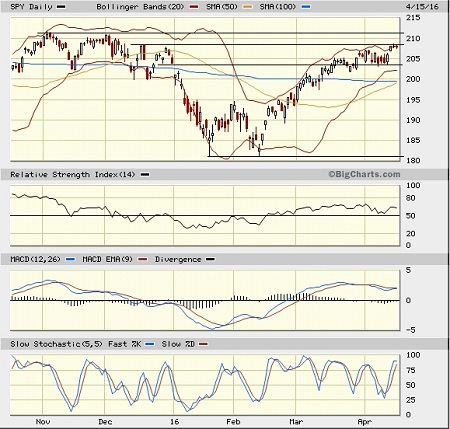
SPY chart review:
The SPDR S&P 500 Trust (SPY) closed Monday at 207.78 and remains above all its major moving averages (i.e., 20-day, 50-day, 100-day, and 200-day). It formed a bullish W-pattern in February, which was confirmed at the start of March on the breakout above 195. It then filled the bearish gap from 204, consolidated there, and then broke out to the upside in mid-March, retested new resistance-turned support at 204, and then started moving higher again last week to challenge previous resistance levels, starting with 209 (from December). The 50-day SMA is pointing upward bullishly and crossing up through the 100-day (near 200), with the 200-day not much further away (just beyond 201). On the other hand, volume has been falling. If price can’t break through the 209 level right away, SPY may pull back and trade in the channel between 204 and 209 until a catalyst emerges -- perhaps improving forward guidance as earnings are announced. After cycling back to neutral, oscillators RSI, MACD, and Slow Stochastic are back to overbought territory. I expect a retest of support at 204 before another attack on resistance at 209.
Latest sector rankings:
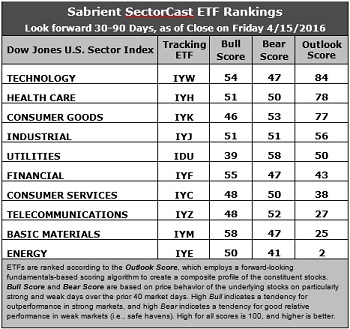
Relative sector rankings are based on our proprietary SectorCast model, which builds a composite profile of each equity ETF based on bottom-up aggregate scoring of the constituent stocks. The Outlook Score employs a forward-looking, fundamentals-based multifactor algorithm considering forward valuation, historical and projected earnings growth, the dynamics of Wall Street analysts’ consensus earnings estimates and recent revisions (up or down), quality and sustainability of reported earnings (forensic accounting), and various return ratios. It helps us predict relative performance over the next 1-3 months.
In addition, SectorCast computes a Bull Score and Bear Score for each ETF based on recent price behavior of the constituent stocks on particularly strong and weak market days. High Bull score indicates that stocks within the ETF recently have tended toward relative outperformance when the market is strong, while a high Bear score indicates that stocks within the ETF have tended to hold up relatively well (i.e., safe havens) when the market is weak.
Outlook score is forward-looking while Bull and Bear are backward-looking. As a group, these three scores can be helpful for positioning a portfolio for a given set of anticipated market conditions. Of course, each ETF holds a unique portfolio of stocks and position weights, so the sectors represented will score differently depending upon which set of ETFs is used. We use the iShares that represent the ten major U.S. business sectors: Financial (IYF), Technology (IYW), Industrial (IYJ), Healthcare (IYH), Consumer Goods (IYK), Consumer Services (IYC), Energy (IYE), Basic Materials (IYM), Telecommunications (IYZ), and Utilities (IDU). Whereas the Select Sector SPDRs only contain stocks from the S&P 500, I prefer the iShares for their larger universe and broader diversity. Fidelity also offers a group of sector ETFs with an even larger number of constituents in each.
Here are some of my observations on this week’s scores:
1. Technology has regained the top spot with an Outlook score of 84, as it displays generally solid factor scores across the board, including the best forward long-term growth rate (13.9%), positive Wall Street analyst sentiment (net upward revisions to earnings estimates), and strong return ratios. Healthcare is in second with a 78 score, including a relatively low forward P/E (15.9x), a solid forward long-term annual growth rate (10.7%), and relatively good sell-side analyst sentiment. Consumer Goods (Staples/Noncyclical) is a close third with an Outlook score of 77, as it displays the best sell-side analyst sentiment and the highest return ratios, although its forward P/E is on the high side (18.7x). Rounding out the top five are Industrial, which continues to rise (bullish indication for the overall rankings), and Utilities, which continues to gradually fall (also bullish for the overall rankings). All five have an Outlook score above 50. Notably, Basic Materials has quickly fallen back as analyst upward revisions have tailed off, indicating that its recent jump in the rankings was likely a brief anomaly. Financial still displays the lowest aggregate forward P/E (14.9x), but the sector continues to be the target of analyst reductions to earnings estimates as the yield curve fails to steepen and the pace of the Fed’s plan to normalize short terms rates is more doubtful.
2. Energy remains mired firmly at the bottom with an Outlook score of 2 as the sector scores among the worst in all factors of the GARP model, including the highest forward P/E, which has risen to 30.5x as short-covering and speculative bottom-fishing in the sector continue. It remains the only sector to display a negative long-term growth rate. Telecom takes the other spot in the bottom two with an Outlook score of 20.
3. Looking at the Bull scores, Basic Materials remains at the top of the list with a 58 and continues to display relative strength on strong market days, while Utilities is the lowest at 39. The top-bottom spread is 19 points, which continues to reflect relatively low sector correlations on strong market days, which is good for stock picking. It is generally desirable in a healthy market to see low correlations reflected in a top-bottom spread of at least 20 points, which indicates that investors have clear preferences in the stocks they want to hold (rather than broad risk-on behavior).
4. Looking at the Bear scores, Utilities (as usual) displays the top score of 58, which means that stocks within this sector have been the preferred safe havens on weak market days. Energy scores the lowest at 41, as investors flee during market weakness (which lately has been correlated with falling oil prices). The top-bottom spread is 17 points, which reflects relatively low sector correlations on weak market days, which is good for stock picking. Ideally, certain sectors will hold up relatively well while others are selling off (rather than broad risk-off behavior), so it is generally desirable in a healthy market to see low correlations reflected in a top-bottom spread of at least 20 points.
5. Technology displays the best all-around combination of Outlook/Bull/Bear scores, while Energy is by far the worst. However, looking at just the Bull/Bear combination, Basic Materials is the best, indicating superior relative performance (on average) in extreme market conditions (whether bullish or bearish), while Energy is the worst.
6. This week’s fundamentals-based Outlook rankings still look neutral, with continuing signs of defensiveness given that Consumer Goods (Staples/Noncyclical) and Utilities are in the top five and Financial is falling. On the other hand, Technology remains at the top and Industrial continues to rise, which are bullish signs. Keep in mind, the Outlook Rank does not include timing, momentum, or relative strength factors, but rather is a reflection of the fundamental expectations of individual stocks aggregated by sector.
ETF Trading Ideas:
Our Sector Rotation model, which appropriately weights Outlook, Bull, and Bear scores in accordance with the overall market’s prevailing trend (bullish, neutral, or defensive), reflects a bullish bias and suggests holding Technology, Healthcare, and Basic Materials, in that order. (Note: In this model, we consider the bias to be bullish from a rules-based trend-following standpoint when SPY is above both its 50-day and 200-day simple moving averages.)
Besides iShares’ IYW, IYH, and IYM, Other highly-ranked ETFs in SectorCast from the Technology, Healthcare, and Basic Materials sectors include First Trust Technology AlphaDEX Fund (FXL), Loncar Cancer Immunotherapy ETF (CNCR), and PowerShares S&P Small Cap Materials Portfolio (PSCM). Others scoring near the top of the rankings that I haven’t mentioned before include iShares US Home Construction ETF (ITB), PureFunds ISE Mobile Payments ETF (IPAY), PowerShares International Dividend Achievers Portfolio (PID), and Direxion iBillionaire Index ETF (IBLN).
If you prefer to stick with a neutral bias, the Sector Rotation model suggests holding Technology, Healthcare, and Consumer Goods (Staples/Noncyclical), in that order. On the other hand, if you prefer a defensive stance on the market, the model suggests holding Utilities, Consumer Goods (Staples/Noncyclical), and Healthcare, in that order.
IMPORTANT NOTE: I post this information periodically as a free look inside some of our institutional research and as a source of some trading ideas for your own further investigation. It is not intended to be traded directly as a rules-based strategy in a real money portfolio. I am simply showing what a sector rotation model might suggest if a given portfolio was due for a rebalance, and I may or may not update the information each week. There are many ways for a client to trade such a strategy, including monthly or quarterly rebalancing, perhaps with interim adjustments to the bullish/neutral/defensive bias when warranted -- but not necessarily on the days that I happen to post this weekly article. The enhanced strategy seeks higher returns by employing individual stocks (or stock options) that are also highly ranked, but this introduces greater risks and volatility. I do not track performance of the ideas mentioned here as a managed portfolio.
Disclosure: Author has no positions in stocks or ETFs mentioned.
Disclaimer: This newsletter is published solely for informational purposes and is not to be construed as advice or a recommendation to specific individuals. Individuals should take into account their personal financial circumstances in acting on any rankings or stock selections provided by Sabrient. Sabrient makes no representations that the techniques used in its rankings or selections will result in or guarantee profits in trading. Trading involves risk, including possible loss of principal and other losses, and past performance is no indication of future results.